

Briefly: in our opinion, full (250% of the regular size of the position) speculative short positions in gold, silver and mining stocks are justified from the risk/reward perspective at the moment of publishing this Alert.
Among gold's many ratios, the one with the general stock market is currently particularly important. Not only because the latter declined profoundly, but also because the link between both markets is now particularly strong. There were only two cases in the previous decades when gold and stocks behaved like they do now. And they were both followed by something epic.
Before discussing the above, let’s check the weekly and daily changes on the key precious metals charts, starting with gold.
Precious Metals’ Reversals
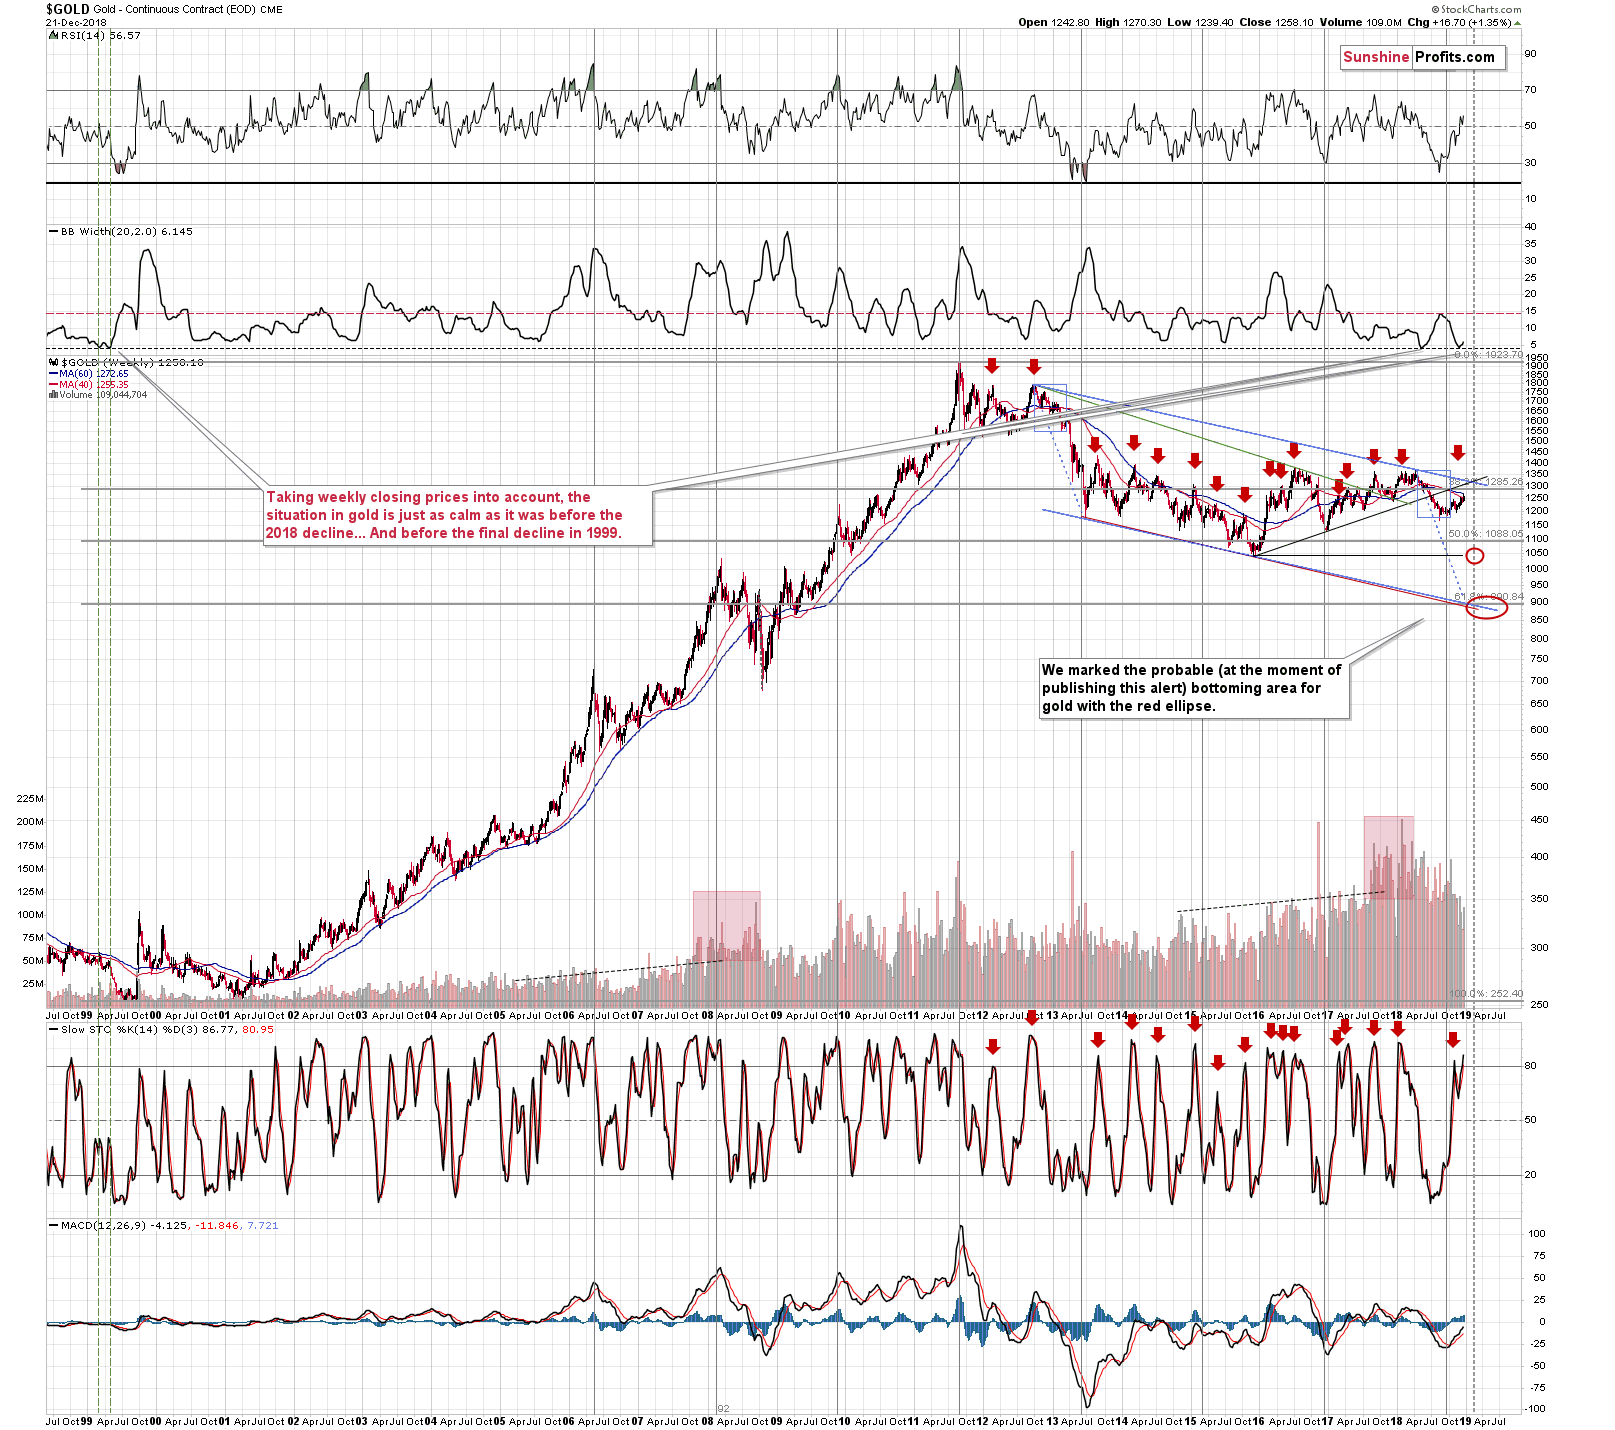
The 60-week moving average is more reliable as support and resistance for gold than the 40-week or 200-day MAs. Gold moved to the former moving average and then declined, which is a bearish indication. What’s more important though is that it closed the week visibly below its intraday highs. Last week’s intraday high was $1,270.30 and gold closed at $1,258.10. Gold still ended the week about $16 higher, but almost half of the entire weekly gain was erased before the week was over. That’s far from being impressive strength, which confirms the entire nature of the recent upswing. Gold moved higher in a zig-zag fashion, just like it does during corrections. That’s one of the most typical ways for any market to correct.
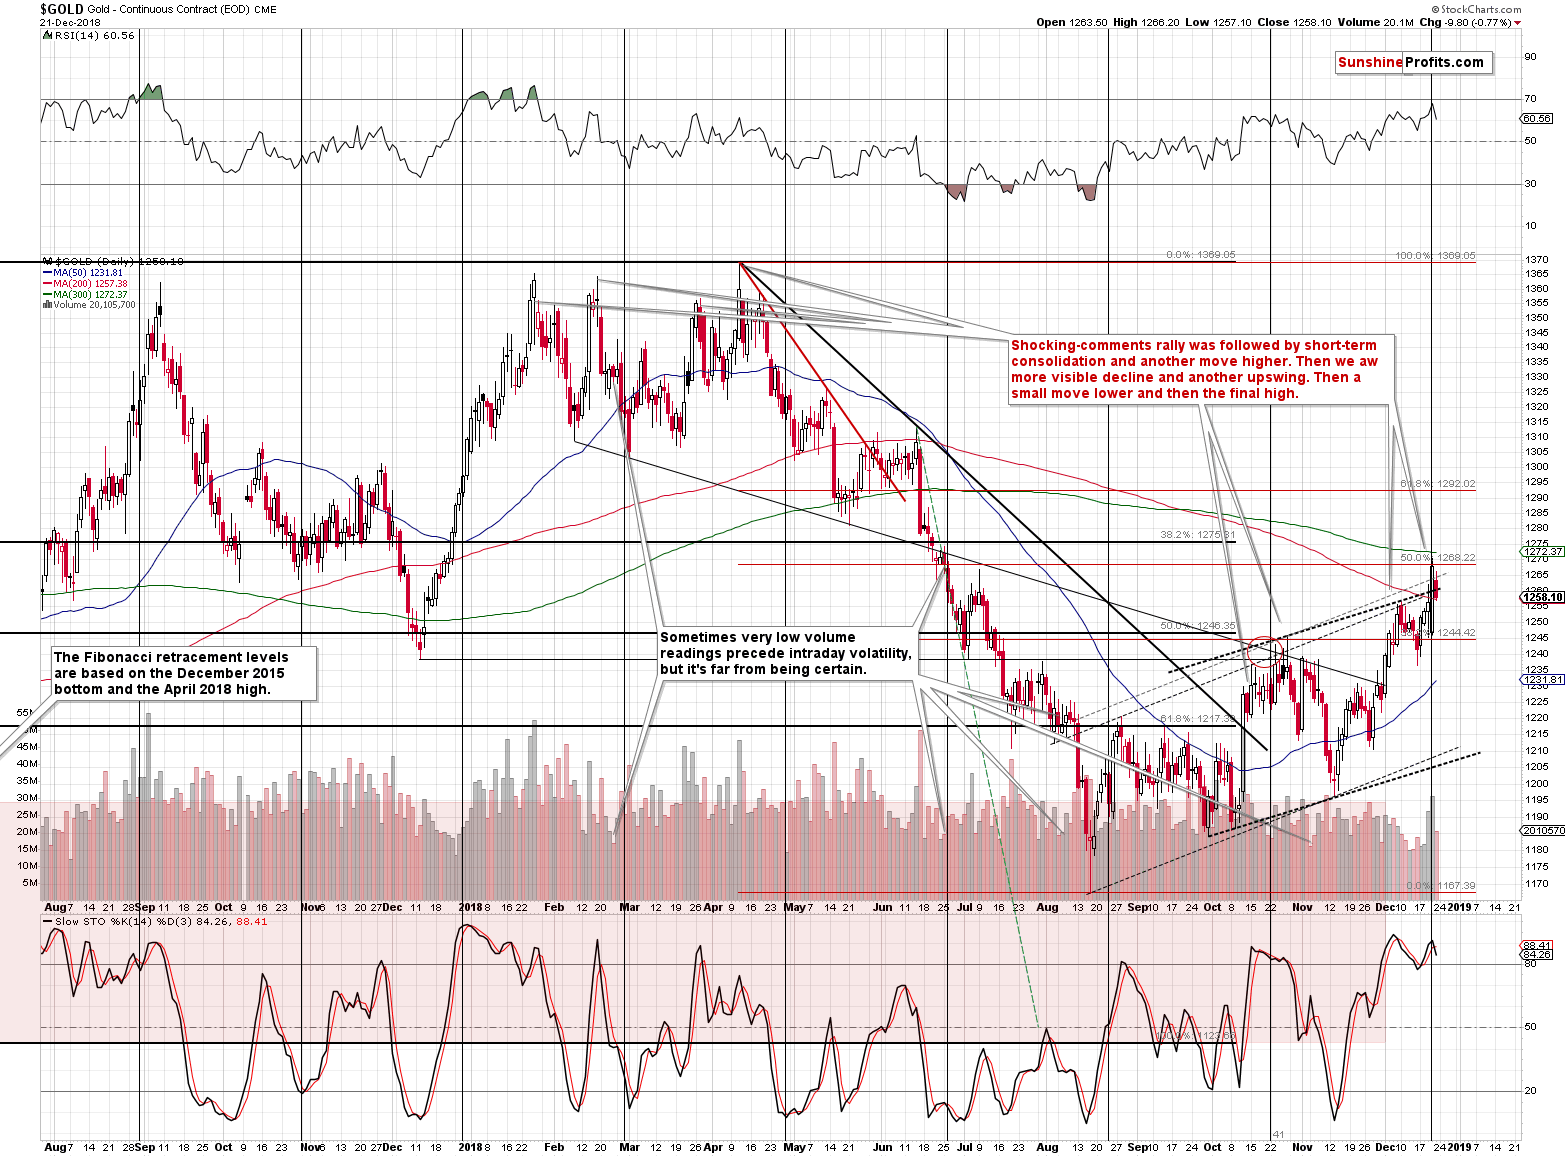
On a short-term note, we see that, just as we had described earlier, gold closed the week back below the upper border of the rising trend channel, thus invalidating the previous breakout. This means that our Friday’s comments on the above chart remain up-to-date:
The yellow metal corrected to the 50% Fibonacci retracement level, the July high, and it very insignificantly broke above the previous rising support lines (the upper border of the rising trend channel). This is a strong combination of resistance. It all happened on big volume and right at gold’s cyclical turning point, which very strongly suggests that this move was excessive and temporary. A reversal. The RSI is close to 70, which means that a topping action is to be expected and the above signs fit this indication very well.
There is also an important non-price-and-volume factor for gold. Gold just got Cramerized. The Mad Money host is largely followed, mostly by the individual investors, not by institutions or sophisticated investors. Individual, unexperienced investors tend to enter the market right at the tops after seeing that a given investment is popular and that it provided some gains in the recent past. And it’s difficult to imagine a more direct signal that they could get than gold being featured as a buy by Jim Cramer. Maybe Oprah’s recommendation would be even more important in that regard? It’s a tough call, but what is clear is that gold price got a significant boost and it was quite likely from the extreme case of the making-headlines factor.
Tiny, unconfirmed breakout + very good chance that it was the general investment public that was buying + huge volume + cyclical turning point + resistance levels + RSI = great time to be positioned for profiting on the upcoming price decline in gold.
On a side note, gold getting Cramerized is a good explanation of why silver didn’t outperform gold even if we just saw an important top. Silver simply wasn’t featured – gold was.
And how did silver fare last week?
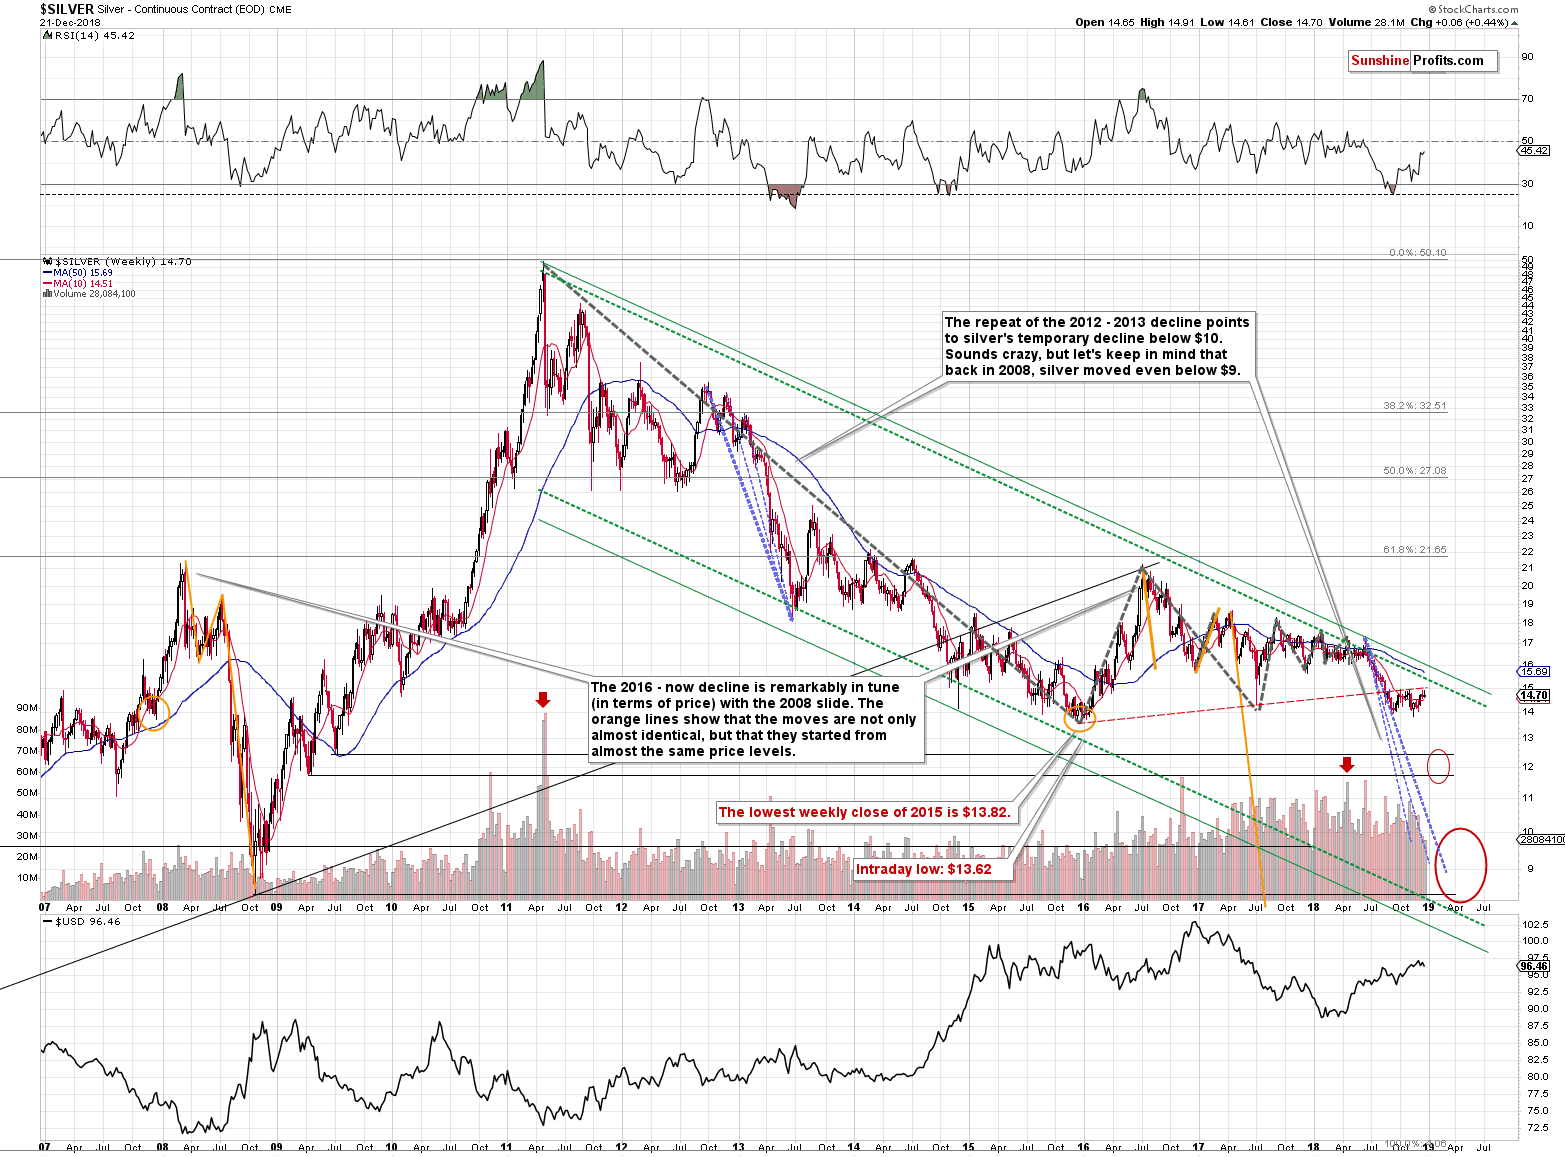
Silver ended the week just $0.06 higher. It was a – less then perfectly shaped, but still – weekly reversal in silver as the intraday high was at $14.91 and the closing price was $14.70. Silver gave away most of its early gains.
That’s not surprising given the breakout in gold to silver ratio and taking into account silver’s breakdown below the rising medium-term support line, which has already turned into resistance.
Silver’s weekly reversal and the fact that it remains below the medium-term resistance (and close to it) is a clearly bearish combination and there’s not much more that we can say about it.
Gold Stocks: Similarities and Implications
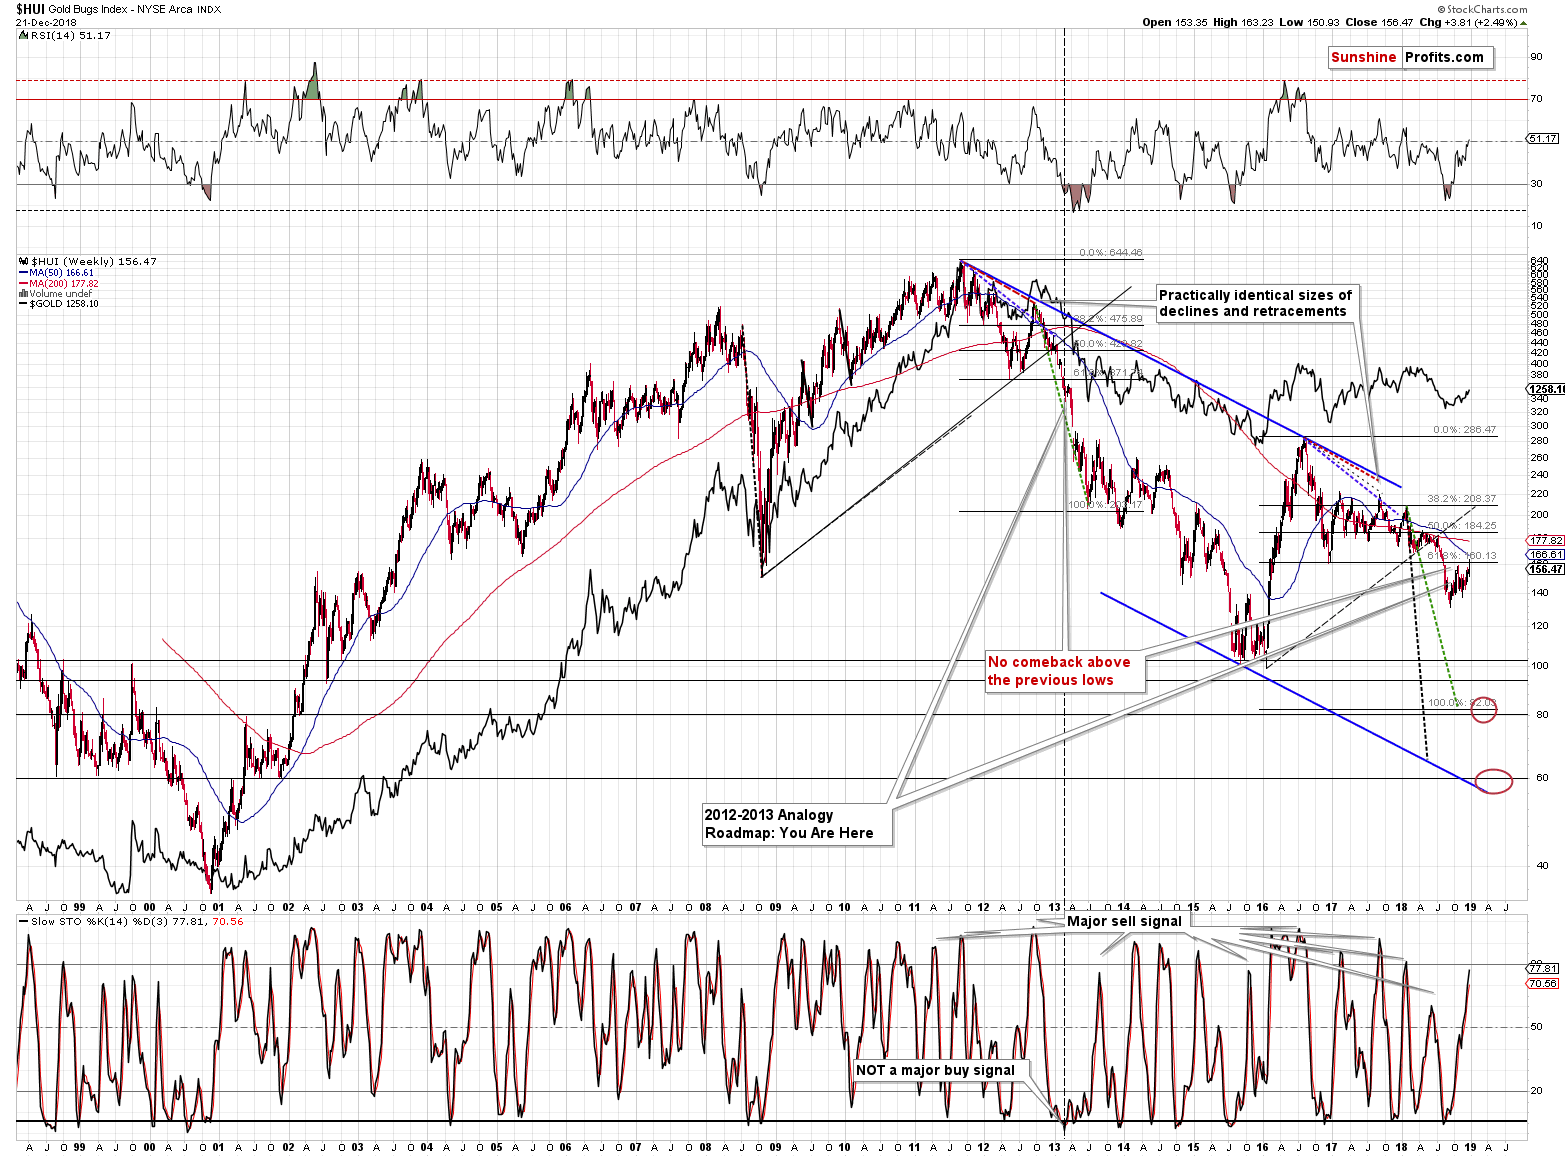
The situation on the HUI Index’s very long-term chart is a specific combination of what we saw in gold and what we saw in silver.
Just like gold, the HUI moved higher in a zig-zag shaped corrective upswing, and just like what we saw in silver, the gold miners moved to an important, medium-term resistance and didn’t manage to break above it. In case of the gold miners, the resistance is provided by the late-2016 bottom. Gold miners moved higher in the previous weeks, but this move appears to be nothing more than the verification of the previous breakdown.
Also, just like in silver, we saw a weekly reversal candlestick. It was a long-legged doji candlestick, which shows great uncertainty among investors. The above is a general definition of the candlestick. Let’s keep in mind that this definition takes all investors into account and since we know gold just got Cramerized, it seems that the part of the market that was pushing the miners higher was the less sophisticated one. This suggests bearish implications of the pattern.
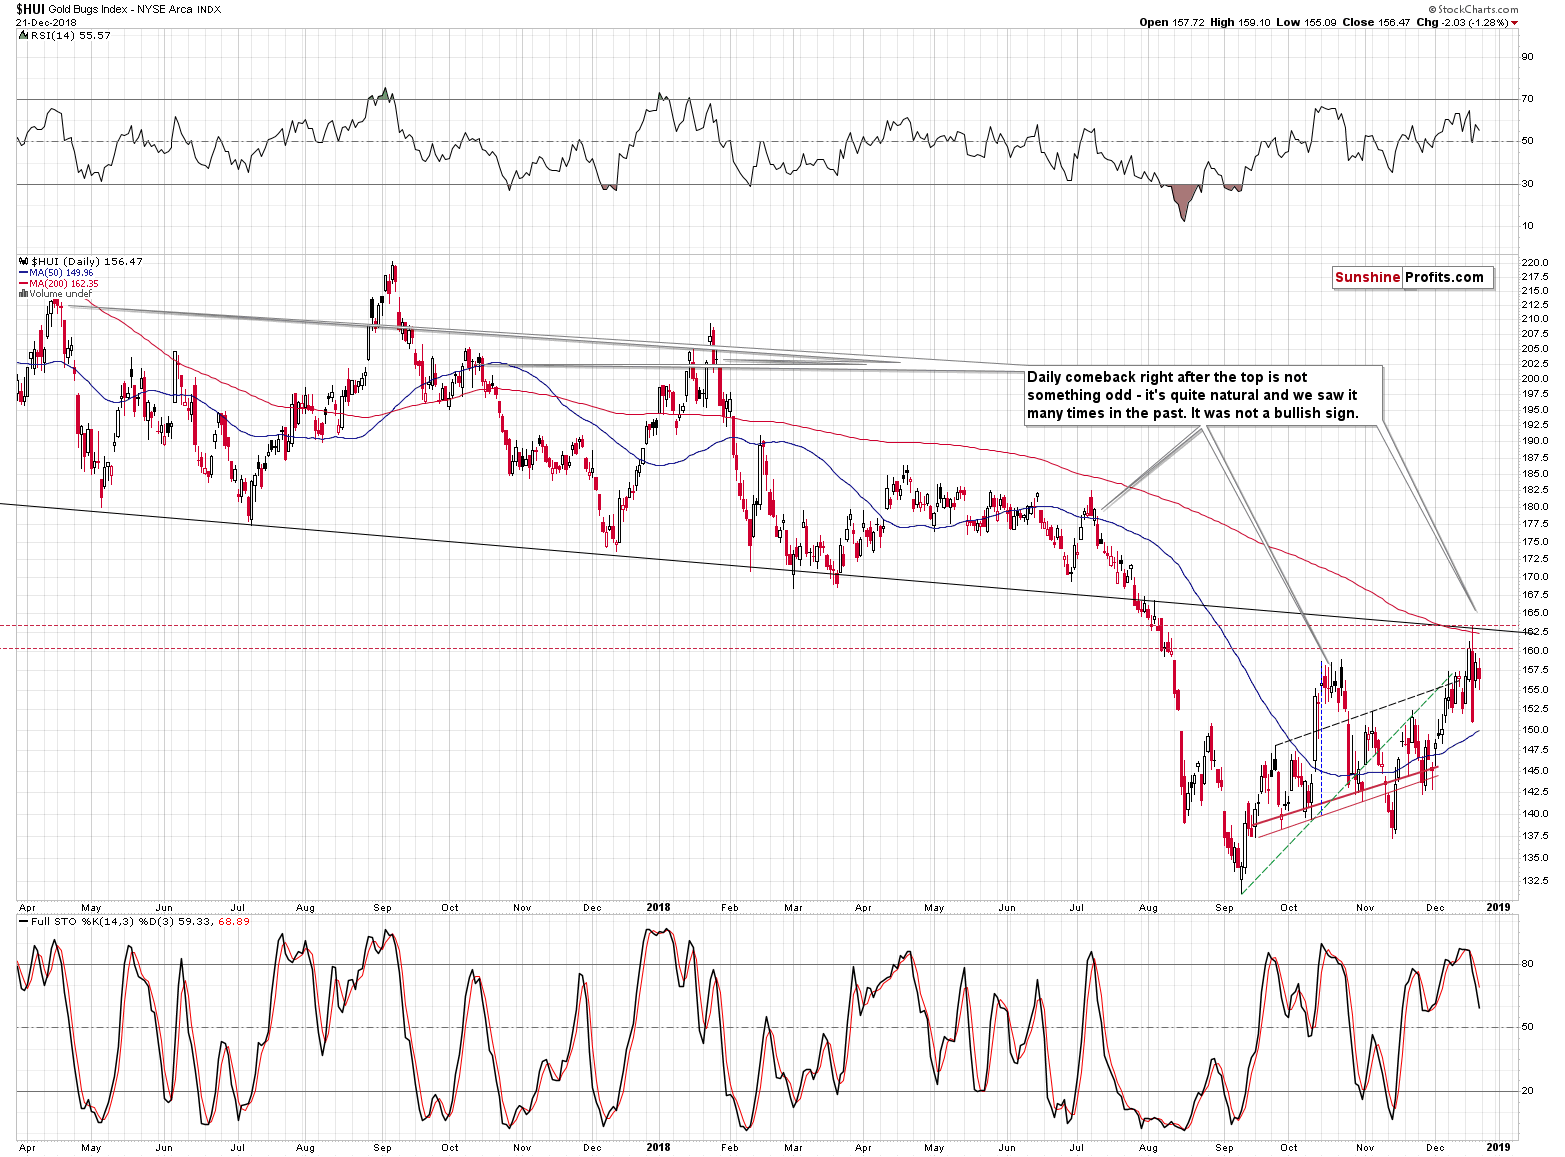
On a day-to-date basis we see that miners simply declined on Friday and we also see that the sell signal from the Stochastic indicator is now very clear. Our previous comments on the above chart remain up-to-date:
Gold miners moved higher and while yesterday’s upswing was not as significant as Wednesday’s downswing, it definitely made many investors and traders question the validity of the initial move lower. No wonder – it’s quite natural to question a move that appears to have been just a one-day event that doesn’t change anything overall as the price is back up.
It was not just a one-day event. It was the big crack on the massive dam that is now followed by a (dramatic?) pause. Those who are not looking carefully, are either ignoring what happened, or are reassuring themselves that it was nothing and that it’s over. Of course, the perma-bullish camp can say the same thing about us. But, the fact (!) is that yesterday’s action was normal in a way, and bearish in another way. It was not bullish.
It was normal, because we saw many cases when the start of the declines in the HUI Index was immediately followed by a quick rebound. It didn’t change anything with regard to the decline’s continuation. We marked several such cases on the above chart. It was not always the case, but it took place often enough to view this as something normal, not a bullish indication.
It was bearish, because gold made new high yesterday and gold miners didn’t. They underperformed on such important occasion. Moreover, the sell signal from the Stochastic indicator remains in place and it’s been effective it was in detecting the previous major declines.
In Friday’s Alert, the above was followed by the analysis of the USD Index and it seems to be a good idea to discuss this market also today. On Friday, we explained why the long-term outlook for the USD Index remains bullish, and since nothing changed from this perspective, let’s focus on the short-term changes.
USD’s Bullish Invalidation
We previously described the above chart in the following way:
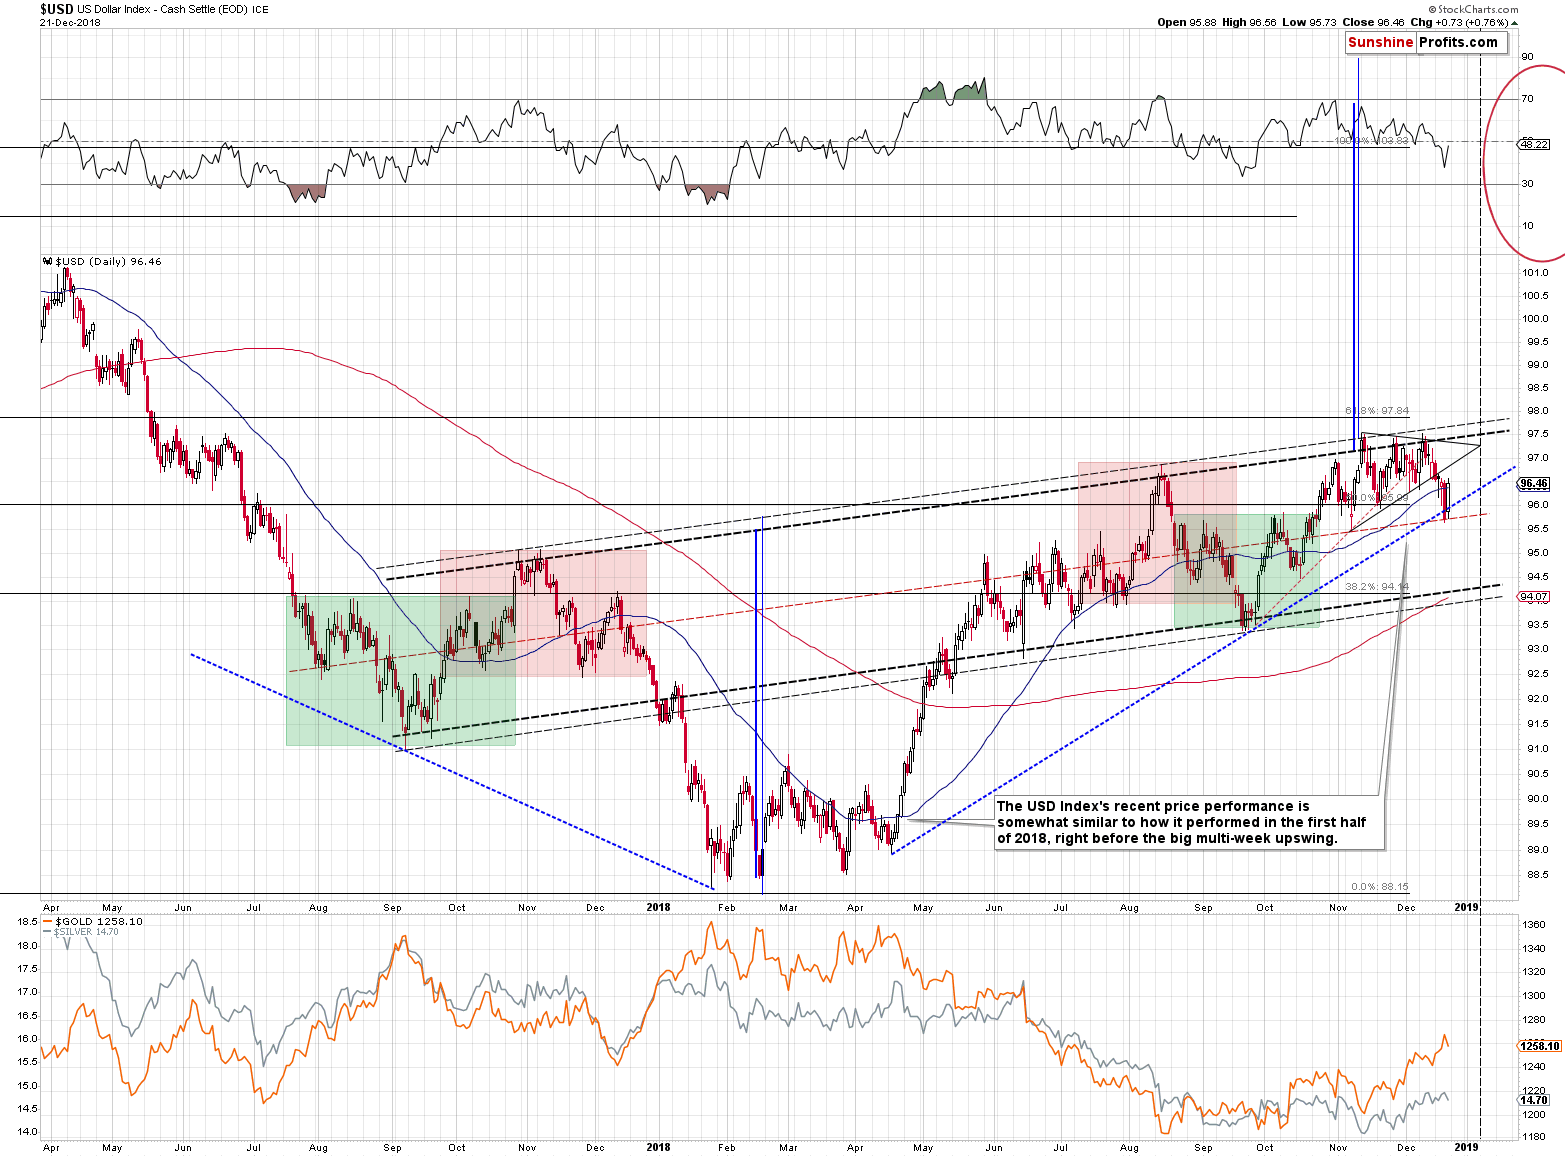
Some things changed, and some things didn’t. The thing that did change is the extent, to which the last few weeks were similar to the January – April bottoming pattern. It’s no longer a near-perfect similarity, at least not in the way that we described it earlier. Yesterday’s low didn’t take the USD Index below the November low, so the patterns are still somewhat similar to the previous bottom and in this case, this week’s decline would be the analogy to the late-March or mid-April decline.
Please keep in mind that the thing that triggered the final decline in the USD Index and the final bottom were comments from US Treasure Secretary Steven Mnuchin, who said that the US welcomes lower US dollar values. This is not something that should have been said. It caused sharply lower USD values in the very short term and was followed by much higher values in the rest of the year. Please note that these comments started a few-month long consolidation and the USD Index rallied only after it was completed.
Fast forward to October 2018. Trump makes “crazy comments” about Fed’s interest rate policy and the USD declines shortly thereafter. And… It started a consolidation pattern that’s been in place for a few months now. The current post-comments consolidation is not as long as the previous one, but it’s not much shorter either.
The action in gold and the 4 tops that we recently saw and marked on the gold chart earlier today, suggest that the analogy to what happened in the first half of this year is likely already completed. This might also be the case for the USD Index.
The technical details that suggest so are the tiny breakdown below the rising medium-term support line that we marked with blue (most important support line of this year) and the move back to the middle of the trading range (marked with red) of the rising trend channel.
The breakdown below the rising blue support line is too small to be viewed as confirmed and since it was just one day below it, we would need to see two additional closes below it to view the breakdown as confirmed. Without the confirmation, the breakdown is not particularly important. The USD Index moved a bit higher today, so it might invalidate this breakdown as early as today.
The USD Index has indeed invalidated the tiny breakdown and it did so in a clear manner. At the same time the USDX invalidated the move below it 50-day moving average. The latter is not as important as the invalidation of the move below the rising blue support line, but it makes the bullish signal even stronger. Bullish, because invalidations of breakdowns are bullish developments on their own.
The outlook for the USD Index is bullish, which has bearish implications for the precious metals sector.
Stock Market’s Link with Gold: Additional Details
After receiving very positive feedback to our discussion of the link between stocks and gold, we decided to supplement it with more details. As a reminder, we summarized yesterday’s section dedicated to this issue in the following way:
(…) stocks’ bottom is likely at hand or already in and that it very likely corresponds to gold’s top. It also suggests that stocks rally will be magnified by gold and that the latter will fall really far.
We also wrote that sometimes gold moves in tune with stocks and sometimes they move in the opposite directions. Let’s consider two ways, in which we can describe this link: direction and strength.
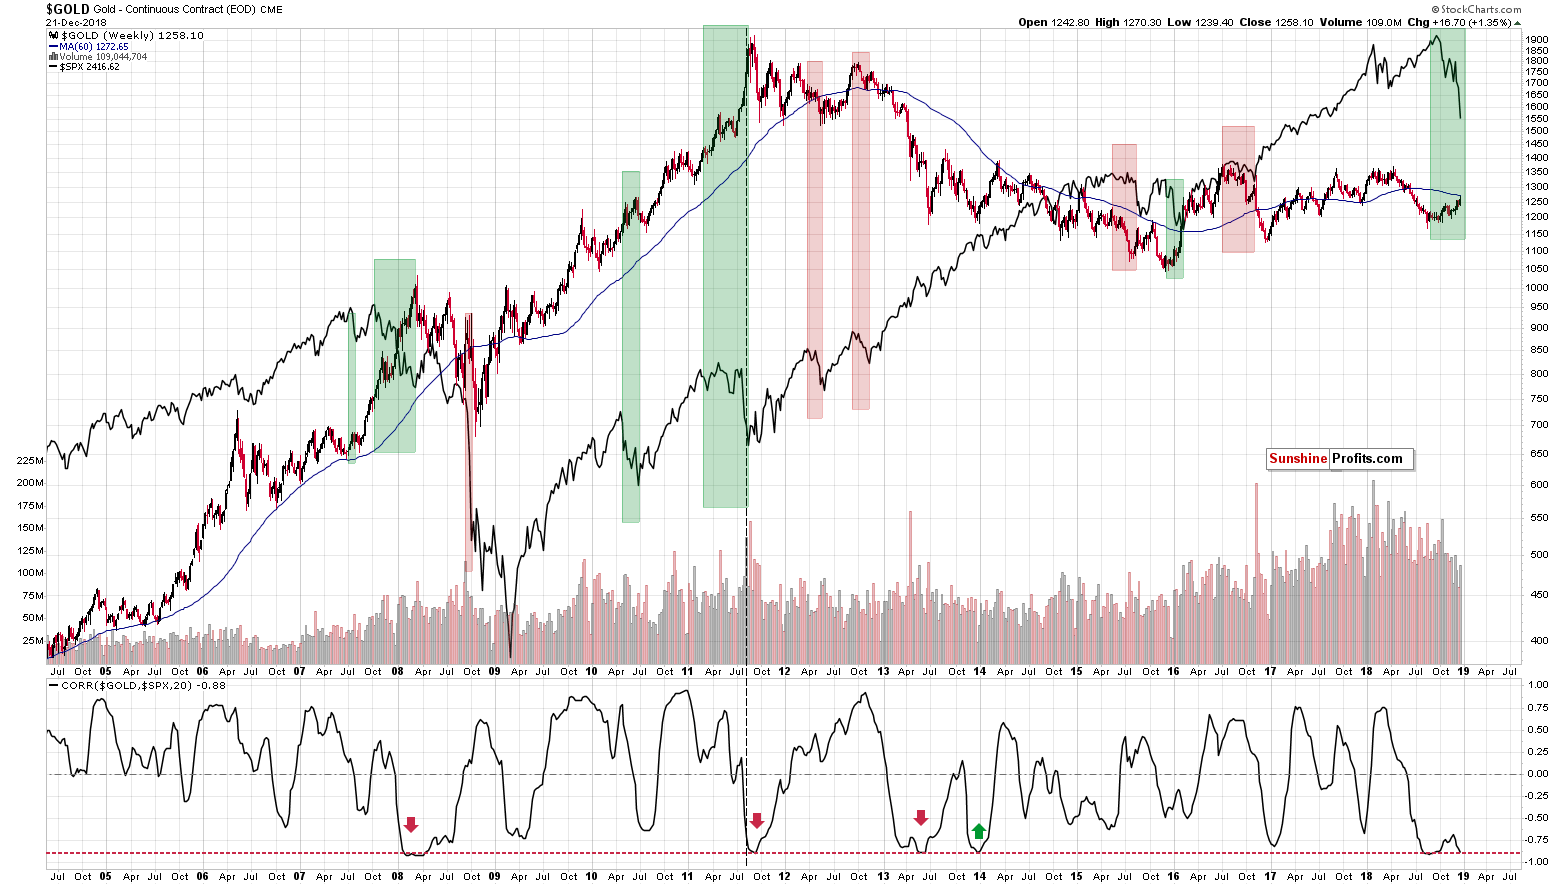
The directions changes, as we discussed previously, and the above chart shows how gold reacted to stocks’ sizable declines. The green rectangles are cases when gold rallied along with lower stocks, and the red rectangles are cases when gold declined along with lowers stocks.
There are only three previous cases when the stocks dropped significantly in terms of both: price and time. That was in 2008, 2011, and in late 2015 – early 2016. The first two cases were followed by gold’s biggest and sharpest declines and the last case was followed by a sizable counter-trend rally in gold. With only three similar cases, the link seems somewhat bearish, but close to being neutral. However, this changes when we consider that the strength factor and all the reasons due to which the current situation is not like 2016 that we discussed in the last few Alerts.
The red, dashed line on the bottom of the above chart emphasizes the situations that are similar to the current one in terms of strength of the link. When the correlation becomes so strongly negative that it reaches the red line, something major usually happens.
We saw that four times in the previous years: in 2008, 2011, in 2013 (before the decline), and in late-2013 – early-2014 (at the bottom). The first three cases were followed by major declines and only the last case was followed by (counter-trend, but still) a rally. The 3 out of 4 efficiency has bearish implications on its own, but the truly important and remarkable thing becomes visible when we combine both aspects.
When did we see gold rallying along with declining stocks, when the link between them was as strongly negative as it is now? In only two cases: in 2008 and in 2011. These were the most important tops in gold in the past 20 years or so. Even though gold didn’t move much higher in the past weeks, the situation – with regard to stocks – seems just as extreme as it was in both of them. The implications are beyond-words bearish for the following months and weeks.
Summary
Summing up, this prolonged correction within the big downtrend has been very tiring, but based on the long-term factors being patient was very well worth it, and based on the short-term signs it seems that the waiting is over or about to be over. The outlook for the precious metals market remains very bearish for the following weeks and months and short position remains justified from the risk to reward point of view, even if we see a few extra days of back and forth trading or even a small brief upswing. There is a very high probability of a huge downswing that makes the short position justified, not the outlook for the next few days. It's confirmed by multiple factors, i.a. weekly reversals, silver’s recent outperformance and reversal exactly when it was most likely, gold’s performance link with the general stock market, gold getting Cramerized, mining stocks not making new highs while gold does, and the bullish outlook for the USD Index.
On an administrative note, there will be no regular Alerts tomorrow (Tuesday) and on Wednesday, but if anything major happens, we will send you a quick message nonetheless.
As always, we’ll keep you – our subscribers – informed.
To summarize:
Trading capital (supplementary part of the portfolio; our opinion): Full short positions (250% of the full position) in gold, silver and mining stocks are justified from the risk/reward perspective with the following stop-loss orders and exit profit-take price levels:
- Gold: profit-take exit price: $1,062; stop-loss: $1,303; initial target price for the DGLD ETN: $82.96; stop-loss for the DGLD ETN $45.87
- Silver: profit-take exit price: $12.32; stop-loss: $15.11; initial target price for the DSLV ETN: $47.67; stop-loss for the DSLV ETN $28.37
- Mining stocks (price levels for the GDX ETF): profit-take exit price: $13.12; stop-loss: $21.82; initial target price for the DUST ETF: $80.97; stop-loss for the DUST ETF $21.97
Note: the above is a specific preparation for a possible sudden price drop, it does not reflect the most likely outcome. You will find a more detailed explanation in our August 1 Alert. In case one wants to bet on junior mining stocks’ prices (we do not suggest doing so – we think senior mining stocks are more predictable in the case of short-term trades – if one wants to do it anyway, we provide the details), here are the stop-loss details and target prices:
- GDXJ ETF: profit-take exit price: $17.52; stop-loss: $31.23
- JDST ETF: initial target price: $154.97 stop-loss: $51.78
Long-term capital (core part of the portfolio; our opinion): No positions (in other words: cash)
Insurance capital (core part of the portfolio; our opinion): Full position
Important Details for New Subscribers
Whether you already subscribed or not, we encourage you to find out how to make the most of our alerts and read our replies to the most common alert-and-gold-trading-related-questions.
Please note that the in the trading section we describe the situation for the day that the alert is posted. In other words, it we are writing about a speculative position, it means that it is up-to-date on the day it was posted. We are also featuring the initial target prices, so that you can decide whether keeping a position on a given day is something that is in tune with your approach (some moves are too small for medium-term traders and some might appear too big for day-traders).
Plus, you might want to read why our stop-loss orders are usually relatively far from the current price.
Please note that a full position doesn’t mean using all of the capital for a given trade. You will find details on our thoughts on gold portfolio structuring in the Key Insights section on our website.
As a reminder – “initial target price” means exactly that – an “initial” one, it’s not a price level at which we suggest closing positions. If this becomes the case (like it did in the previous trade) we will refer to these levels as levels of exit orders (exactly as we’ve done previously). Stop-loss levels, however, are naturally not “initial”, but something that, in our opinion, might be entered as an order.
Since it is impossible to synchronize target prices and stop-loss levels for all the ETFs and ETNs with the main markets that we provide these levels for (gold, silver and mining stocks – the GDX ETF), the stop-loss levels and target prices for other ETNs and ETF (among other: UGLD, DGLD, USLV, DSLV, NUGT, DUST, JNUG, JDST) are provided as supplementary, and not as “final”. This means that if a stop-loss or a target level is reached for any of the “additional instruments” (DGLD for instance), but not for the “main instrument” (gold in this case), we will view positions in both gold and DGLD as still open and the stop-loss for DGLD would have to be moved lower. On the other hand, if gold moves to a stop-loss level but DGLD doesn’t, then we will view both positions (in gold and DGLD) as closed. In other words, since it’s not possible to be 100% certain that each related instrument moves to a given level when the underlying instrument does, we can’t provide levels that would be binding. The levels that we do provide are our best estimate of the levels that will correspond to the levels in the underlying assets, but it will be the underlying assets that one will need to focus on regarding the signs pointing to closing a given position or keeping it open. We might adjust the levels in the “additional instruments” without adjusting the levels in the “main instruments”, which will simply mean that we have improved our estimation of these levels, not that we changed our outlook on the markets. We are already working on a tool that would update these levels on a daily basis for the most popular ETFs, ETNs and individual mining stocks.
Our preferred ways to invest in and to trade gold along with the reasoning can be found in the how to buy gold section. Additionally, our preferred ETFs and ETNs can be found in our Gold & Silver ETF Ranking.
As a reminder, Gold & Silver Trading Alerts are posted before or on each trading day (we usually post them before the opening bell, but we don't promise doing that each day). If there's anything urgent, we will send you an additional small alert before posting the main one.
=====
Thank you.
Sincerely,
Przemyslaw Radomski, CFA
Editor-in-chief, Gold & Silver Fund Manager
Gold & Silver Trading Alerts
Forex Trading Alerts
Oil Investment Updates
Oil Trading Alerts

