

Briefly: In our opinion, no speculative short positions in gold, silver and mining stocks is justified from the risk/reward perspective at the moment of publishing this alert.
Taking profits on our short positions and closing them on Thursday turned out to be a good idea. Gold, silver and – on an intraday basis – mining stocks moved higher on Friday, while the USD Index declined. But, is the rally over after just one day? Not likely – gold’s and miners’ turning points are likely to result in something more than just a daily rally. So, how high is gold likely to rally this time? That’s what we discuss in the following part of today’s alert.
But first, let’s take a look at what happened in the USD Index (chart courtesy of http://stockcharts.com).
USD’s Erratic Movement Is Not That Erratic
In the previous analyses, we wrote that we were still skeptical about the USD’s upswing as the confirmation of the USD’s move above the medium-term support / resistance line was still rather weak.
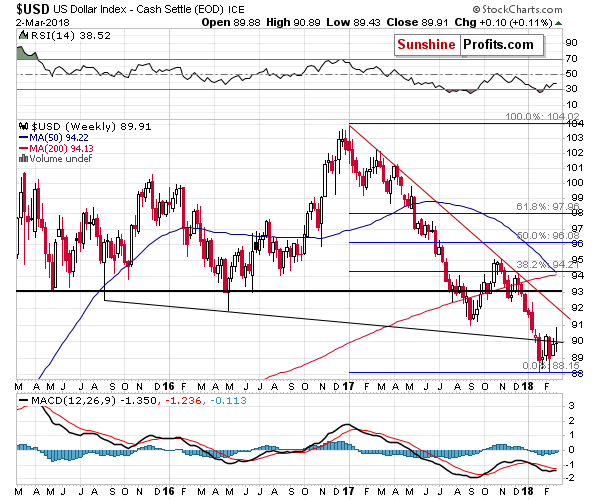
The less bullish view of the situation turned out to be true, as the index closed the week once again below the mentioned declining line. The interesting thing is that it happened after the USD Index corrected to the 38.2% Fibonacci retracement based on the November 2017 – February 2018 downswing.
The former means that the move lower was not accidental but was likely a way for the USD to take a breather during the rally. The move below the medium-term declining line means that the downswing may not be over. Previously, when the USD moved below the medium-term line, it moved to new 2018 lows, and traders definitely remember it. Therefore, some of them will likely bet on the repeat of that scenario. But, will they be correct?
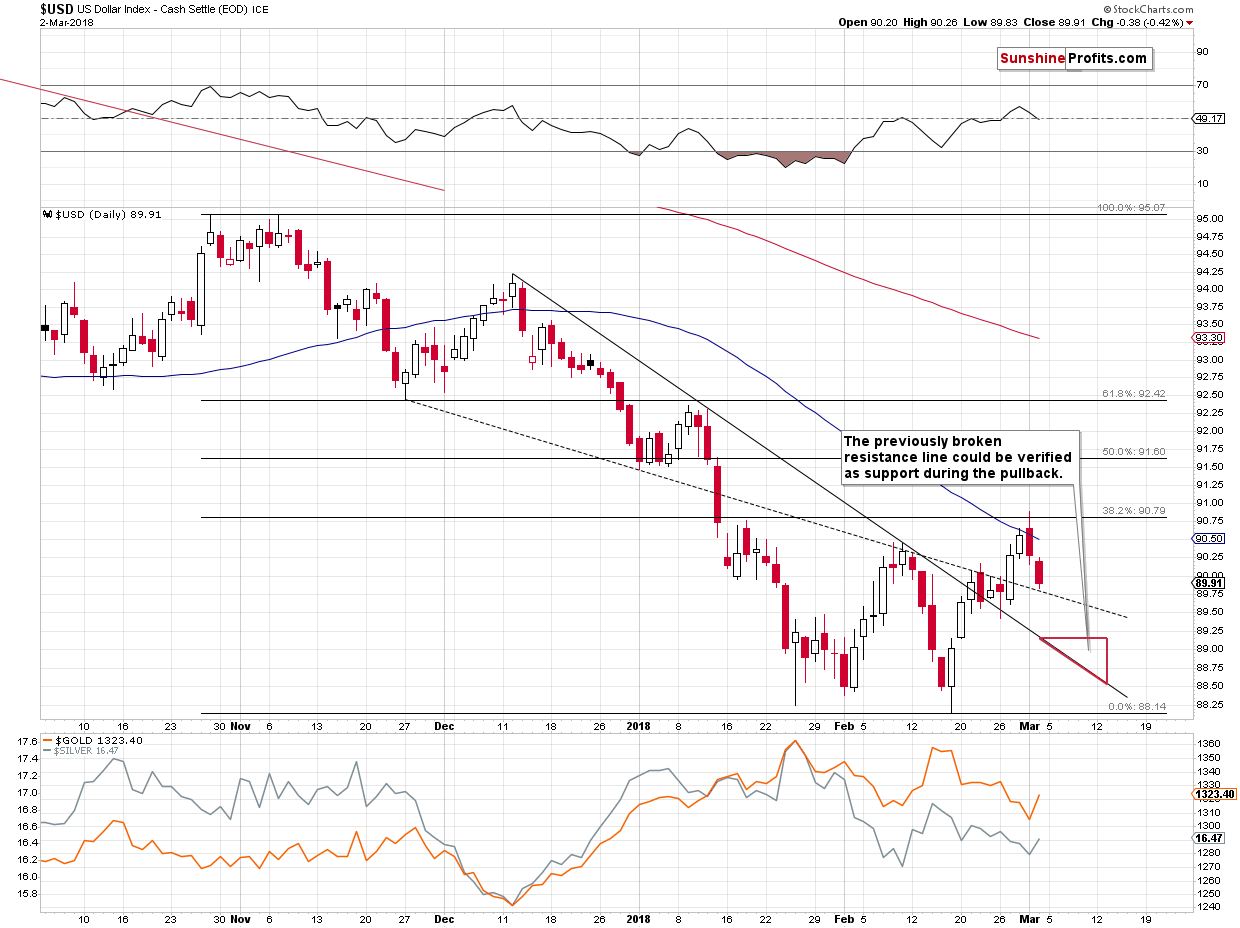
The decline to the February low could be seen, but we doubt it. After all, the USD is after breakouts above the declining short-term support / resistance lines, so a move back to one of them seems more likely. This means the USD could decline to about 89 or so before the rally resumes.
We marked the target area with a red triangle. We think that the declining support line will trigger a reversal and we don’t think that the decline will take longer than a week. The latter is based on the pace at which the USD declined previously and also on gold’s triangle apex reversal – if gold is likely to reverse course in a week or so, then something similar could be seen in the USD.
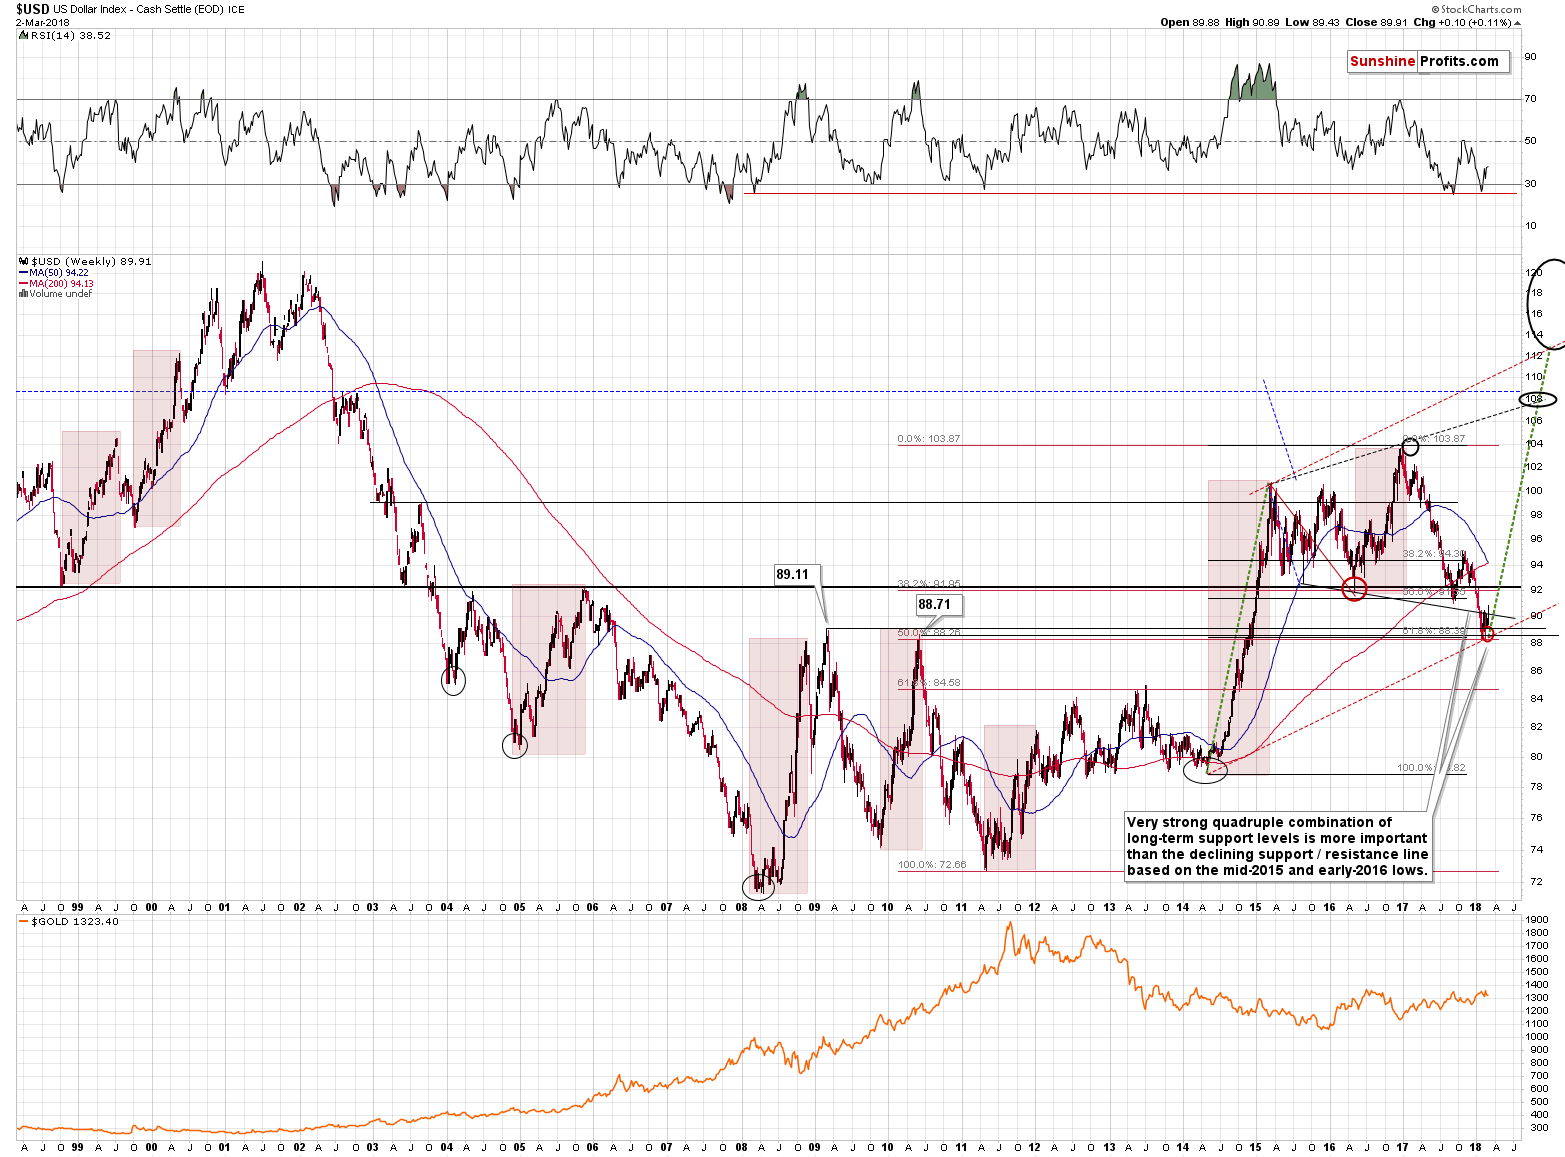
Let’s keep in mind that the USD Index is above a combination of very strong support levels, stronger than the mentioned medium-term support/resistance line. So, the fact that the USD closed the previous week below it, has only short-term implications, not long-term ones.
Gold’s Upside Target
Before providing you with a target area, let’s begin by recalling gold’s triangle apex reversal (we discussed it more thoroughly on Monday):
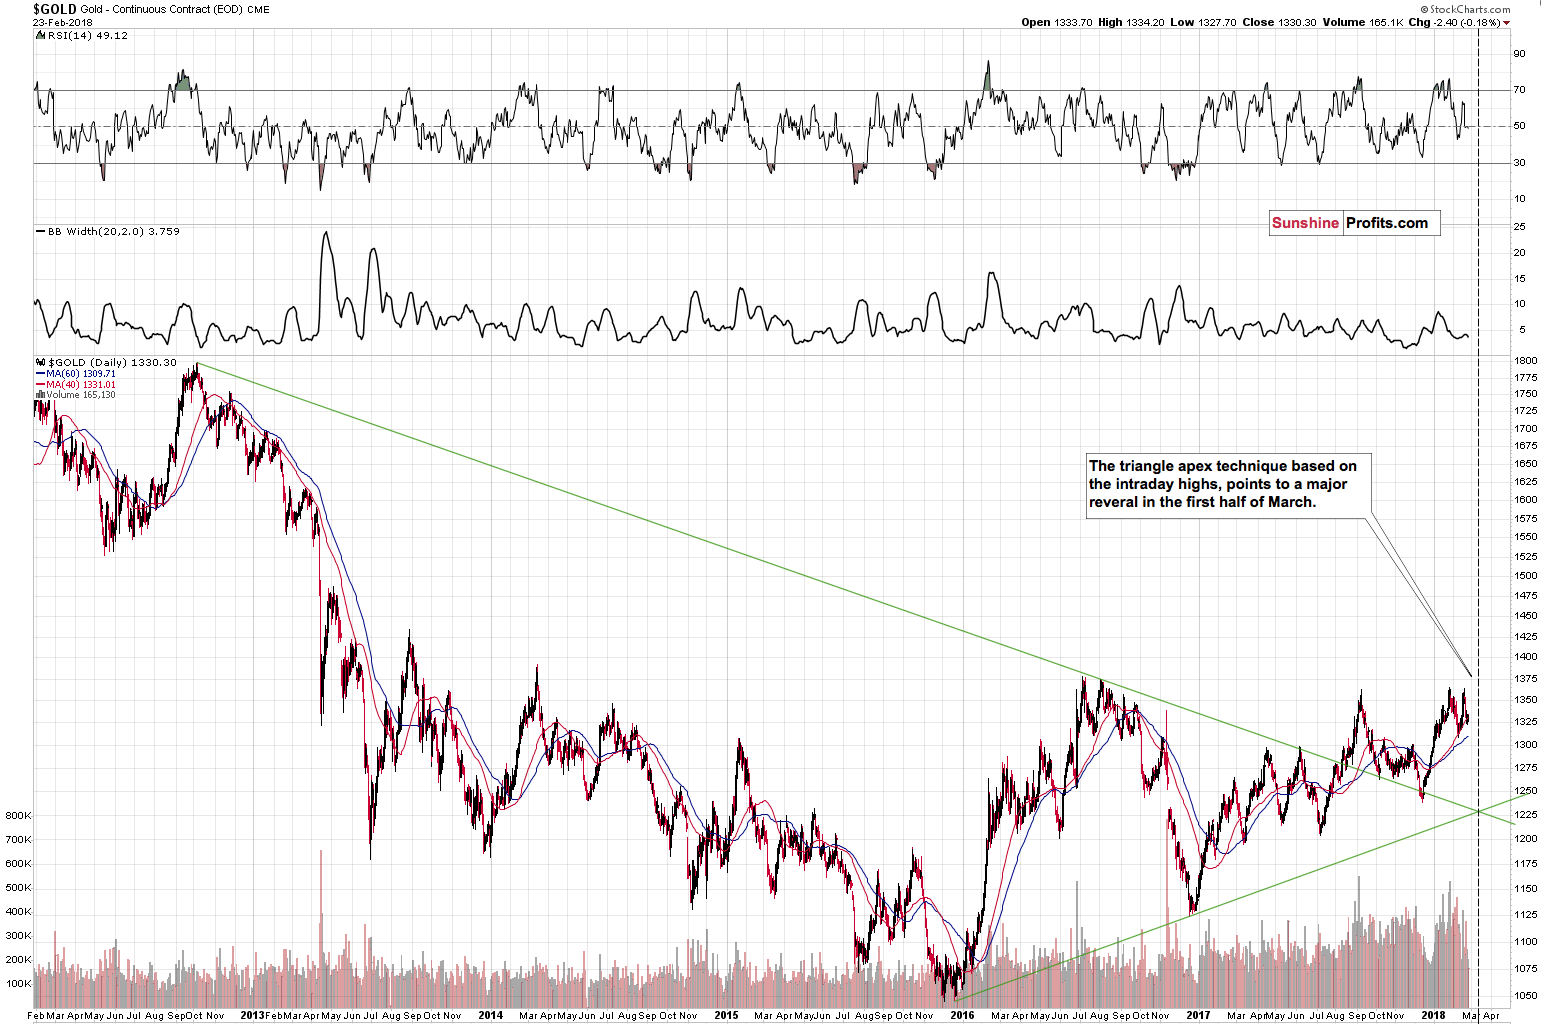
The apex of the triangle marks an important reversal date. We elaborated on this technique in the previous alerts, so we don’t want to go into the details once again. Long story short, the usefulness of this technique has been confirmed for the precious metals sector multiple times, including the recent cases (including the February 9 powerful reversal in mining stocks), so it’s something gold traders should take into account.
What we would like you to focus on is that we posted the above chart a week ago and wrote that a reversal could be seen in two weeks. One week has already passed, so we should now expect gold to reverse its course either late this week or early during the next.
The employment numbers are going to be released on Friday and they are quite often accompanied by volatile price swings. This could be the perfect trigger for the final part of the upswing. Mario Draghi is going to provide his comments on Thursday, which could also trigger some price swings. Overall, it seems that we should prepare for a Friday reversal and either back and forth movement or an upswing in the meantime.
But how high can gold go?
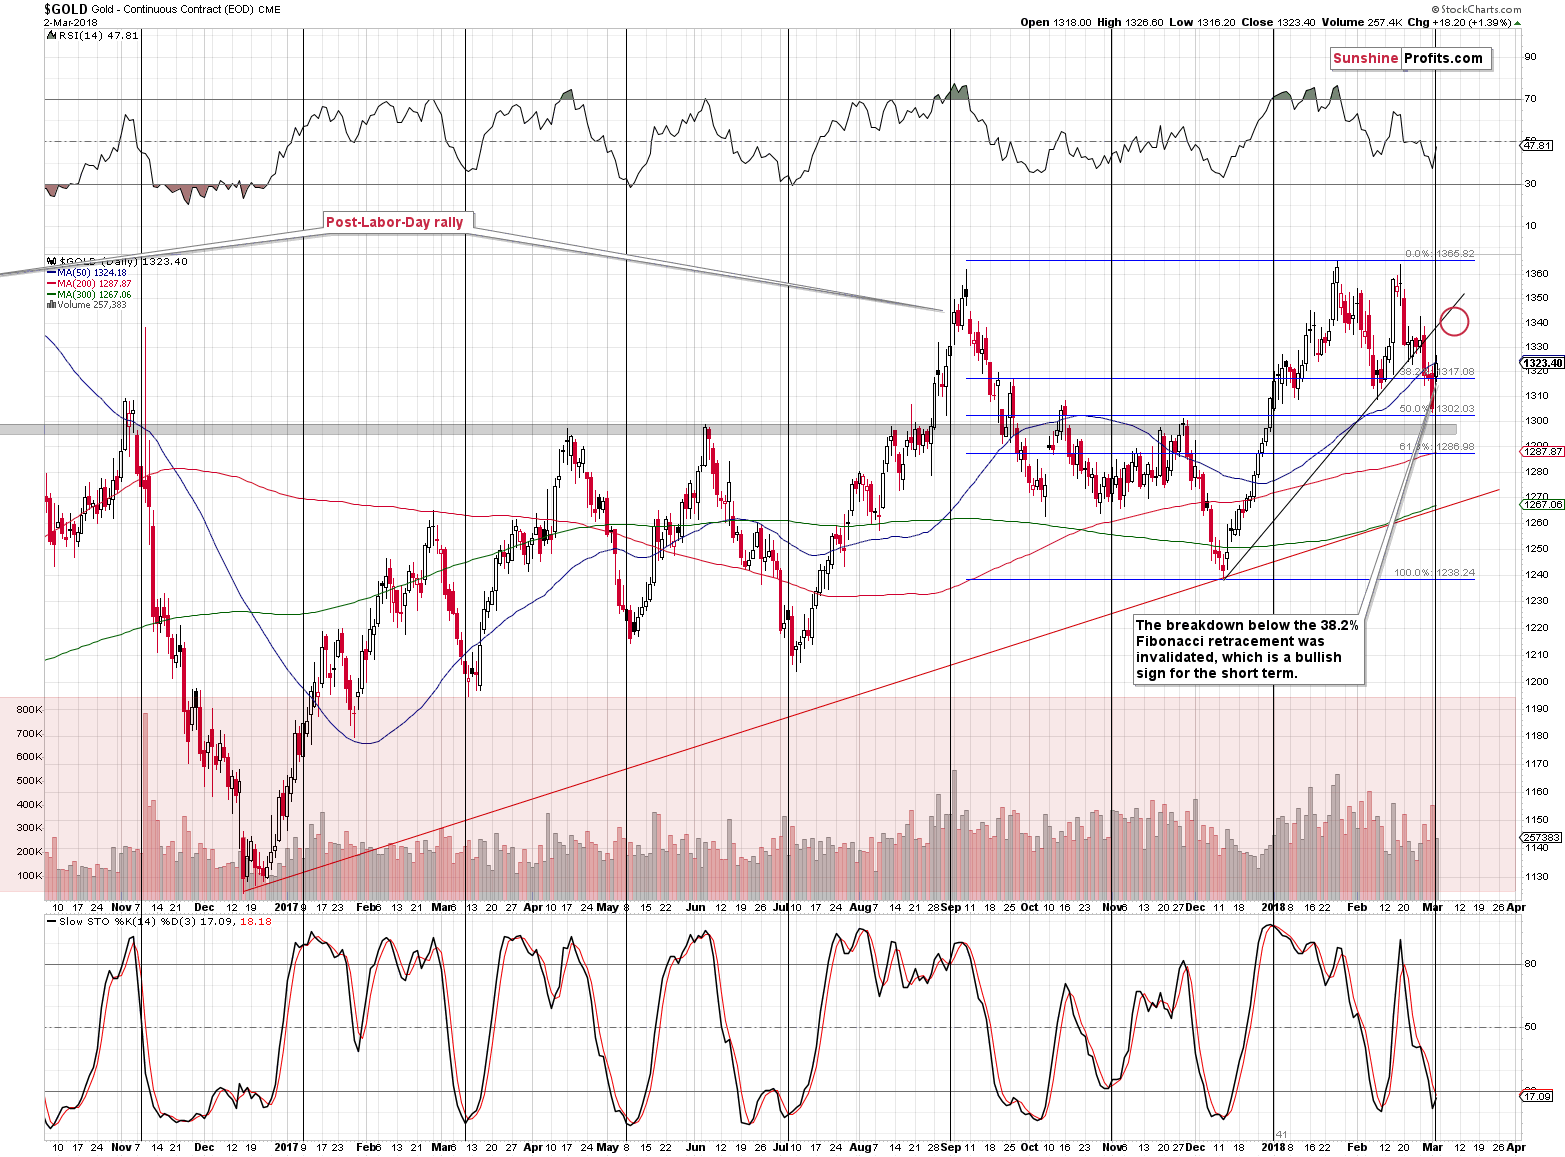
Gold could move to the $1,340s before the rally is over – we marked it with the red ellipse. Why there? That’s where we have the previous intraday high and the rising resistance line. The combination of these short-term resistance levels and the pace at which gold usually rallied both fit a scenario in which gold forms the next local top about $20 higher at the end of the week or very close to it.
Again, let’s keep in mind that a short-term really is most likely all that we’re going to get. There are too many bearish long-term factors in play to view the recent strength as anything more.
Silver and Its Analogy
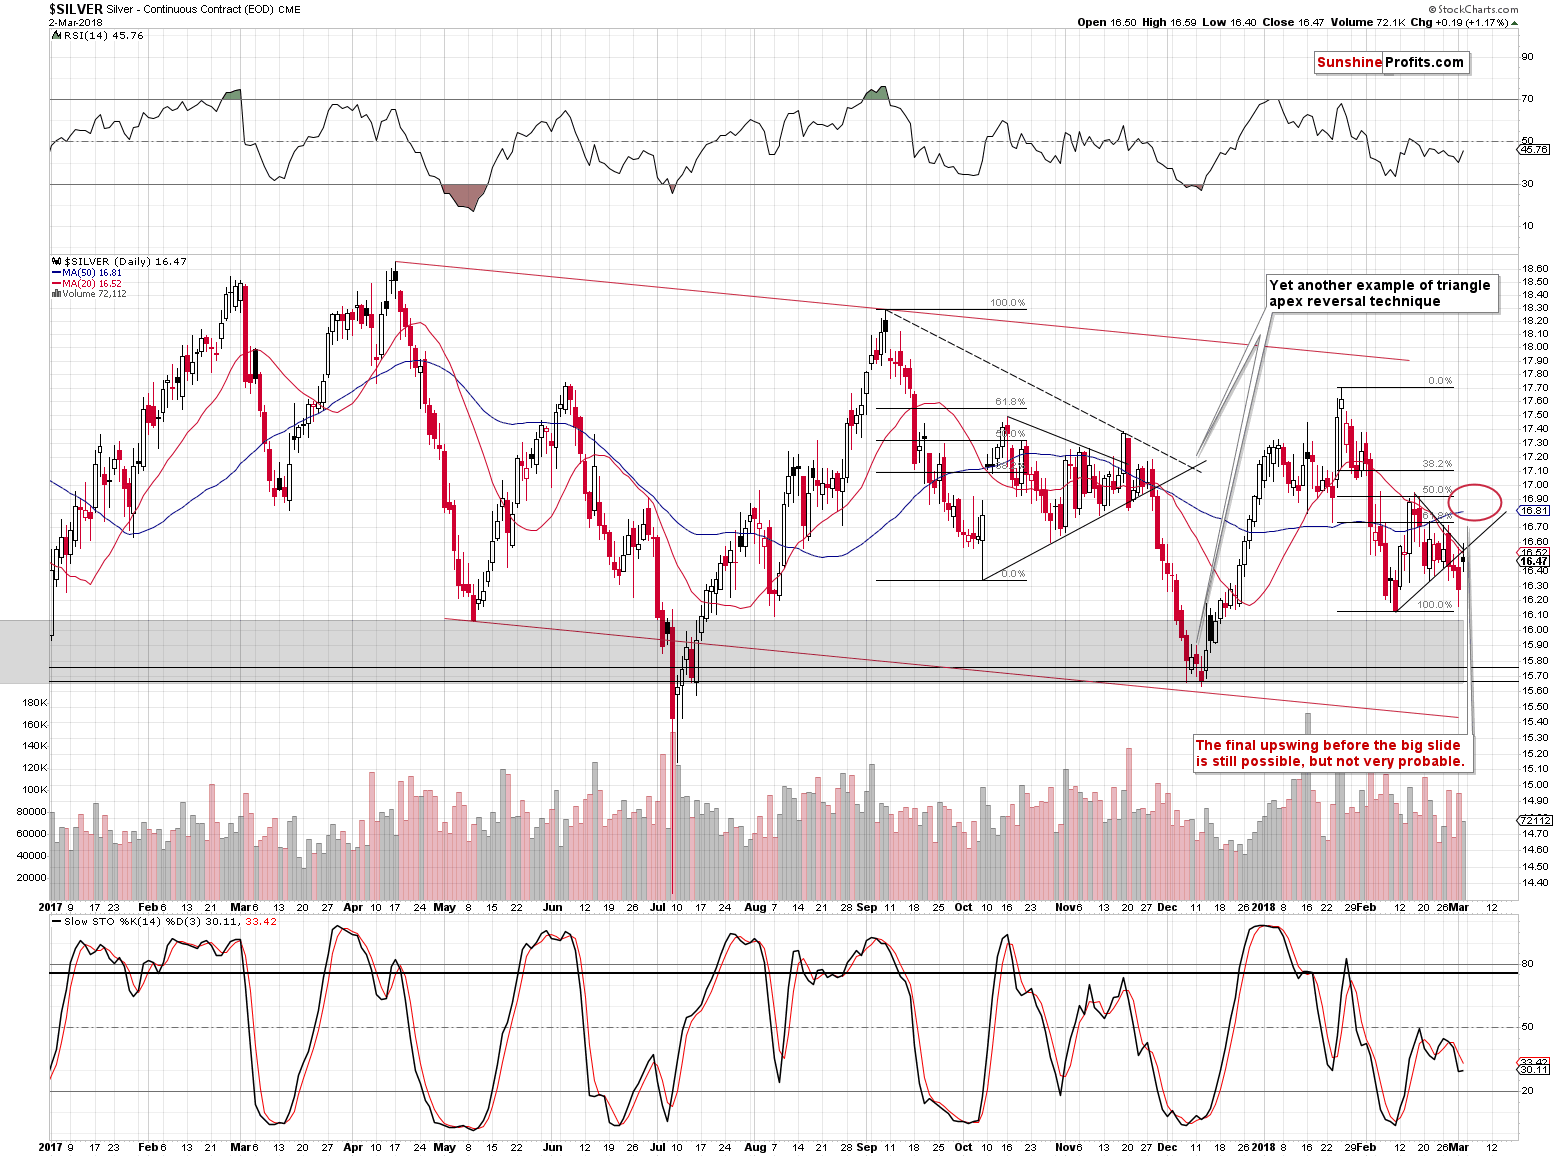
The target for silver is analogous to the one for gold. It seems that the previous high along with the 50-day moving average could stop the rally. To be precise, a small breakout above these levels would not be surprising as that’s what silver tends to do as a confirmation of a top (providing fake breakout signals). That’s why the target area is quite wide.
Moreover, please keep in mind that the current situation in silver is still similar to what we saw after the September 2017 top. Our Tuesday’s comments on the above remain up-to-date:
The January 2018 – February 2018 decline is a quicker version of the September – October 2017 downswing. The subsequent corrections are very similar – in both cases, silver moved a bit above the 50% Fibonacci retracement, but not above the 61.8% one. The following decline erased most of the correction. Then, back and forth trading started where intraday highs were not as high as the highest intraday price of the preceding corrective upswing. The intraday lows of subsequent sessions were increasing.
The initial corrective upswing also took silver above both moving averages: the 20- and 50-day one. Then, the back and forth trading took place around the red moving average, but below the blue one. That’s what happened yesterday – silver moved a bit above the red MA, but not above the blue one.
Having established the self-similarity, let’s see how we can use it.
We can use it to determine the next turning point and the trading opportunity. In this particular case, we see that the final top and the superb opportunity to go short presented itself in mid-November, when silver rallied above the declining resistance line based on the previous intraday highs and visibly above the blue (50-day) moving average.
It took a bit more time for silver to rally in November 2017 than it did for it to decline in October, so in this case, we can expect silver to take a bit more time to rally than it did to decline in the second half of February.
Combining the above price and time analogies, we get the target that we marked with a red ellipse on the above chart. The target is quite wide and there are good reasons for it. Back in November, silver topped below the previous top, but silver is known to get ahead of itself during these intraday outperformance cases, so we’re not ruling out a scenario in which it “breaks out” above the mid-February top only to invalidate the “breakout” shortly thereafter.
As far as time is concerned, please recall that in yesterday’s alert we thoroughly discussed the apex triangle reversal technique for gold and it pointed to two scenarios: one in which the top is already in and a second one in which the top is going to be in in about two weeks (a bit less, counting from today). Moreover, gold’s cyclical turning point is just a few days away, so it could be the case that it triggers silver’s rally and the subsequent reversal. Overall, it’s rather unclear when precisely the silver reversal will take place, but we know more or less when to expect it and we know what signs to look for as a confirmation (silver’s breakouts above the declining, short-term resistance line and the 50-day moving average).
Speaking of apex-triangle-based reversals, please note that the above chart shows yet another confirmation of this technique’s usefulness. The triangle based on the October and November 2017 lows (solid line) and the September and November 2017 tops (dashed line) had their apexes exactly at the time when one would want to reverse their short positions or close them. Perhaps applying this technique to the upcoming decline will serve as a way to detect a short-term reversal as well.
We put the key fragment in bold. Silver’s breakout above the declining, short-term resistance line is at hand and the 50-day MA is not very close yet. Therefore, silver has some room to rally before the confirmation of the final top is in.
Relative Performance
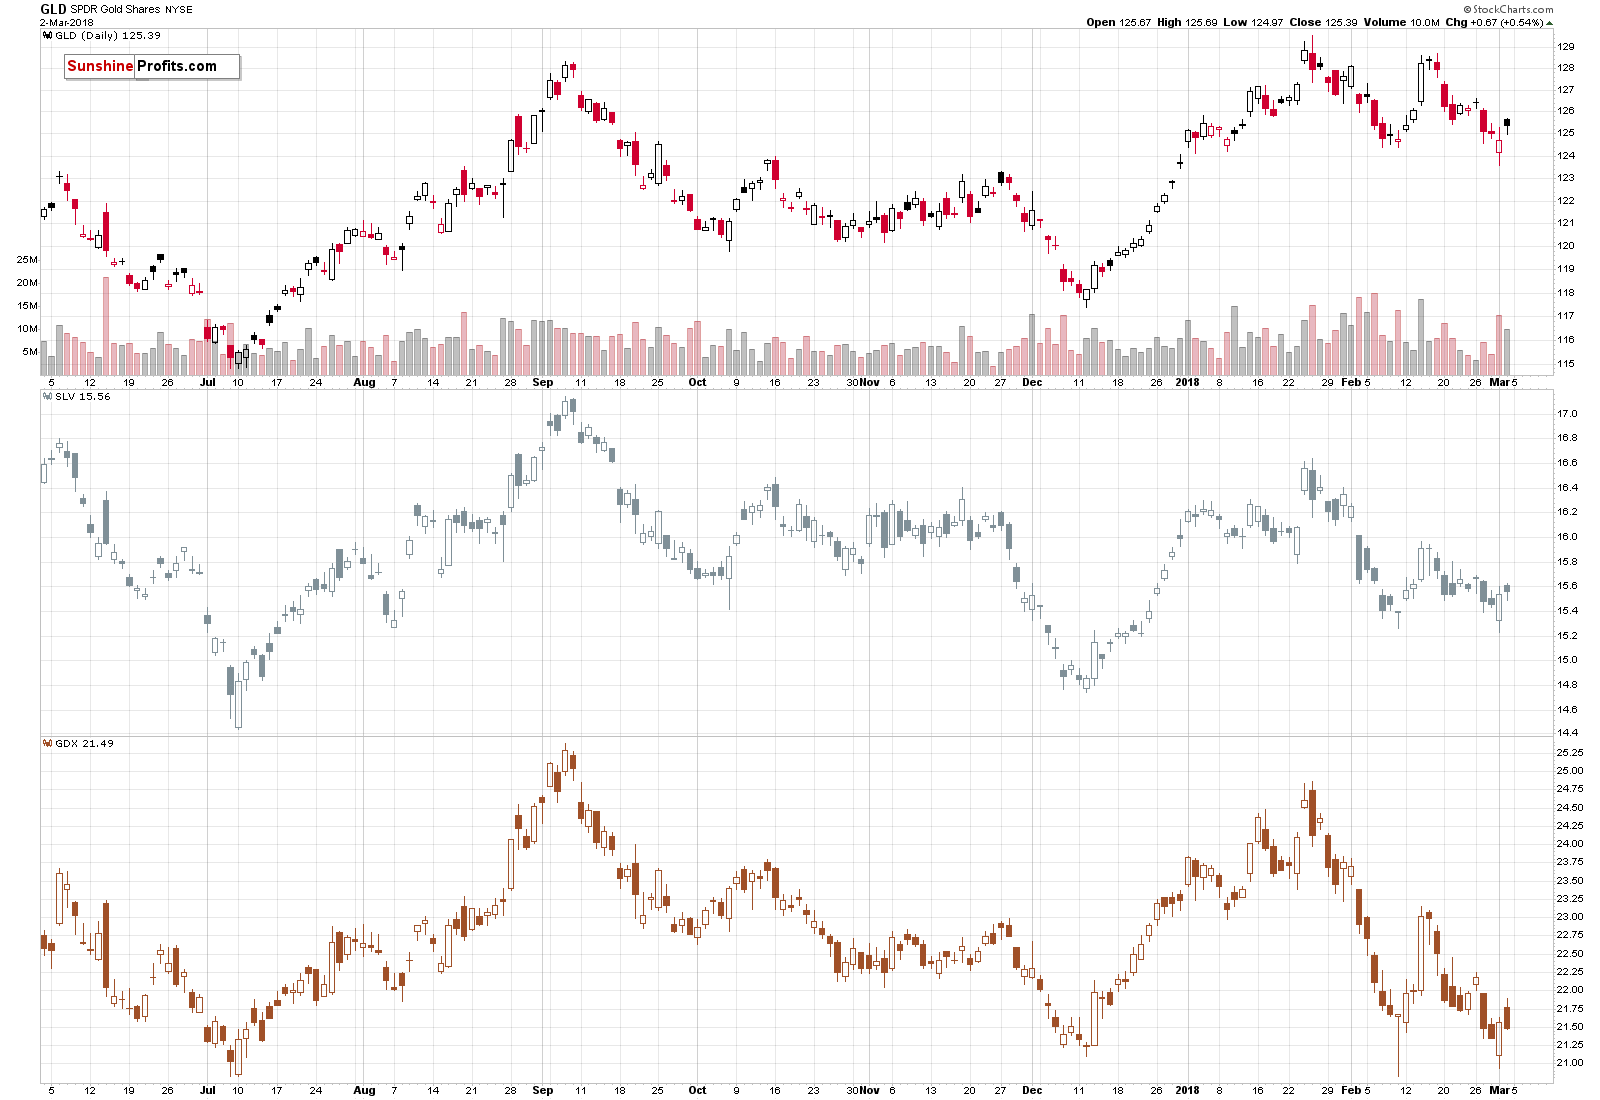
The above chart illustrates how gold, silver and mining stocks performed relative to each other. It seems that the last two trading days provide conflicting signals, so we’ll take the last three trading days into account. By doing so, we get the situation in which GLD and SLV are a bit higher and miners (GDX) are up by only a little. This is a subtle sign showing that the rally in the precious metals sector may not be something huge. If it was, miners would be leading the way in a decisive manner – that’s definitely not the case based on what happened on Friday.
Mining Stocks’ Invalidation – Bigger Than It Seems
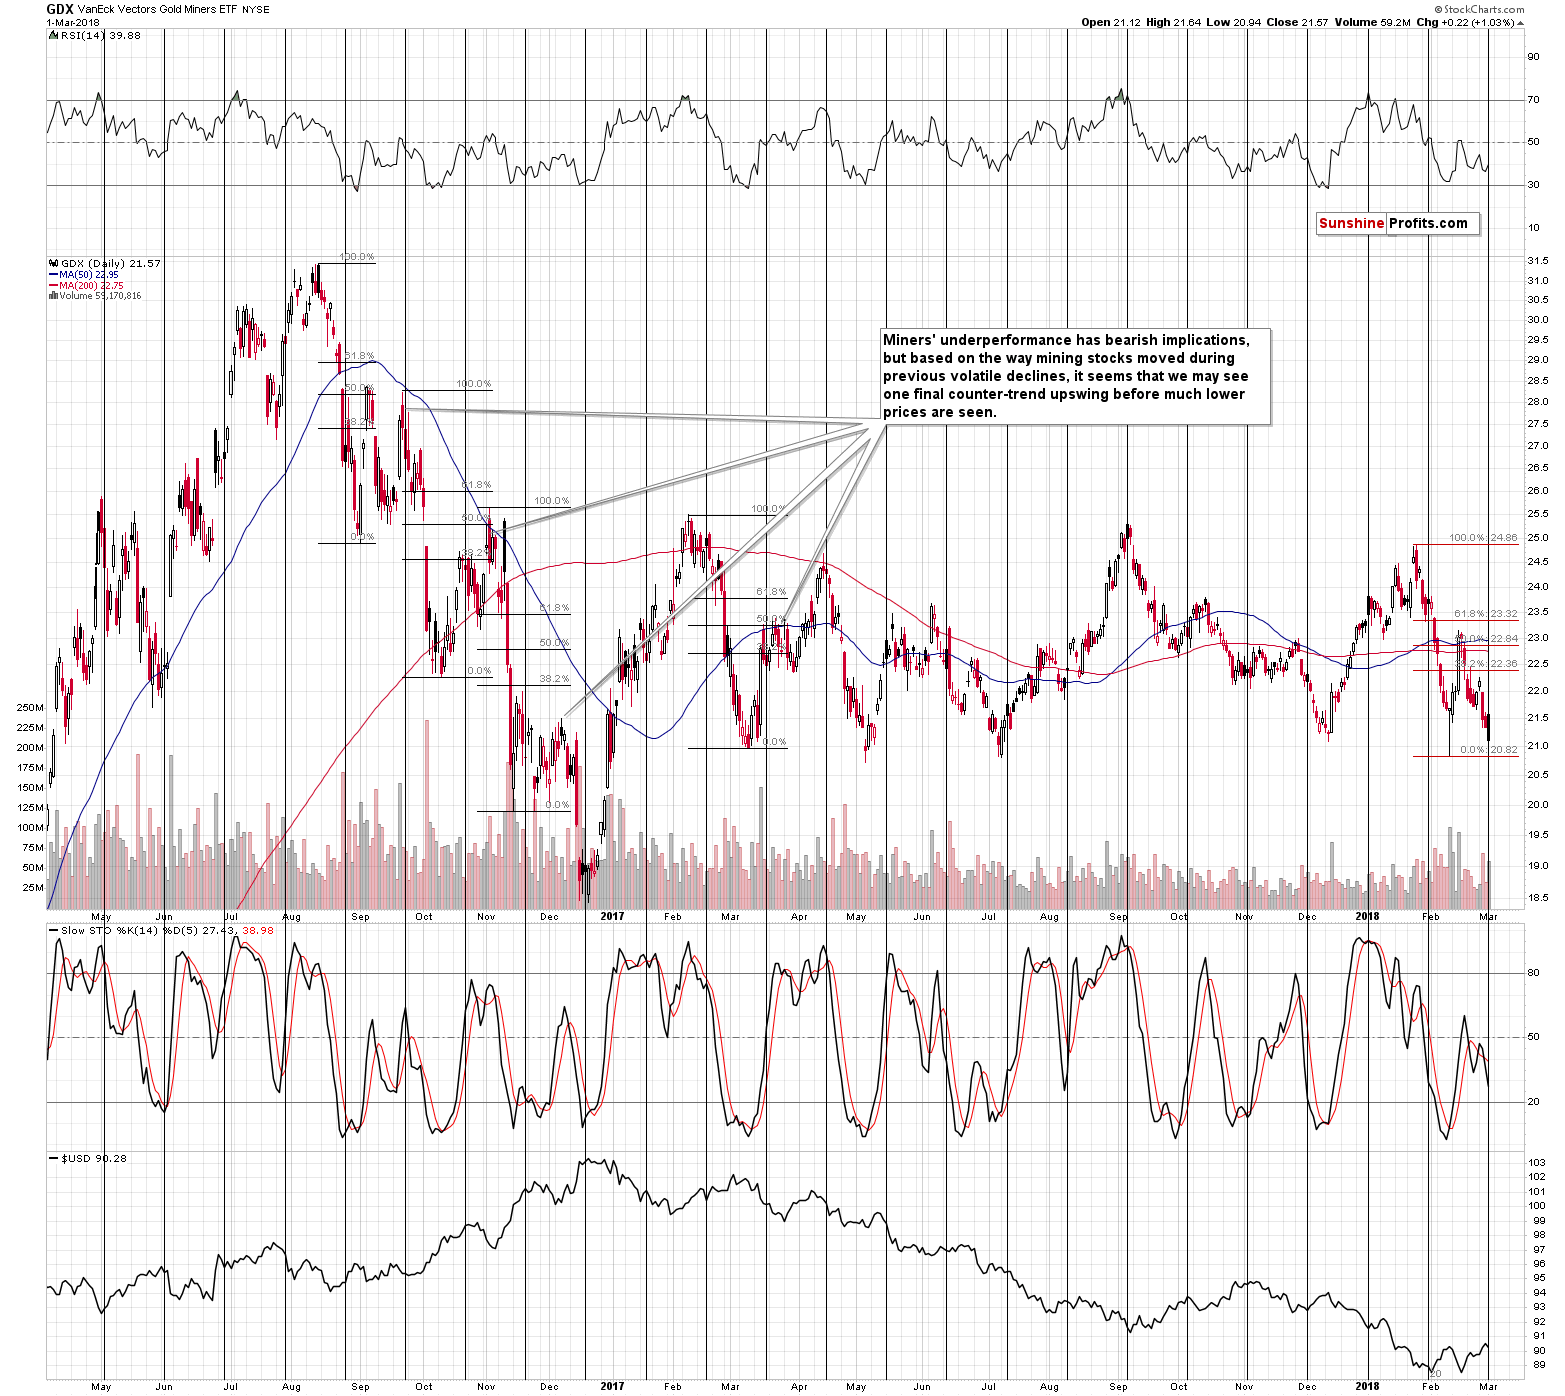
In Thursday’s analysis, we commented on the above GDX ETF chart in the following way:
(…) in the past cases, when miners bounced for the second time before rallying, they mostly bounced from the price levels that were considerably above the previous lows. There was only one exception (November 2016) and that was also the case in which the following upswing was the smallest out of analyzed cases. Back then only a bit more than half of the preceding short-term decline was erased before the big decline continued.
If this 1-out-of-4 analogy prevails, we may be looking at a counter-trend rally that takes GDX to 22.5 or so. If, however, the 2-out-of-4 analogy prevails (we’re leaving out the March 2017 action as there was no 2-day breakdown below the initial low), we can see a sharp decline right away.
(…)
The reversal that we saw later during Thursday’s session reversal made the analogy to the two-bounce cases more likely. Plus, a reversal on significant volume is generally a bullish phenomenon.
The above continues to have bullish implications also today.
However, there is something even more important that happened last week and in order to see it, we need to zoom out.
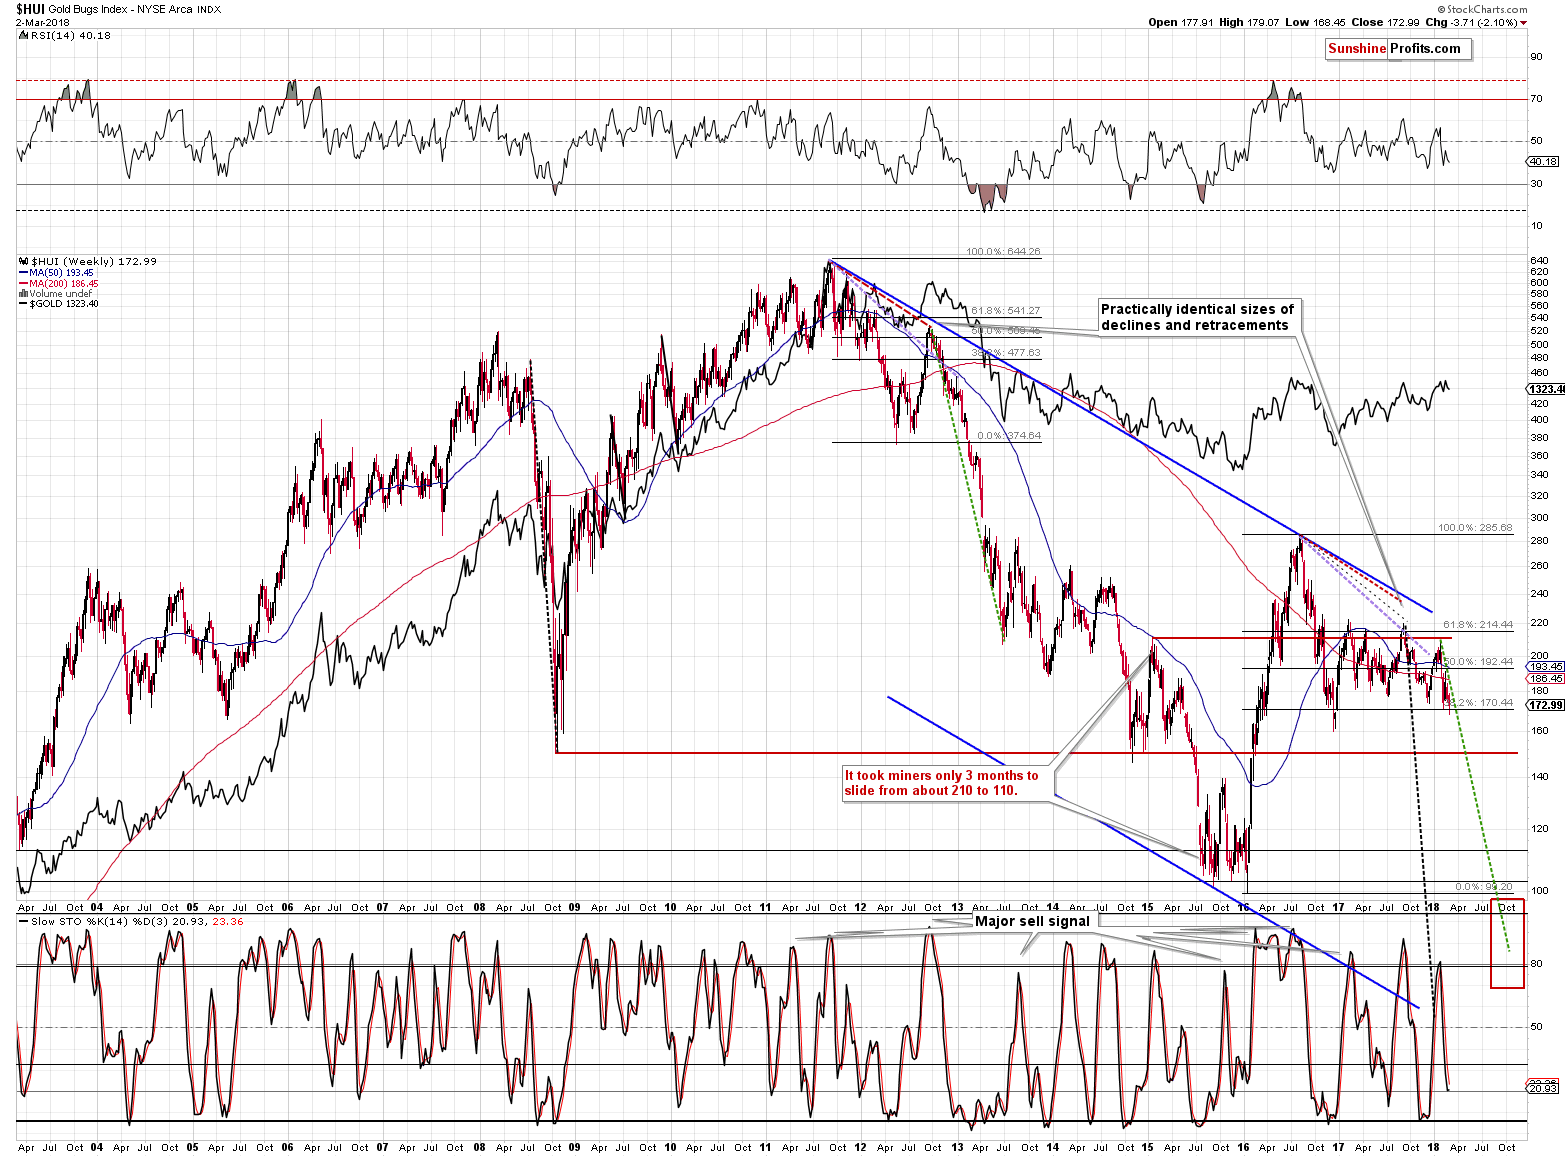
We already discussed the above on Friday, but it’s so important that we decided to discuss it once again today.
Gold stocks moved below the very important support level created by the 61.8% Fibonacci retracement that’s based on the most important tops of the past years – the 2016 bottom and 2016 top. Both price extremes are very important and the same can be said about the 61.8% retracement, so the invalidation of the breakdown is indeed something very important.
The last time gold stocks invalidated their breakdown below this level, they rallied over 220 relatively quickly. We don’t think that this will be repeated, but some of the bullish implications remain in place.
Based on the above chart, 190 can be reached once again, but we hope for mining stocks’ underperformance and a smaller rally, as that would serve as a confirmation sign and decrease the risk of opening new short positions.
Naturally, regardless of what we hope for, we’ll work with whatever the market provides us with and we’ll report to you accordingly.
If you’ve been wondering, the invalidation of the 61.8% Fibonacci retracement did not take place only in terms of the intraday prices. Exactly the same phenomenon was seen in the case of the retracement based on the daily closing prices and even weekly closing prices. Consequently, the invalidation is definitely something significant.
Summary
Summing up, a major top in gold, silver and mining stocks is probably in, but based on last week’s big-volume reversals and invalidations in the case of the USD and gold stocks, it seems that we are likely to see yet another small upswing before the big decline continues. The above perfectly fits into the scenario that we outlined in Monday’s extensive alert, in which gold tops at the apex of the triangle that’s based on intraday prices. This means a top in gold is likely to be seen in a week or so, most likely on Friday.
Also, Monday’s alert and the multiple bearish signs of long-term nature that it covers, explain why we didn’t open a long position in light of the short-term buying signals. We may open one if we see additional short-term bullish signs, but we are not seeing them right now.
As always, we will keep you – our subscribers – informed.
To summarize:
Trading capital (supplementary part of the portfolio; our opinion): No positions in gold, silver and mining stocks are justified from the risk/reward perspective (in other words: cash and/or positions based on our other alerts).
Long-term capital (core part of the portfolio; our opinion): No positions (in other words: cash)
Insurance capital (core part of the portfolio; our opinion): Full position
Important Details for New Subscribers
Whether you already subscribed or not, we encourage you to find out how to make the most of our alerts and read our replies to the most common alert-and-gold-trading-related-questions.
Please note that the in the trading section we describe the situation for the day that the alert is posted. In other words, it we are writing about a speculative position, it means that it is up-to-date on the day it was posted. We are also featuring the initial target prices, so that you can decide whether keeping a position on a given day is something that is in tune with your approach (some moves are too small for medium-term traders and some might appear too big for day-traders).
Plus, you might want to read why our stop-loss orders are usually relatively far from the current price.
Please note that a full position doesn’t mean using all of the capital for a given trade. You will find details on our thoughts on gold portfolio structuring in the Key Insights section on our website.
As a reminder – “initial target price” means exactly that – an “initial” one, it’s not a price level at which we suggest closing positions. If this becomes the case (like it did in the previous trade) we will refer to these levels as levels of exit orders (exactly as we’ve done previously). Stop-loss levels, however, are naturally not “initial”, but something that, in our opinion, might be entered as an order.
Since it is impossible to synchronize target prices and stop-loss levels for all the ETFs and ETNs with the main markets that we provide these levels for (gold, silver and mining stocks – the GDX ETF), the stop-loss levels and target prices for other ETNs and ETF (among other: UGLD, DGLD, USLV, DSLV, NUGT, DUST, JNUG, JDST) are provided as supplementary, and not as “final”. This means that if a stop-loss or a target level is reached for any of the “additional instruments” (DGLD for instance), but not for the “main instrument” (gold in this case), we will view positions in both gold and DGLD as still open and the stop-loss for DGLD would have to be moved lower. On the other hand, if gold moves to a stop-loss level but DGLD doesn’t, then we will view both positions (in gold and DGLD) as closed. In other words, since it’s not possible to be 100% certain that each related instrument moves to a given level when the underlying instrument does, we can’t provide levels that would be binding. The levels that we do provide are our best estimate of the levels that will correspond to the levels in the underlying assets, but it will be the underlying assets that one will need to focus on regarding the signs pointing to closing a given position or keeping it open. We might adjust the levels in the “additional instruments” without adjusting the levels in the “main instruments”, which will simply mean that we have improved our estimation of these levels, not that we changed our outlook on the markets. We are already working on a tool that would update these levels on a daily basis for the most popular ETFs, ETNs and individual mining stocks.
Our preferred ways to invest in and to trade gold along with the reasoning can be found in the how to buy gold section. Additionally, our preferred ETFs and ETNs can be found in our Gold & Silver ETF Ranking.
As a reminder, Gold & Silver Trading Alerts are posted before or on each trading day (we usually post them before the opening bell, but we don't promise doing that each day). If there's anything urgent, we will send you an additional small alert before posting the main one.
=====
Latest Free Trading Alerts:
Friday's trading session brought an intraday rebound of the main U.S. stock market indexes. They opened lower and continued short-term downtrend before bouncing off and closing between -0.3% and +1.1% vs. their Thursday's closing prices. Was this a final sell-off within a downtrend from Tuesday's local high? The broad stock market may have found at least some temporary bottom, but will it continue upwards or just go sideways?
Friday's Bounce Gave Bulls Some Hope, Stocks at a Crossroads, or a Cliff?
February was the best month for the U.S. dollar since October. Nevertheless, what goes up must fall someday. Yesterday, the gravity caught the greenback after President Donald Trump said the country will impose tariffs on steel and aluminum imports. As a result, the USD Index reversed and declined, supporting our 3 currency pairs. Will yesterday’s news kill the greenback’s rally in the coming days?
Euro, Cable and Aussie - The Reward for Patience
The market is hectic. The attention span of most investors is short. The long-term implications of one particular trend among governments the world all over has far reaching implications for the future of digital currencies. The question now is if this often overlooked factor tells us anything anything about the way the Bitcoin market behaves, the way digital currencies react to unexpected news and how to navigate the current complex short-term environment.
Alleged SEC Probe Leaves Bitcoin Market Confounded
=====
Hand-picked precious-metals-related links:
PRECIOUS-Gold gains amid concerns over trade war, Italy elections
Australia's gold production may rise to record in 2018 – report
Mining Exploration Is Making Comeback After Four-Year Slump
=====
In other news:
Euro stumbles as Italian election stokes political uncertainty
Italy's Populists Make Rival Claims to Lead the Next Government
It Could Be Crunch Time for World's Third Most-Indebted Country
=====
Thank you.
Sincerely,
Przemyslaw Radomski, CFA
Founder, Editor-in-chief, Gold & Silver Fund Manager
Gold & Silver Trading Alerts
Forex Trading Alerts
Oil Investment Updates
Oil Trading Alerts

