

Briefly: In our opinion, full (150% of the regular size of the position) speculative short positions in gold, silver and mining stocks are justified from the risk/reward perspective at the moment of publishing this alert.
After yesterday’s session it turned out that silver is following a self-similar pattern. The self-similar patterns rarely play out to the letter – they are usually somewhat-alike. Yet, in the case of the white metal, we have an analogy that’s much clearer than what we normally get. That’s not just interesting – that’s very useful, as it points to a very specific near-term target.
Let’s jump right to the silver chart (chart courtesy of http://stockcharts.com).
Silver’s Self-similarity
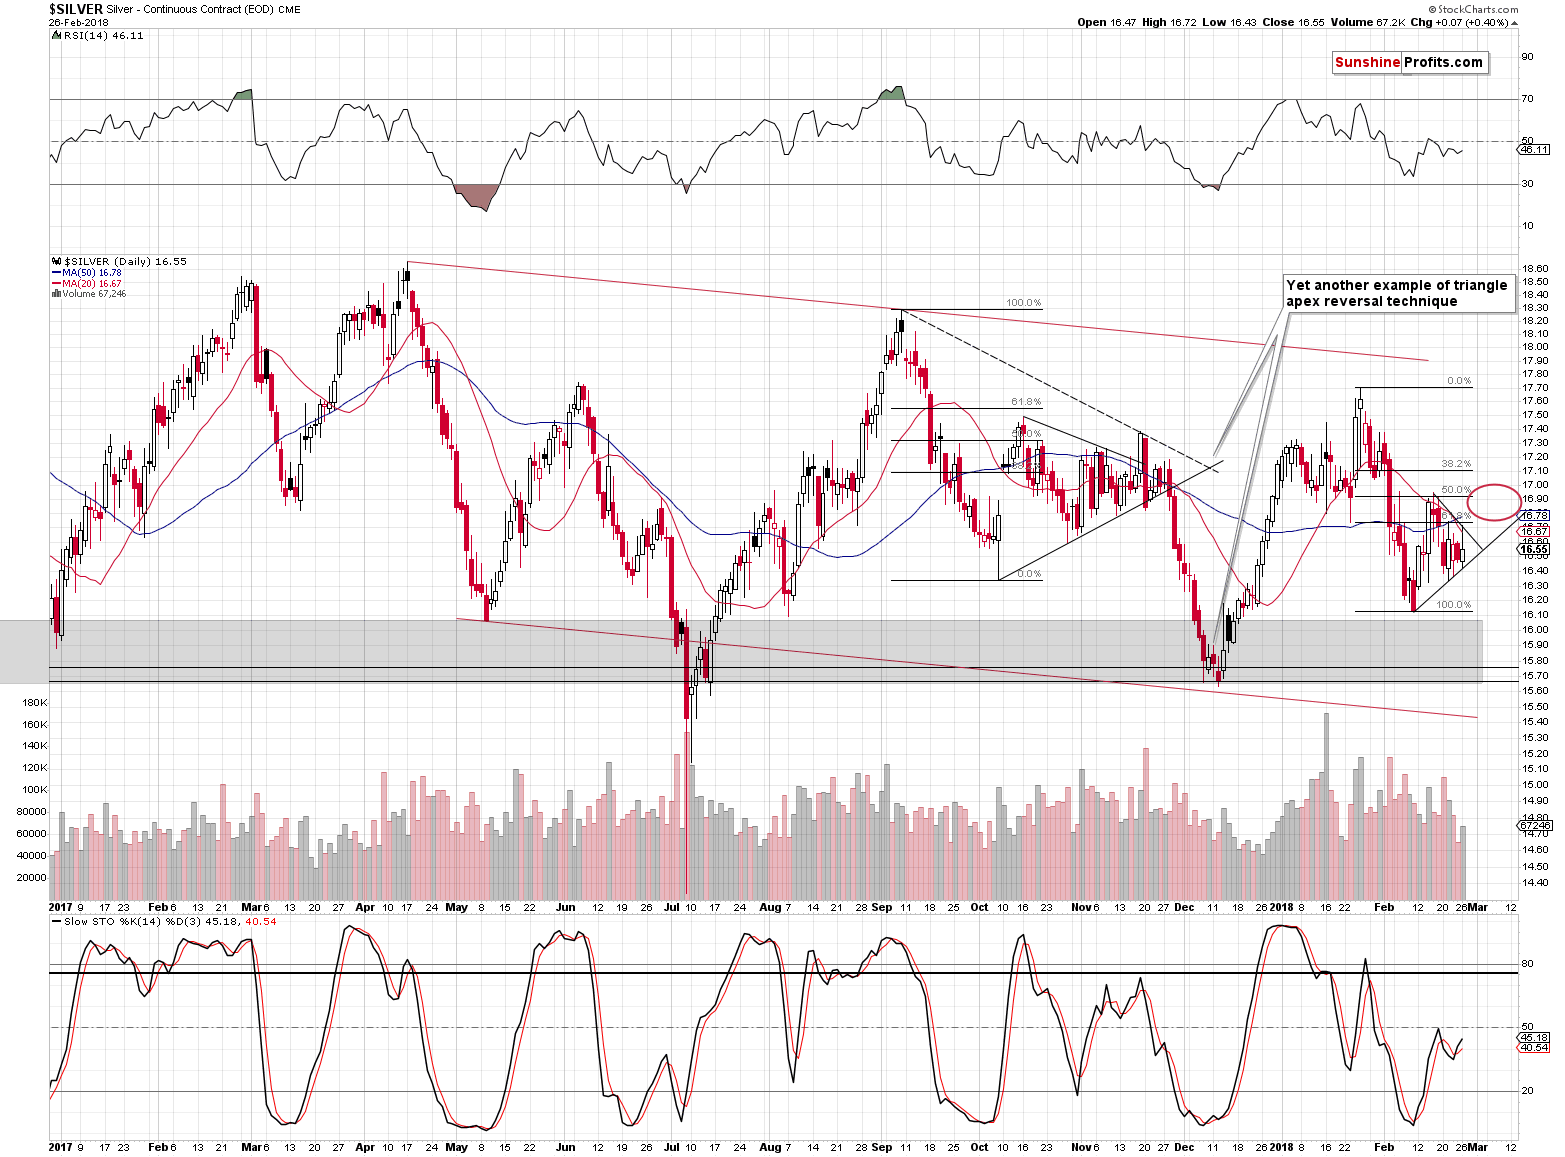
Based on yesterday’s pre-market upswing and the subsequent reversal it became apparent that silver is actually repeating its performance from the second half of the previous year.
The January 2018 – February 2018 decline is a quicker version of the September – October 2017 downswing. The subsequent corrections are very similar – in both cases, silver moved a bit above the 50% Fibonacci retracement, but not above the 61.8% one. The following decline erased most of the correction. Then, back and forth trading started where intraday highs were not as high as the highest intraday price of the preceding corrective upswing. The intraday lows of subsequent sessions were increasing.
The initial corrective upswing also took silver above both moving averages: the 20- and 50-day one. Then, the back and forth trading took place around the red moving average, but below the blue one. That’s what happened yesterday – silver moved a bit above the red MA, but not above the blue one.
Having established the self-similarity, let’s see how we can use it.
We can use to determine the next turning point and the trading opportunity. In this particular case, we see that the final top and the superb opportunity to go short presented itself in mid-November, when silver rallied above the declining resistance line based on the previous intraday highs and visibly above the blue (50-day) moving average.
It took a bit more time for silver to rally in November 2017 than it did for it to decline in October, so in this case, we can expect silver to take a bit more time to rally than it did to decline in the second half of February.
Combining the above price and time analogies, we get the target that we marked with a red ellipse on the above chart. The target is quite wide and there are good reasons for it. Back in November, silver topped below the previous top, but silver is known to get ahead of itself during these intraday outperformance cases, so we’re not ruling out a scenario in which it “breaks out” above the mid-February top only to invalidate the “breakout” shortly thereafter.
As far as time is concerned, please recall that in yesterday’s alert we thoroughly discussed the apex triangle reversal technique for gold and it pointed to two scenarios: one in which the top is already in and a second one in which the top is going to be in in about two weeks (a bit less, counting from today). Moreover, gold’s cyclical turning point is just a few days away, so it could be the case that it triggers silver’s rally and the subsequent reversal. Overall, it’s rather unclear when precisely the silver reversal will take place, but we know more or less when to expect it and we know what signs to look for as a confirmation (silver’s breakouts above the declining, short-term resistance line and the 50-day moving average).
Speaking of apex-triangle-based reversals, please note that the above chart shows yet another confirmation of this technique’s usefulness. The triangle based on the October and November 2017 lows (solid line) and the September and November 2017 tops (dashed line) had their apexes exactly at the time when one would want to reverse their short positions or close them. Perhaps applying this technique to the upcoming decline will serve as a way to detect a short-term reversal as well.
Gold’s Upcoming Turning Point
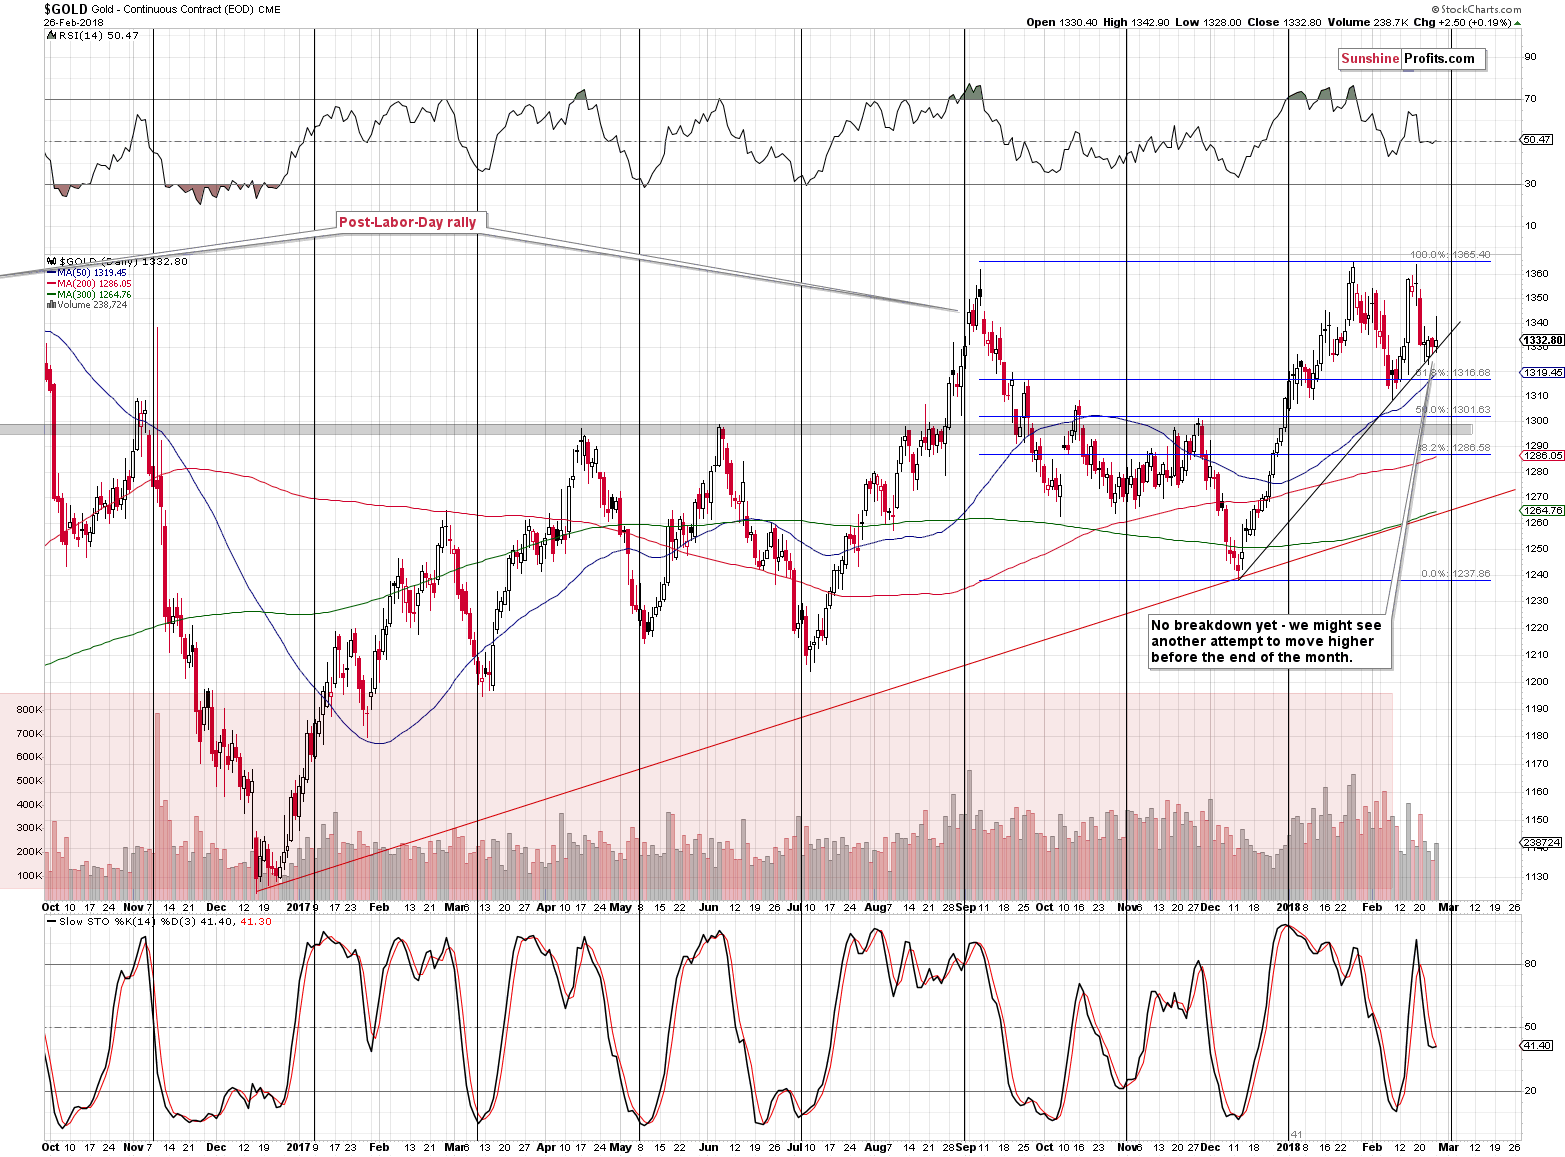
In yesterday’s alert, we wrote that we were likely to see a fake move and, in a way, we did as the pre-market rally was erased before the end of the session. Unfortunately, we didn’t see any bearish confirmations, so it didn’t serve as a trading opportunity.
The rising support line in gold remains intact, so gold could still move temporarily higher. Still, if silver is to outperform gold and the former is to move close to its recent short-term high, then gold should not move as high. The volume that accompanied yesterday’s move higher was rather low, which suggests that the strength of the bulls is limited. It fits the scenario in which gold moves higher by a few days (to gold’s cyclical turning point that’s marked with a vertical line) or a week and a few days and then starts a big slide.
Again, there are multiple long-term factors in play that favor lower gold prices and they could trigger a decline regardless of the short-term signals – the surprises can and are likely to be to the downside.
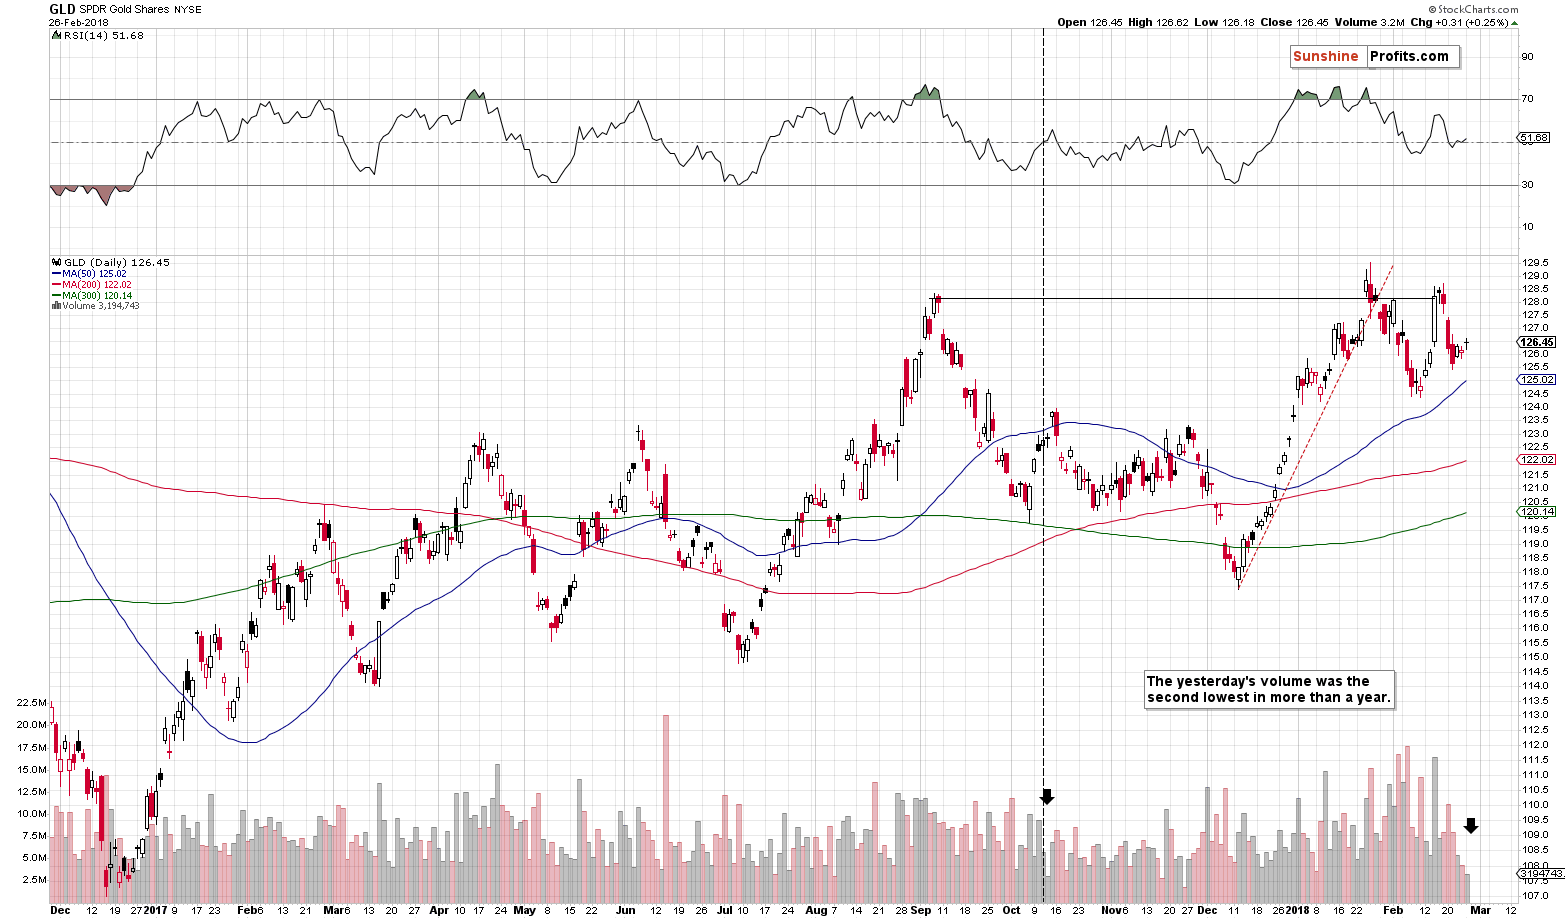
The GLD ETF supports the scenario in which gold forms a major top sometime this week (likely on Thursday as that’s exactly when we have the turning point). Why? Because of the extremely low volume. It was the second lowest volume in more than a year. The only case when the volume was similar, was in mid-October 2017.
That was the session before the final price increase and the top in terms of the daily closing prices. In intraday terms, however, the top formed two days later. That’s yet another point in favor of Thursday being the reversal day.
Mining Stocks’ Possible Upswing
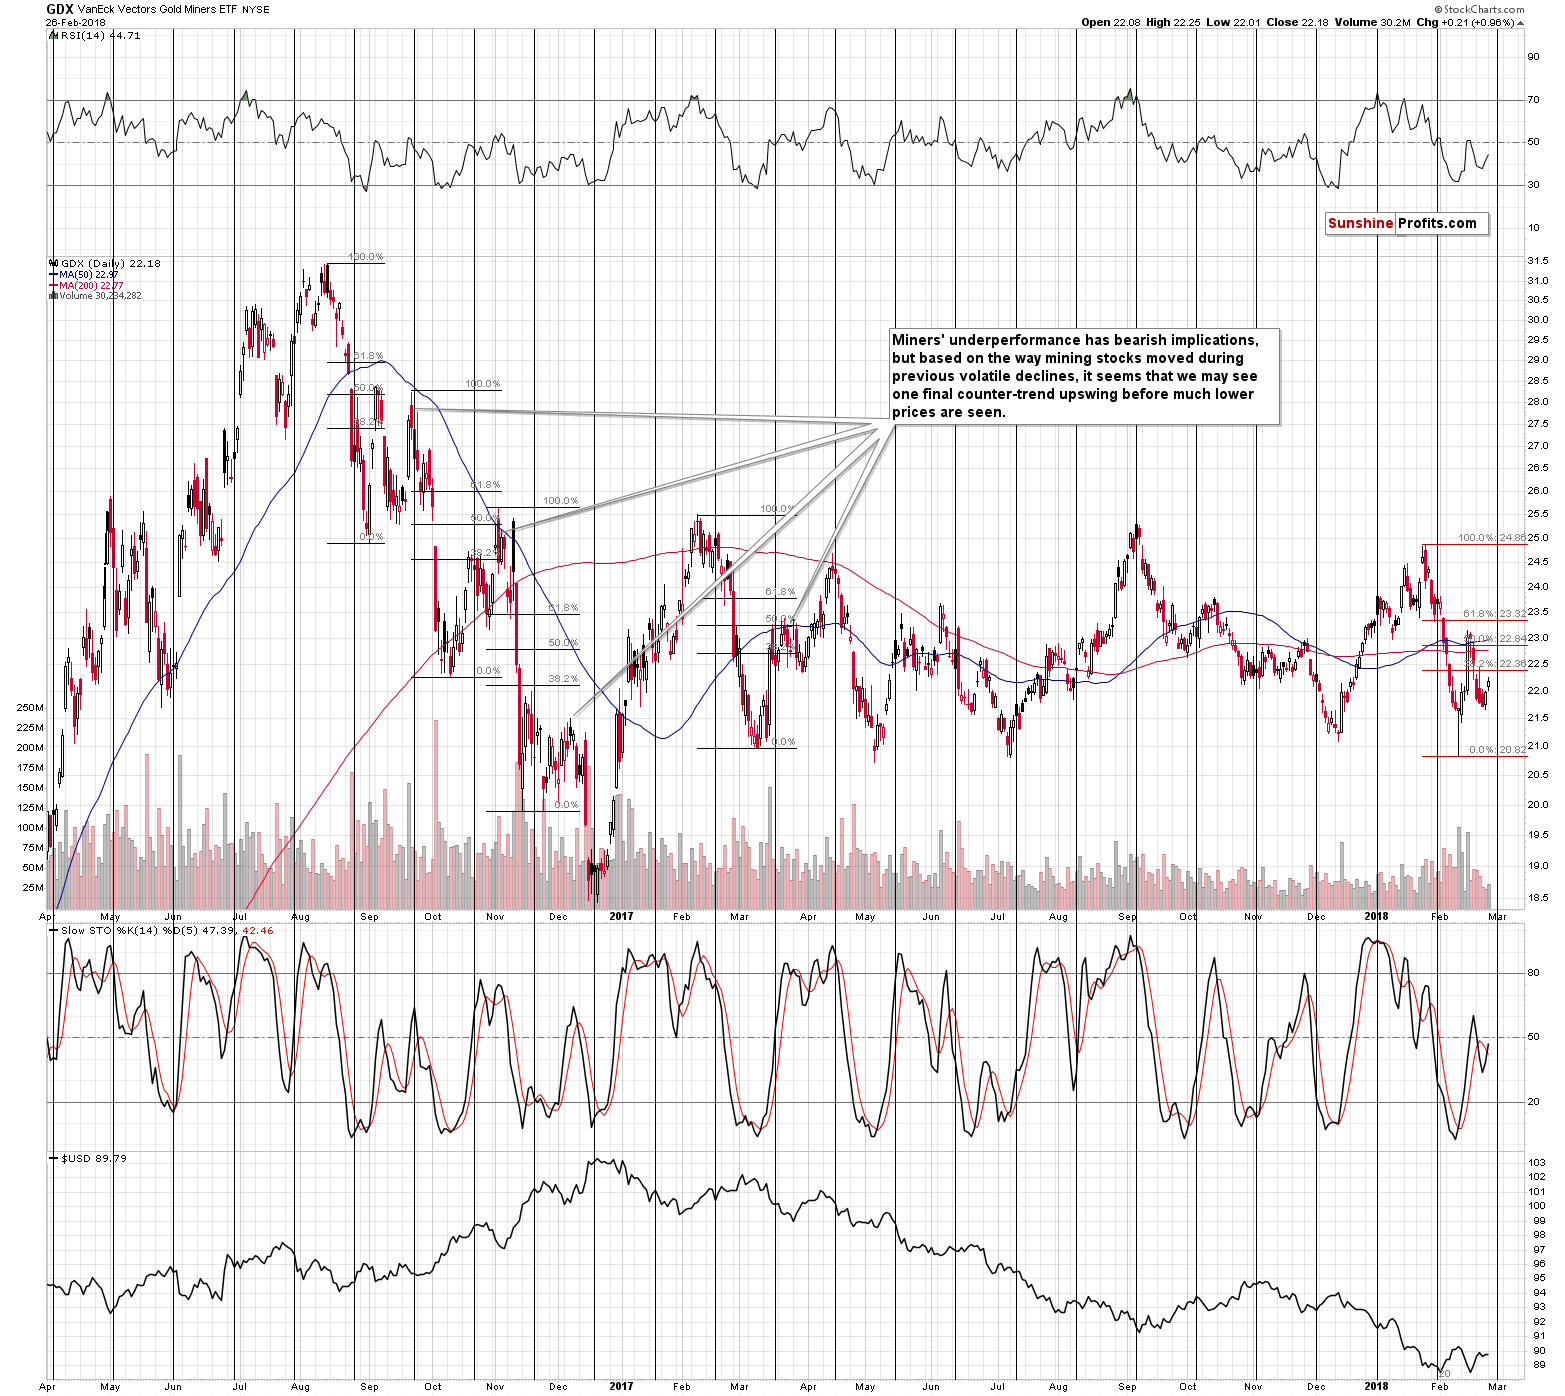
Mining stocks moved a bit higher yesterday and the volume that accompanied this move was nothing special – it was rather low. This is a good start for a small rally that doesn’t change the bigger trend. As we marked on the above chart, something like that happened several times in the past during volatile downswings. Consequently, the miners’ move higher should not be viewed as something bullish, but rather neutral. If miners underperform gold and heavily underperform silver, we’ll have very strong bearish implications. If, however, miners outperform and silver lags, we will consider limiting our short positions.
The USD Index
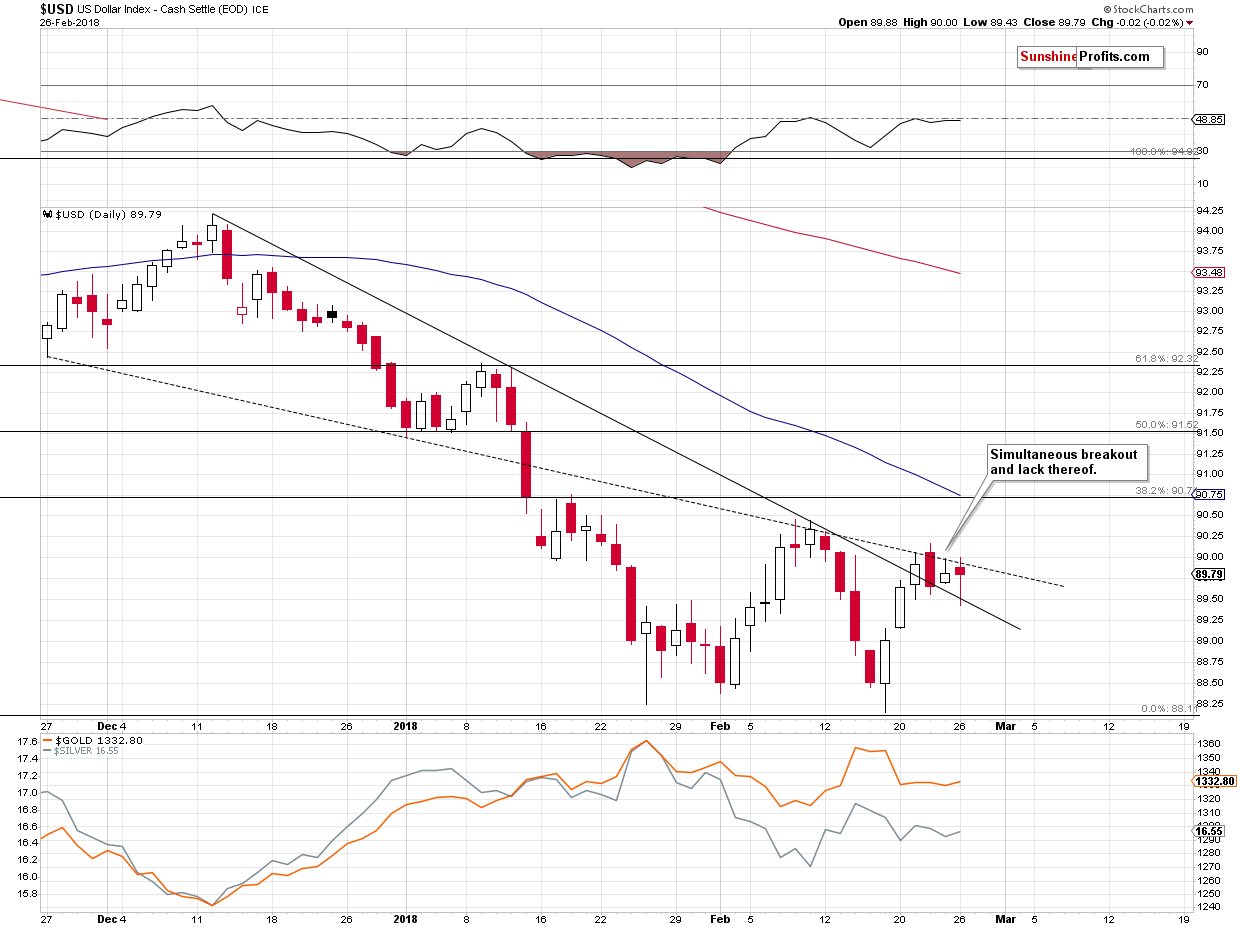
The USD Index is moving back and forth between two declining lines. One serves as support and the other as resistance. If the precious metals sector is to move higher in the next few days, then another very short-term decline in the USD could serve as a trigger.
Actually, it would be ideal if the USD declined more visibly and the PMs refused to rally significantly (except for silver) as that would show the PM sector’s weakness and it would serve as a perfect bearish confirmation.
Summary
Summing up, the top in gold, silver and mining stocks is probably in, but there’s still a possibility that the PMs decline will be delayed by a few days or a week and a few days. Mining stocks and – in particular – silver will be the assets to look at for necessary confirmations before making adjustments to the current trading position. In both cases, however, the outlook for the following months will remain bearish.
As always, we will keep you – our subscribers – informed.
To summarize:
Trading capital (supplementary part of the portfolio; our opinion): Full short positions (150% of the full position) in gold, silver and mining stocks are justified from the risk/reward perspective with the following stop-loss orders and initial target price levels:
- Gold: initial target price: $1,218; stop-loss: $1,382; initial target price for the DGLD ETN: $53.98; stop-loss for the DGLD ETN $37.68
- Silver: initial target price: $14.63; stop-loss: $17.82; initial target price for the DSLV ETN: $33.88; stop-loss for the DSLV ETN $20.88
- Mining stocks (price levels for the GDX ETF): initial target price: $19.22; stop-loss: $26.14; initial target price for the DUST ETF: $39.88; stop-loss for the DUST ETF $15.78
In case one wants to bet on junior mining stocks' prices (we do not suggest doing so – we think senior mining stocks are more predictable in the case of short-term trades – if one wants to do it anyway, we provide the details), here are the stop-loss details and initial target prices:
- GDXJ ETF: initial target price: $27.82; stop-loss: $38.22
- JDST ETF: initial target price: $94.88 stop-loss: $37.78
Long-term capital (core part of the portfolio; our opinion): No positions (in other words: cash)
Insurance capital (core part of the portfolio; our opinion): Full position
Important Details for New Subscribers
Whether you already subscribed or not, we encourage you to find out how to make the most of our alerts and read our replies to the most common alert-and-gold-trading-related-questions.
Please note that the in the trading section we describe the situation for the day that the alert is posted. In other words, it we are writing about a speculative position, it means that it is up-to-date on the day it was posted. We are also featuring the initial target prices, so that you can decide whether keeping a position on a given day is something that is in tune with your approach (some moves are too small for medium-term traders and some might appear too big for day-traders).
Plus, you might want to read why our stop-loss orders are usually relatively far from the current price.
Please note that a full position doesn’t mean using all of the capital for a given trade. You will find details on our thoughts on gold portfolio structuring in the Key Insights section on our website.
As a reminder – “initial target price” means exactly that – an “initial” one, it’s not a price level at which we suggest closing positions. If this becomes the case (like it did in the previous trade) we will refer to these levels as levels of exit orders (exactly as we’ve done previously). Stop-loss levels, however, are naturally not “initial”, but something that, in our opinion, might be entered as an order.
Since it is impossible to synchronize target prices and stop-loss levels for all the ETFs and ETNs with the main markets that we provide these levels for (gold, silver and mining stocks – the GDX ETF), the stop-loss levels and target prices for other ETNs and ETF (among other: UGLD, DGLD, USLV, DSLV, NUGT, DUST, JNUG, JDST) are provided as supplementary, and not as “final”. This means that if a stop-loss or a target level is reached for any of the “additional instruments” (DGLD for instance), but not for the “main instrument” (gold in this case), we will view positions in both gold and DGLD as still open and the stop-loss for DGLD would have to be moved lower. On the other hand, if gold moves to a stop-loss level but DGLD doesn’t, then we will view both positions (in gold and DGLD) as closed. In other words, since it’s not possible to be 100% certain that each related instrument moves to a given level when the underlying instrument does, we can’t provide levels that would be binding. The levels that we do provide are our best estimate of the levels that will correspond to the levels in the underlying assets, but it will be the underlying assets that one will need to focus on regarding the signs pointing to closing a given position or keeping it open. We might adjust the levels in the “additional instruments” without adjusting the levels in the “main instruments”, which will simply mean that we have improved our estimation of these levels, not that we changed our outlook on the markets. We are already working on a tool that would update these levels on a daily basis for the most popular ETFs, ETNs and individual mining stocks.
Our preferred ways to invest in and to trade gold along with the reasoning can be found in the how to buy gold section. Additionally, our preferred ETFs and ETNs can be found in our Gold & Silver ETF Ranking.
As a reminder, Gold & Silver Trading Alerts are posted before or on each trading day (we usually post them before the opening bell, but we don't promise doing that each day). If there's anything urgent, we will send you an additional small alert before posting the main one.
=====
Latest Free Trading Alerts:
Investors are still worried about the stock market. It’s quite understandable, given the recent correction, but it draws their attention away from the really important developments. Let’s analyze the hidden threats and consider how they could affect the gold prices.
Stocks? Who Cares? You Should Worry about Something Else!
Stocks rallied on Friday, but they remained within their week-long consolidation. Which direction is next? Will bulls drive prices higher this week? Or will Friday's move up fade today? The S&P 500 index continues to trade along the level of 2,700-2,750, and it is still around 4.4% below its late January all-time high. Stocks are expected to open higher today, but will they continue upwards after 9:30 a.m.?
Stocks Break Higher but Their Rally May Fade
=====
Hand-picked precious-metals-related links:
PRECIOUS-Gold holds ground ahead of testimony by Fed's Powell
Paulson Is Right: Gold Producers Must Fix Their Bad M&A Habits
Unloved platinum stocks show promise for $45 billion manager
=====
In other news:
Dollar edges down on caution ahead of Powell testimony
Bonds Dip Before Powell; Stocks Slip, Euro Firms: Markets Wrap
Powell Faces Policy ‘Combativeness’ in Riskier Post-Yellen World
What to watch for in Jerome Powell's Capitol Hill debut
BlackRock Has It Wrong on U.S. Stocks, Russell Investments Says
New South African finance minister: Budget may not stave off downgrades
=====
Thank you.
Sincerely,
Przemyslaw Radomski, CFA
Founder, Editor-in-chief, Gold & Silver Fund Manager
Gold & Silver Trading Alerts
Forex Trading Alerts
Oil Investment Updates
Oil Trading Alerts

