

February was the best month for the U.S. dollar since October. Nevertheless, what goes up must fall someday. Yesterday, the gravity caught the greenback after President Donald Trump said the country will impose tariffs on steel and aluminum imports. As a result, the USD Index reversed and declined, supporting our three currency pairs. Will yesterday’s news kill the greenback’s rally in the coming days?
Analyzing the charts after yesterday’s session we noticed several disturbing factors, which can thwart currency bears’ pro-declining plans and melt profits from short positions (in EUR/USD, GBP/USD and AUD/USD) in the coming days. Therefore, we decided to close our short positions and take profits off the table.
As we mentioned earlier, the greenback’s very short-term situation deteriorated yesterday, which caused, that we decided to start today's alert by looking at the current picture of the USD Index.
Focus on the USD Index
Nevertheless, before we do that, let’s check what changed in the technical picture of the U.S. currency since our last commentary.
A week ago, we wrote the following:
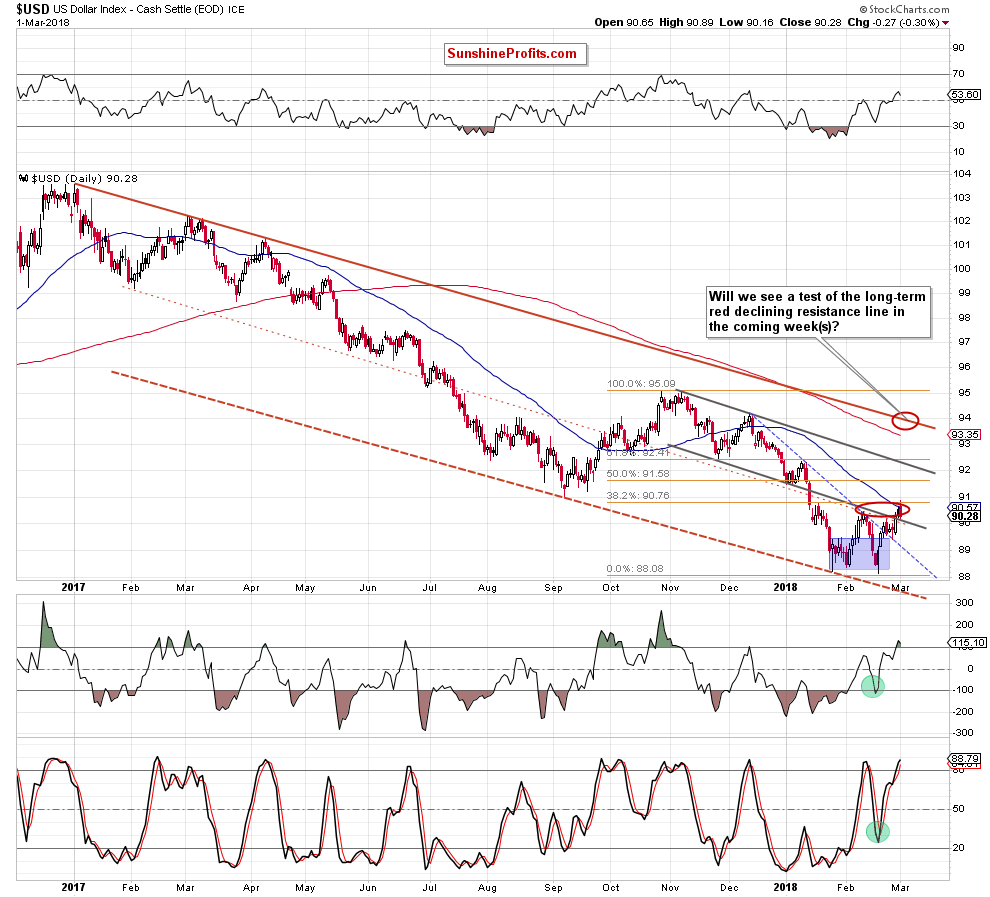
(…) the greenback broke above the blue resistance line, but (…) the index still remains under the grey trend channel.
The buy signals generated by the daily indicators suggest that currency bulls will at least try to break above this resistance in the coming day(s). Nevertheless, in our opinion, a bigger move to the upside will be more reliable if the index closes one of the following sessions above the lower line of the grey declining tend channel and invalidates the earlier breakdown. In this case, we we’ll likely also see a test of the 38.2% Fibonacci retracement, which intersects the upper line of the green consolidation marked on the weekly chart.
From today’s point of view, we see that the situation developed in line with the above scenario and the buyers took the greenback to our upside targets yesterday. Despite this positive event, the U.S. President Donald Trump announcement drastically dampened risk sentiment and scared off investors, which resulted in a sharp pullback.
Thanks to this price action, the USD Index invalidated the earlier tiny breakout above the upper border of the green consolidation and the 38.2% Fibonacci retracement, which is a bearish development.
Additionally, the daily CCI and the Stochastic Oscillator increased to their overbought areas, which increases the probability that we’ll see sell signals in the coming day(s). If this is the case, the greenback will extend declines against the basket of major currency pairs in the following days.
This scenario is also reinforced by the very short-term picture of our currency pairs. Let’s take a closer look at them.
EUR/USD
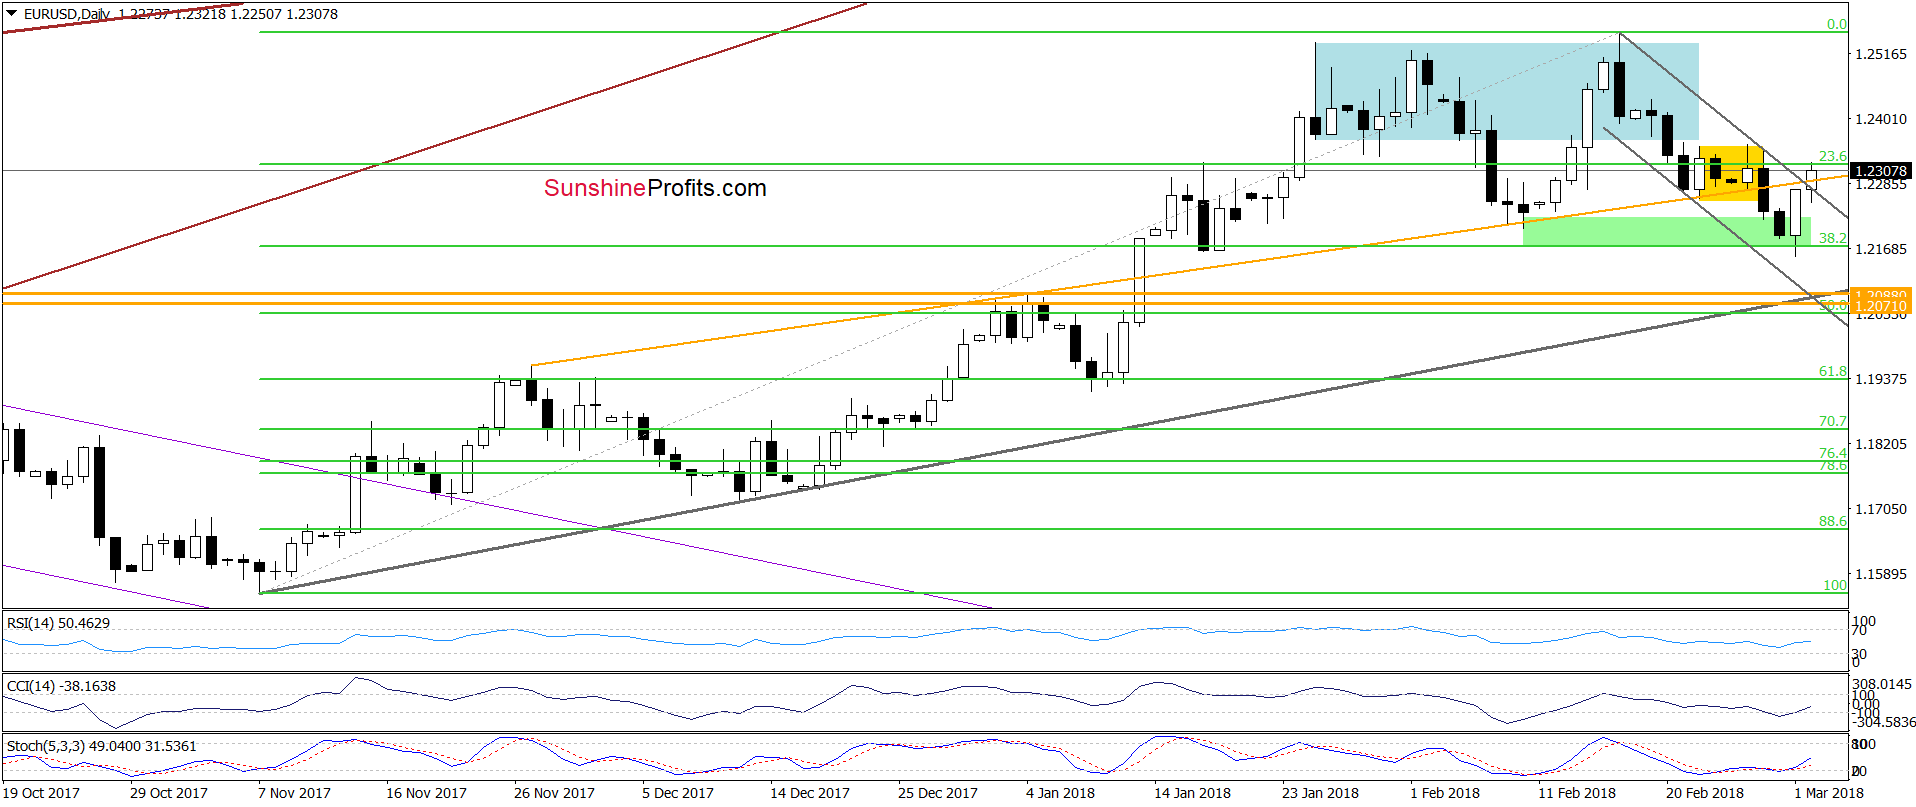
The first thing that catches the eye on the above chart is an invalidation of the tiny breakdown under the 38.2% Fibonacci retracement and the green zone. Yesterday’s white candlestick showed currency bulls’ strength, which resulted in two more improvements earlier today: a comeback above the orange resistance line (one more invalidation of the earlier breakdown) and a breakout above the upper border of the grey declining trend channel.
Additionally, the CCI and the Stochastic Oscillator generated buy signals, increasing the likelihood of further improvement in the coming days.
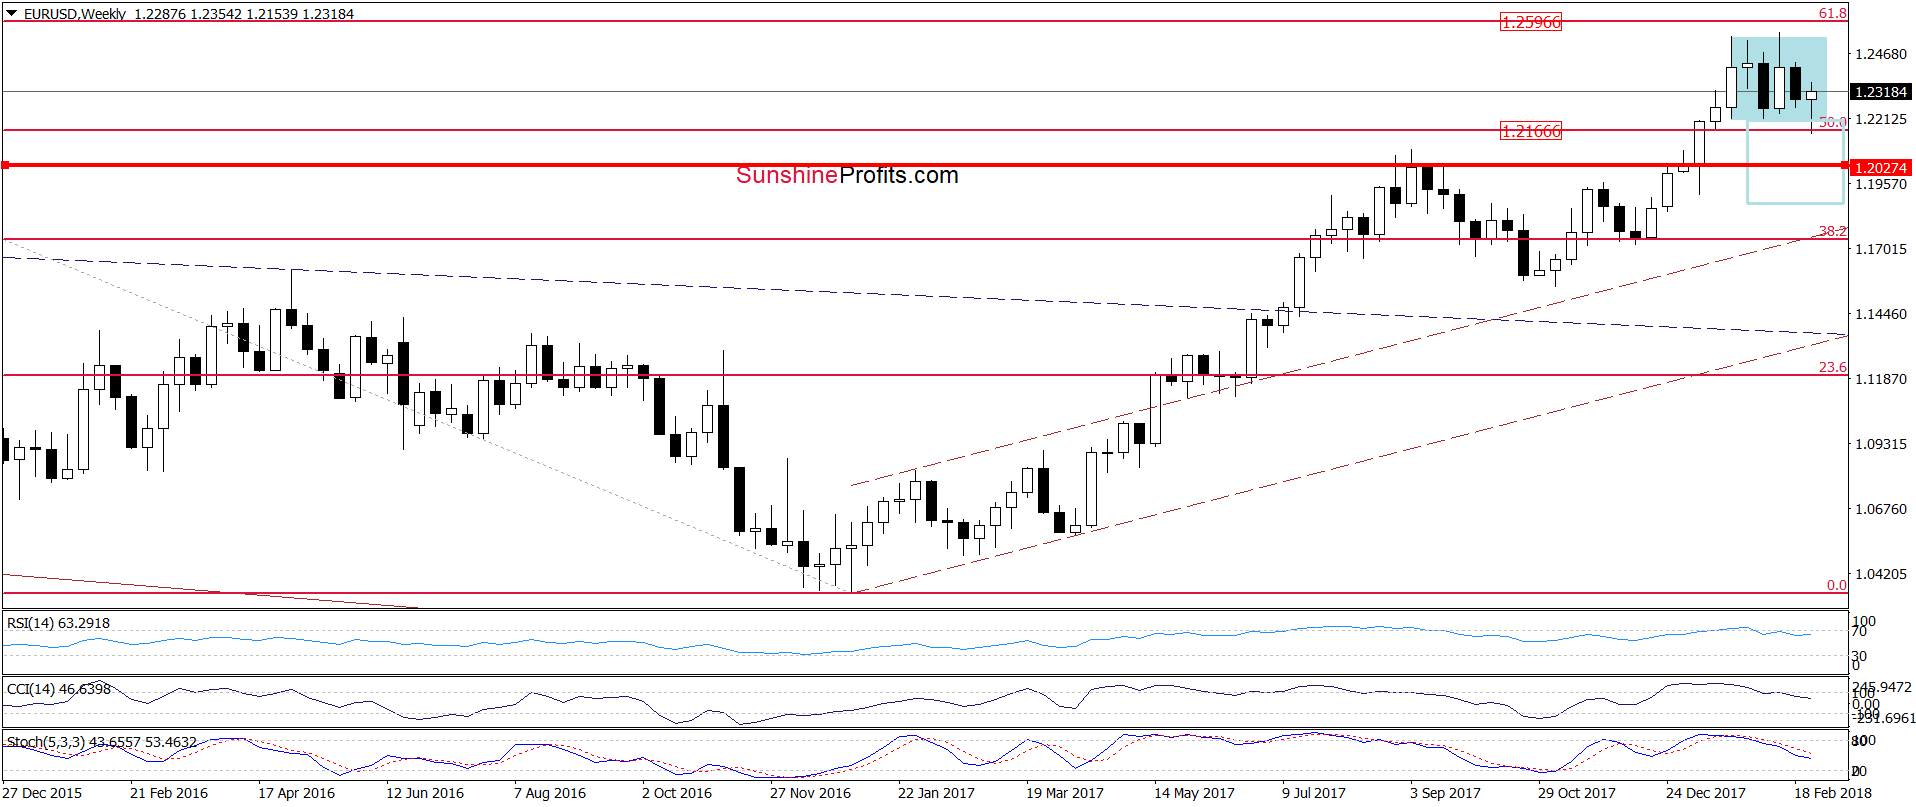
On top of that, thanks to this rebound EUR/USD invalidated the earlier breakdown under the lower border of the blue consolidation (marked on the weekly chart below), giving currency bulls another reason to act.
What happened at the same time with the GBP/USD? Let’s check.
GBP/USD
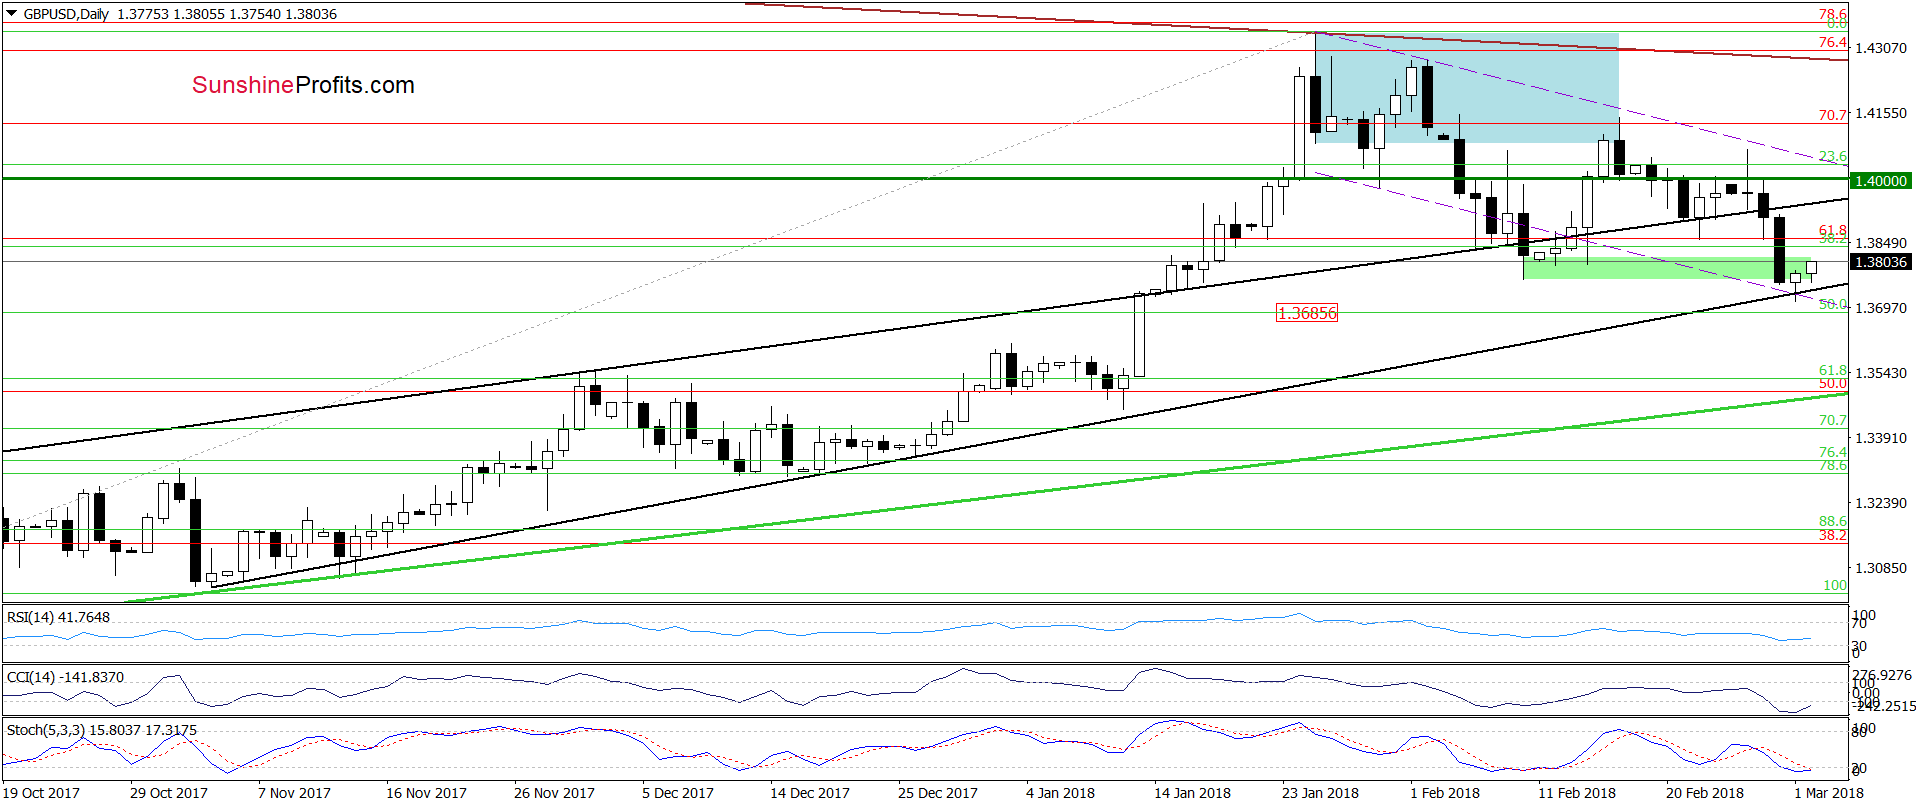
On Wednesday, we wrote the following:
(…) currency bears pushed GBP/USD lower as we had expected. Thanks to yesterday’s decrease the exchange rate closed the day under the previously-broken upper black support line, which means (…) that our next downside targets will be in play in the very near future:
(…) In our opinion, we’ll likely see a test of the 50% Fibonacci retracement (marked on the daily chart), which is currently intersected by the lower line of the black rising wedge (around 1.3685).
As you see on the daily chart, the situation in this currency pair also developed in tune with our assumptions as GBP/USD reached the downside target during yesterday’s session. With this drop the pair also slipped to the lower border of the purple declining very short-term chart, which increases the probability of rebound in the coming days – especially when we factor in the current position of the daily indicators (they are very close to generating buy signals).
What’s interesting, we noticed a quite similar situation in our next currency pair.
AUD/USD
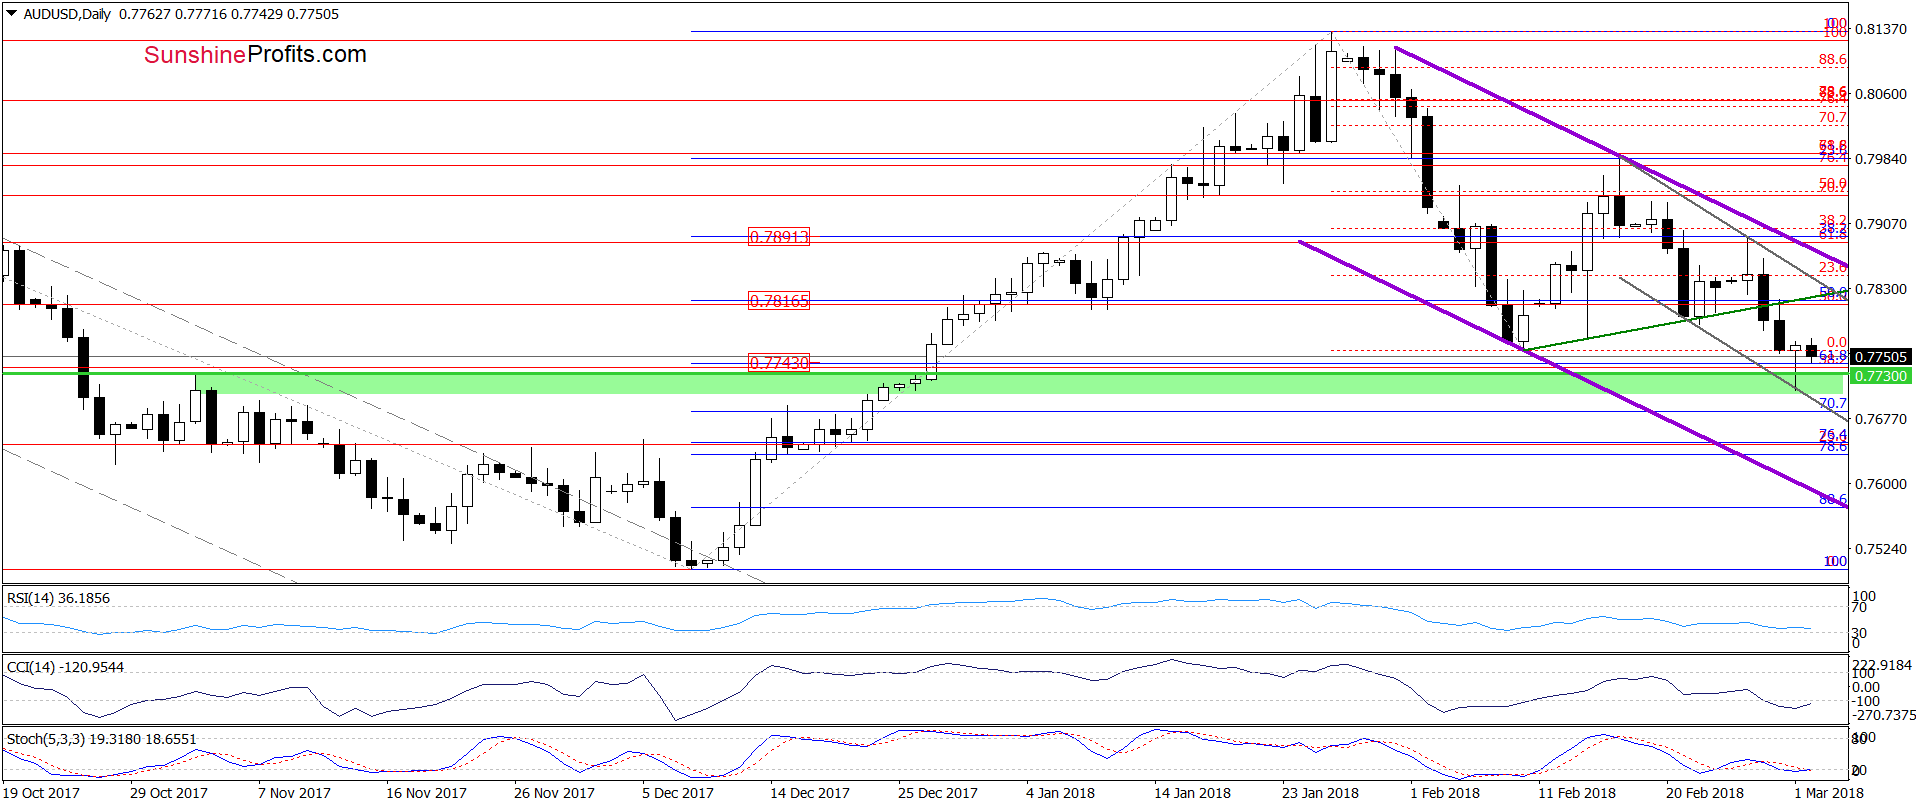
From the very short-term point of view, we see that AUD/USD extended losses after the breakdown under the green support line based on the previous lows. This bearish development together with the sell signals generated by the daily indicators triggered further deterioration in the following days, which resulted in a test of the green support zone.
As you see this area together with the lower border of the very short-term grey declining trend channel and the position of the daily indicators also encouraged the buyers to act, which triggered a rebound.
Although the pair erased some of yesterday’s gains earlier today, it seems to us that the current situation in the USD Index and both the above-mentioned currency pairs will translate into further improvement in the coming days.
How High Could Currency Bulls Push Our Currency Pairs?
If AUD/USD turns north, the pair will test the strength of the previously-broken green line based on the February lows and the upper border of the grey declining trend channel, which together serve as the nearest resistance.
If we see a similar price action (further improvement) in GBP/USD, the exchange rate will likely come back to the upper black line (the upper line of the rising wedge, which is currently at 1.3932).
In the case of EUR/USD the buyers showed the biggest commitment, which resulted in sharp and the strongest rebound. Therefore, if they do not give up and use all the arguments they have on their side, we may see not only a test of the upper border of the yellow, but also a rally to the February 19 high of 1.2434 in the coming week.
Before we summarize today’s alert, we would like to point out that the long-term pictures of the USD Index and our currency pairs remain unchanged and suggest a continuation of the recent tendency in the coming weeks.
The Long-term Perspective of Above Currencies
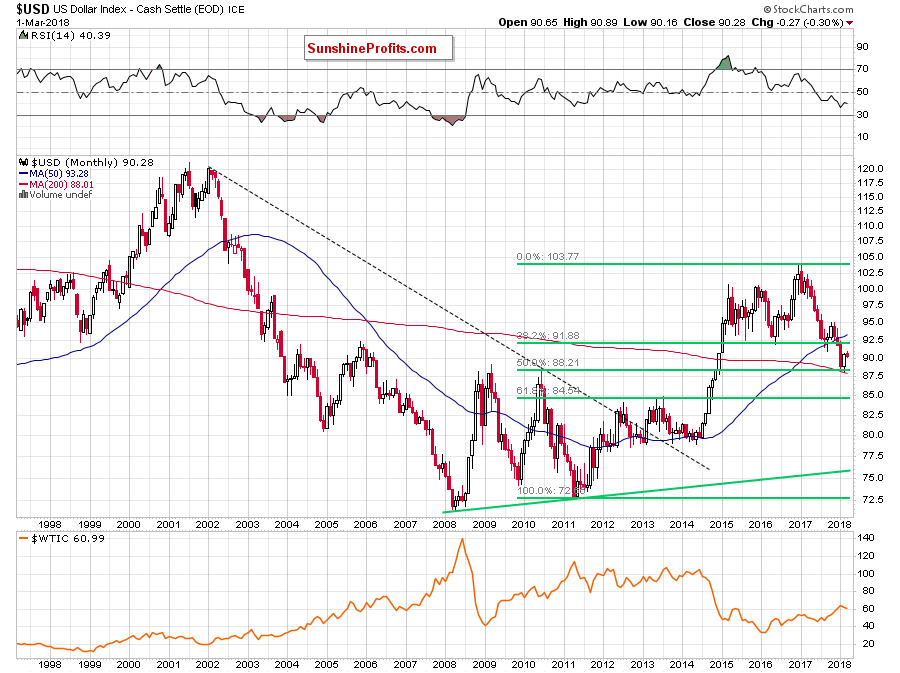
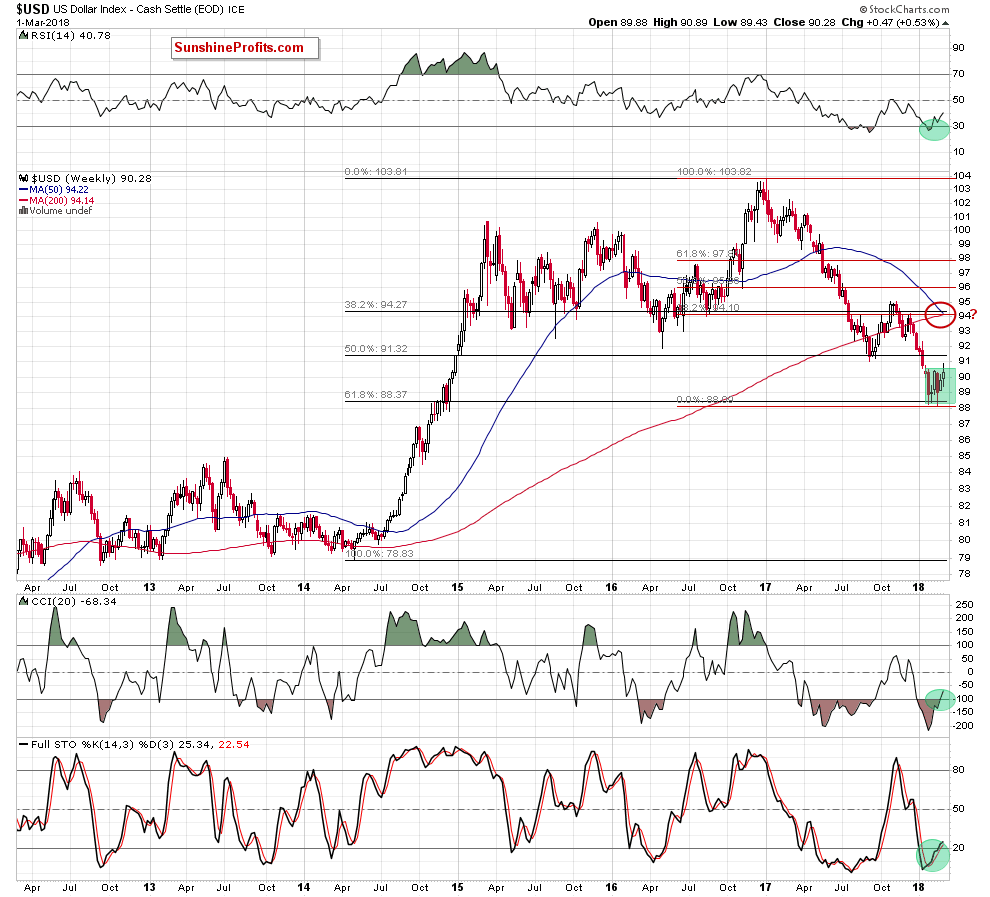
Looking at the above chart, we see that yesterday’s drop is tiny compared to the size of the last week’s rebound, which means that the most important fortress of the bulls (created by the 50% Fibonacci retracement based on the entire 2011-2017 upward move, the 200-month moving average and the 61.8% Fibonacci retracement based on the entire 2014-2017 upward move and marked on the weekly chart at the begining of today’s alert) is safe at the moment of writing these words.
When we zoom out the picture of EUR/USD, we’ll see that the exchange rate is still trading under the previously-broken 38.2% Fibonacci retracement, which means that the negative implications of the earlier invalidation of the breakouts above this resistance and their impact on the exchange rate remain in the cards.
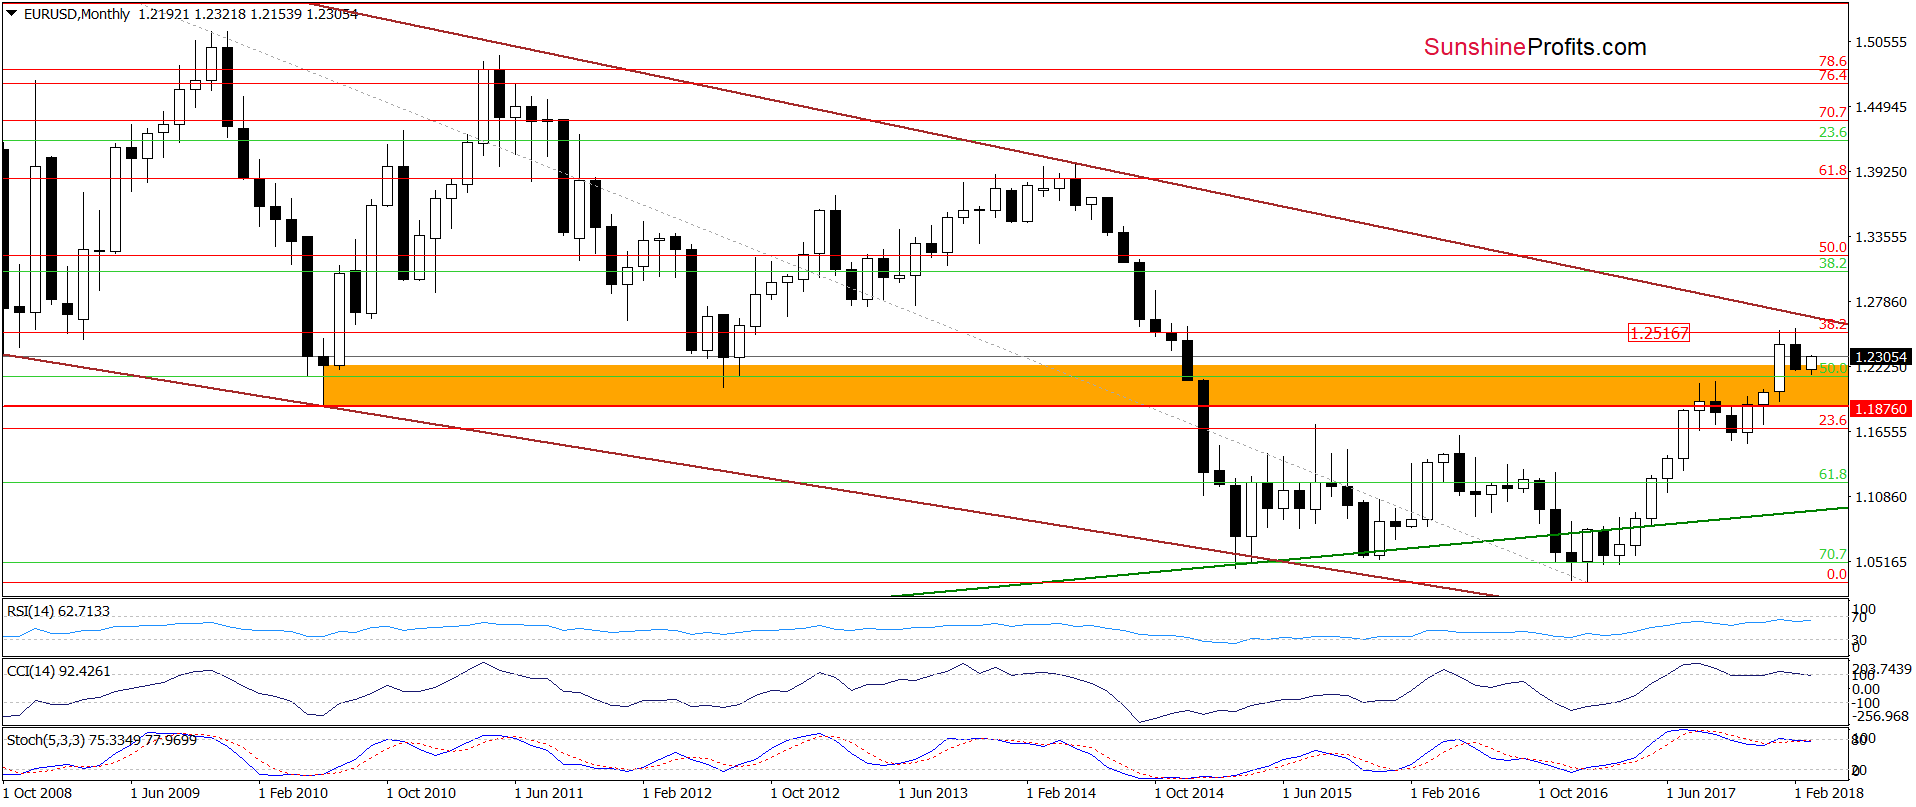
Additionally, the current position of the long-term indicators suggests that a bigger move to the downside is just a matter of time as the sell signals continue to support currency bears.
And what is the long-term perspective for GBP/USD? Let’s look below.
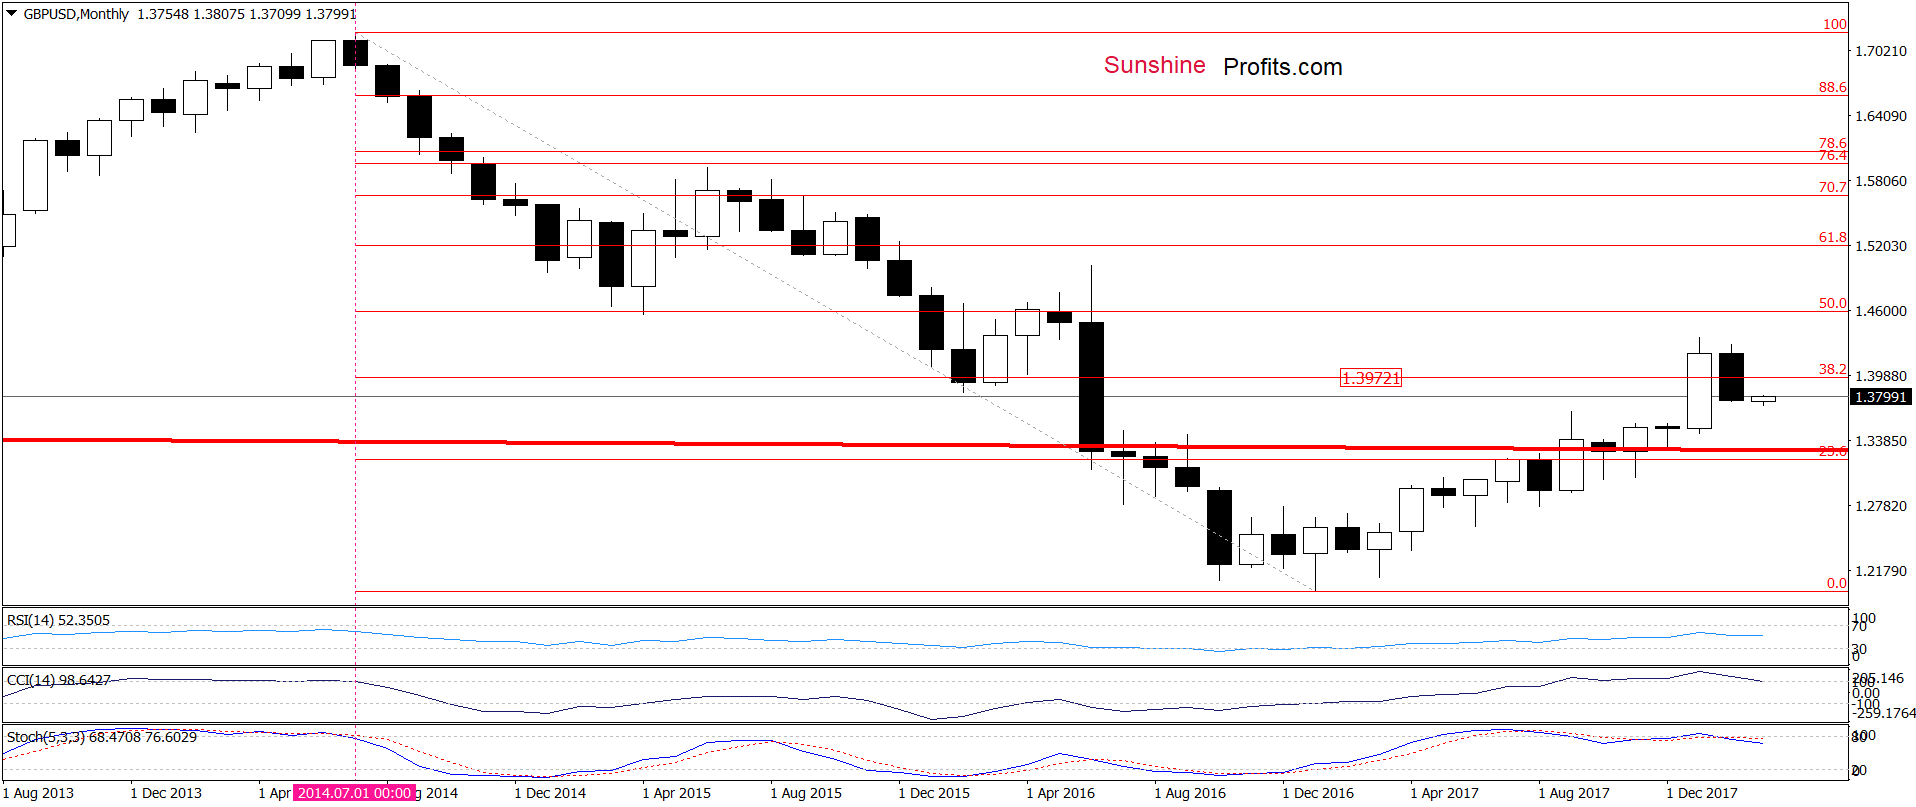
From today’s point of view, we see that currency bears invalidated the earlier breakout above the 38.2% Fibonacci retracement, finishing the previous month below this resistance. Additionally (similarly to what we wrote in the case of EUR/USD) the long-term sell signals favor the sellers.
Will the monthly chart of AUD/USD confirm this tendency? Let’s check.
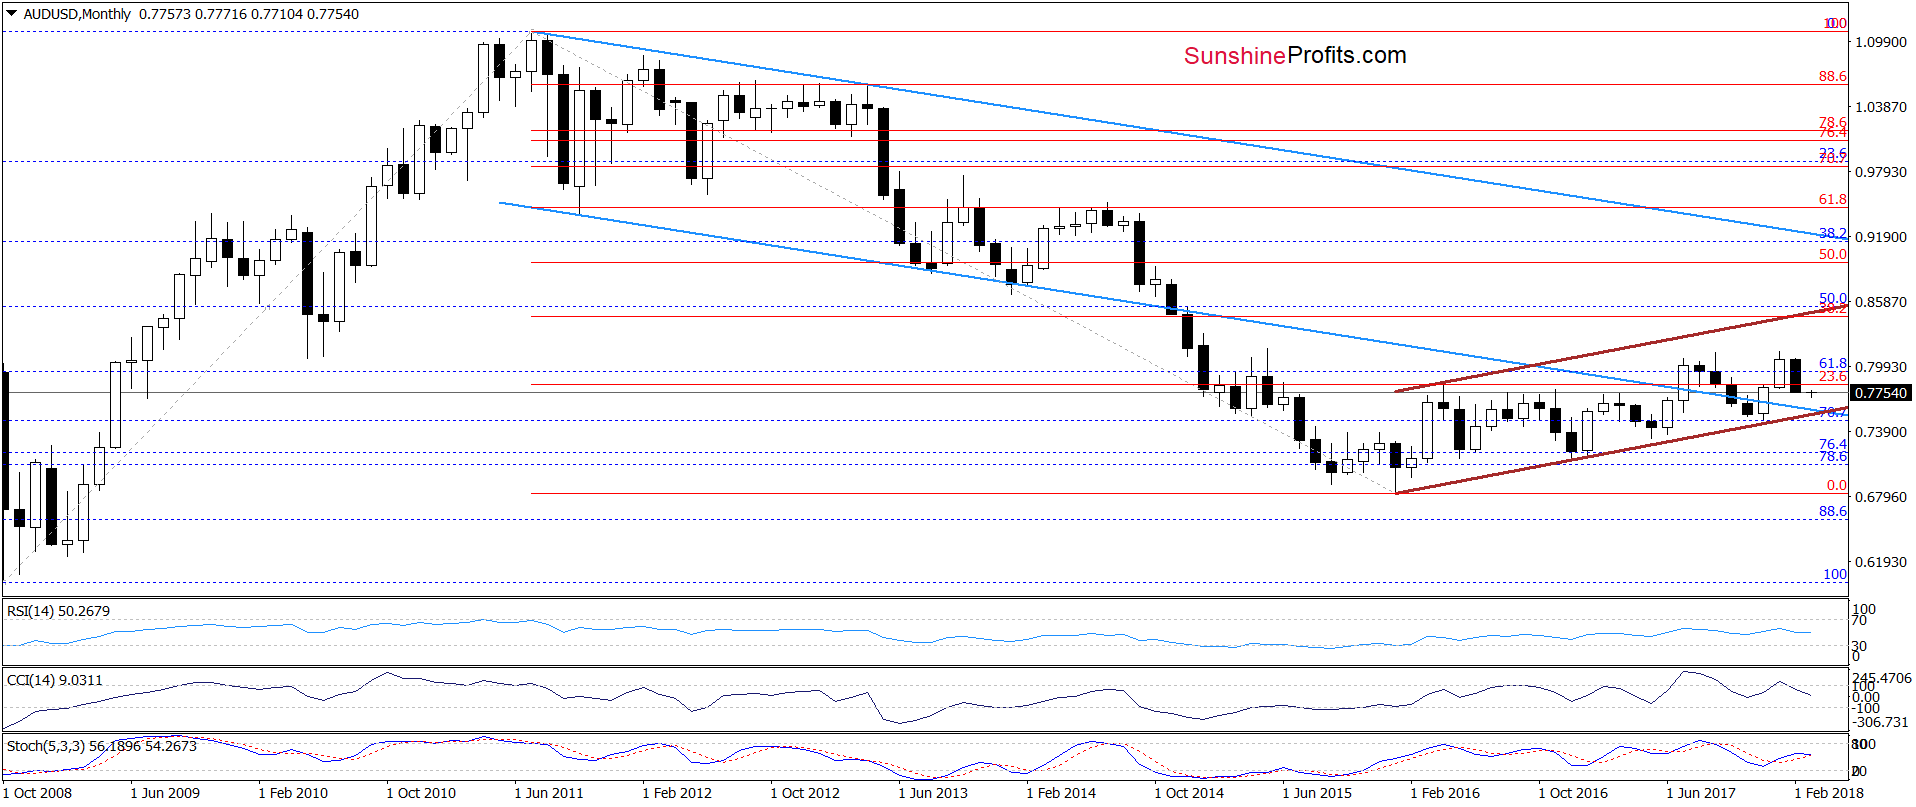
Looking at the above chart, we see that the size of the upward move (since the bottom created at the beginning of 2016) was smaller than in the previous cases, which does not change the fact that also in this case the bears managed to invalidate the earlier breakout above the Fibonacci retracement. Such price action in combination with the sell signals generated by the indicators confirms that they didn’t say the last word and lower values of currencies against the U.S. dollar are still ahead of us (even if we see short-lived rebounds first).
Finishing today’s Forex Trading Alert (in a slightly modified form), we would like to add that after analyzing the alerts’ results so far, we decided to modify them a bit and take profits off the table more often, because we want you to enjoy them as often as possible. Have a nice weekend.
Thank you.
Nadia Simmons
Forex & Oil Trading Strategist
Przemyslaw Radomski, CFA
Founder, Editor-in-chief, Gold & Silver Fund Manager
Gold & Silver Trading Alerts
Forex Trading Alerts
Oil Investment Updates
Oil Trading Alerts
