

Briefly: in our opinion, full (200% of the regular size of the position) speculative short positions in gold, silver and mining stocks are justified from the risk/reward perspective at the moment of publishing this alert.
Gold, silver, and mining stocks moved higher once again yesterday and the former even managed to move above the declining trend channel. Breakouts are bullish and thus the outlook for gold improved significantly… Or did it? Gold’s price in terms of the euro and gold’s relative performance to silver and mining stocks make replying to the above question quite easy. Looking at the relative price moves on a day-to-date basis doesn’t provide any interesting implications, but who says that it’s the only way in which one can examine them?
Let’s move right into the charts, starting with the gold market.
Another Day, Another Breakout in Gold
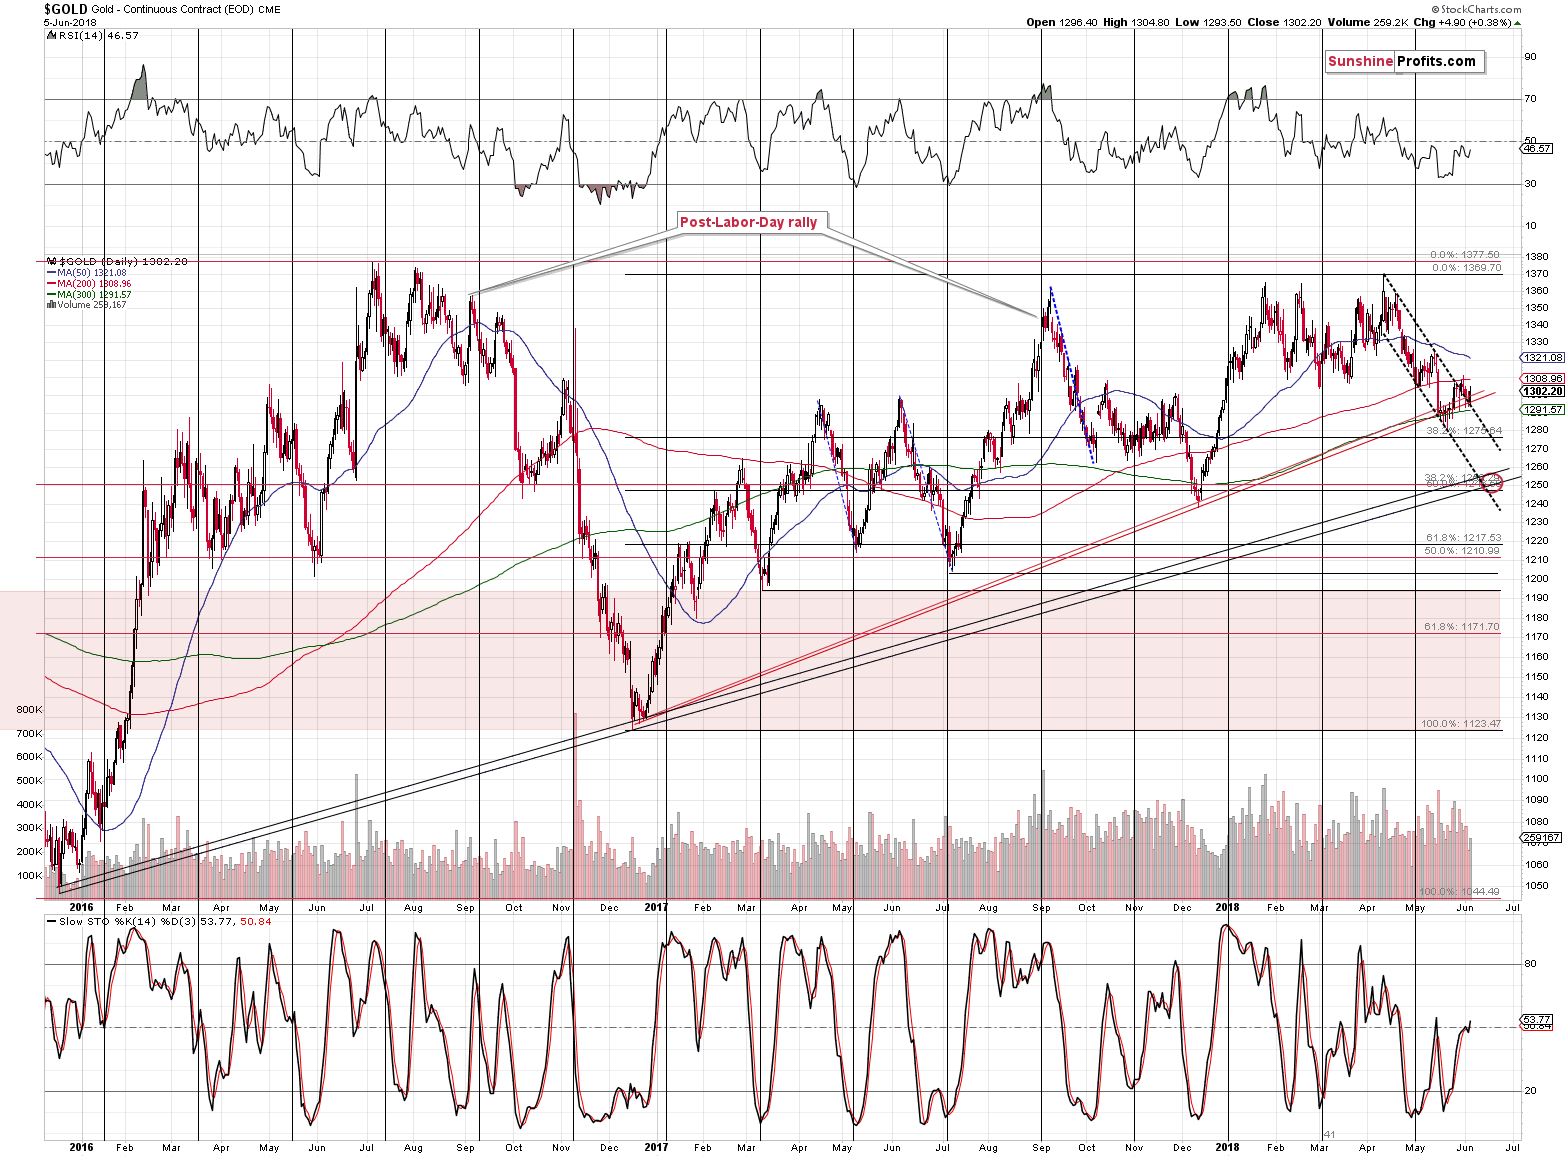
Yesterday’s upswing, as encouraging as it may have appeared, was nothing extraordinary. Yes, the price of gold moved above the upper border of the declining trend channel, but the same was the case just several days ago and the breakout was invalidated shortly as gold moved back below $1,290 shortly.
Breakouts need to be confirmed, before they can be viewed as important. If they are not, and are invalidated instead, they become bearish signs. We have just seen an example of this phenomenon in the gold market, and this should make us particularly suspicious to another attempt of gold to move above the declining resistance. This is especially the case, since gold moved higher on low volume. Yesterday’s breakout did not represent a fierce battle between bears and bulls that was won by the latter. It was more of a pause during which both sides were hesitating. Consequently, there are no bullish implications of yesterday’s upswing in gold.
This is especially the case, if we consider the situation in gold in terms of the euro.
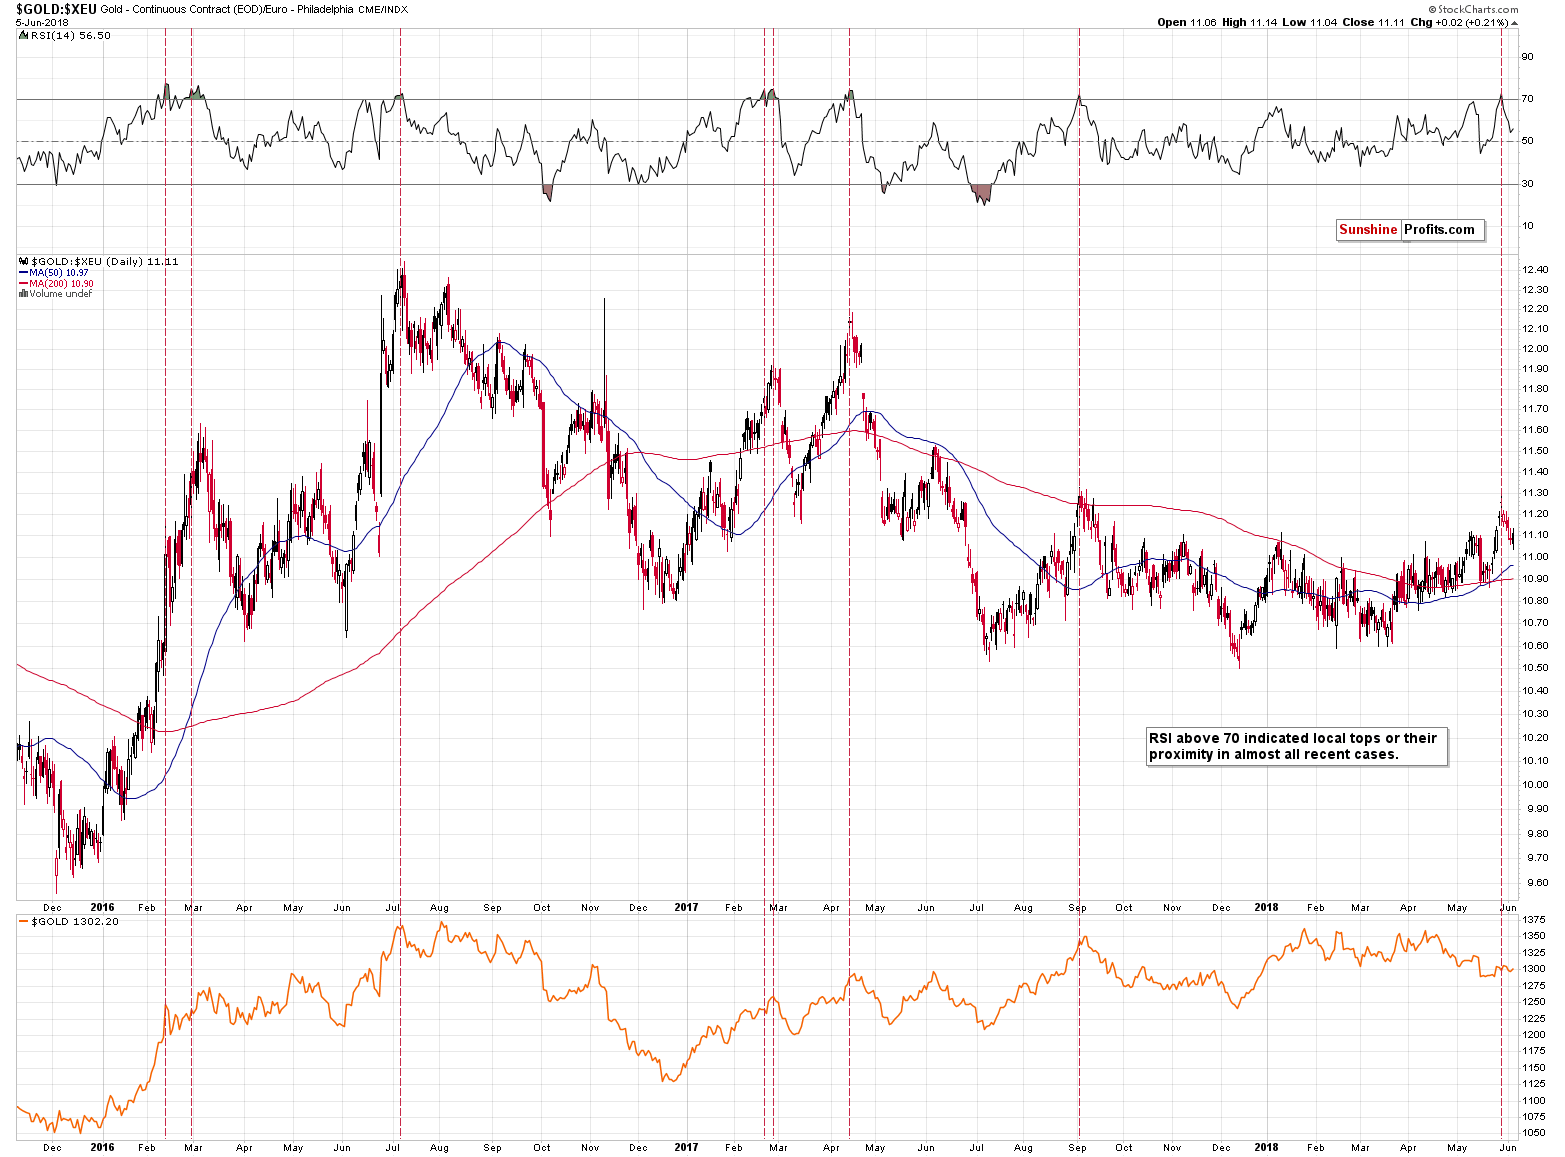
The RSI indicator based on this version of gold’s price has recently indicated a local top by moving above 70 and then back below it. With the exception of early 2016, this signal meant that a bigger decline was starting. We saw a small move higher since this signal became visible, but it’s not close to the sizes of the declines that we saw in analogous cases. Consequently, if history is to rhyme, we could expect gold to fall further in the short run.
Silver’s Subtle Outperformance
The size of the silver rally doesn’t seem significant at first sight, but the size of the volume in silver suggests that we may have seen something important. It’s not spectacular, but it is big if we compare it to the size of the volume in gold. The yellow metal moved higher on low volume, but what we see above is rather average. Could it be the case that the silver price action is somehow meaningful in relation to gold?
To answer this question, let’s take a look at the chart that features them both at the same time.
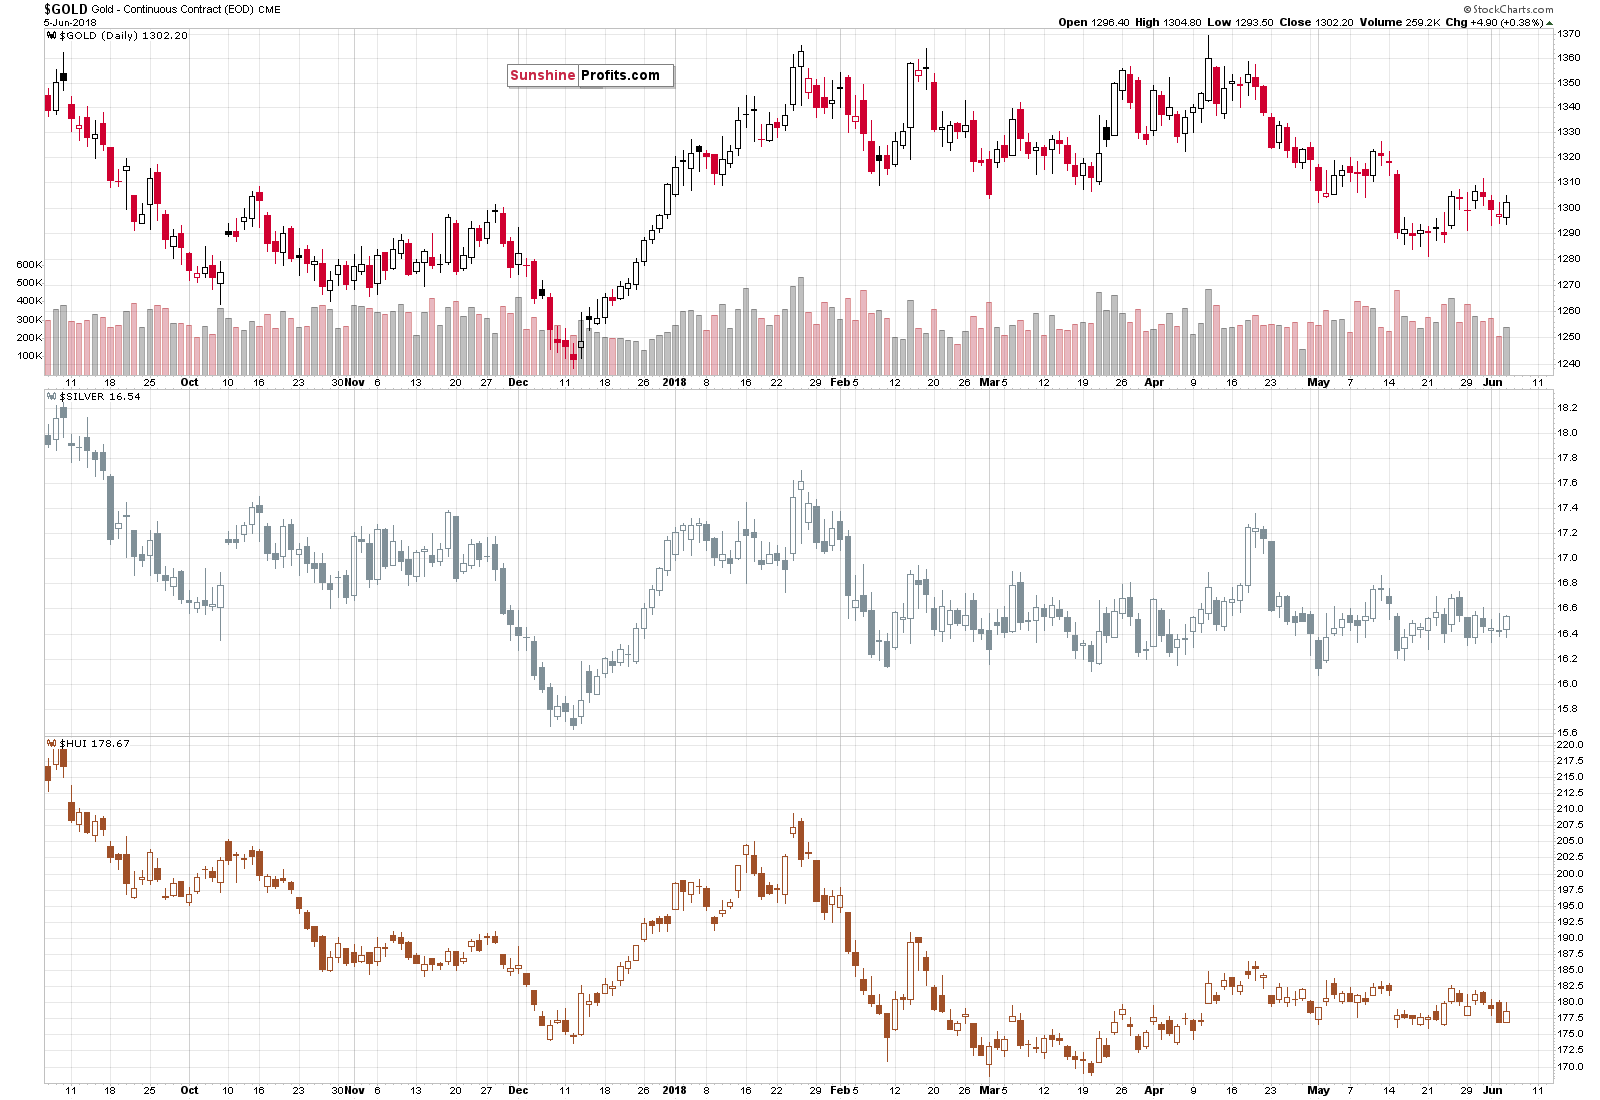
On a day-to-date basis, it may not appear significant, but if we consider the last 5 trading days, we’ll see that gold is lower than it was, gold stocks are lower than there were and that they underperformed gold, whereas silver is more or less where it was before.
This means that silver has indeed outperformed gold, while gold stocks underperformed. The signal is not as clear as if we had seen this kind of outperformance and underperformance on a single day, but it’s definitely meaningful.
[Edited 15 minutes after market's opening]: Today's morning performance of gold and silver is a perfect illustration of what we wrote in the previous paragraph. We're seeing an intraday repeat of the signal that we had also seen in the past 5 days. The implications are bearish.
As a reminder, silver’s outperformance and mining stocks’ underperformance is something that we usually see right before declines.
Speaking of reminders and silver’s outlook, it seems to be a good idea to take a look at silver’s long-term indications and check if they remain in place.
In short, they do.
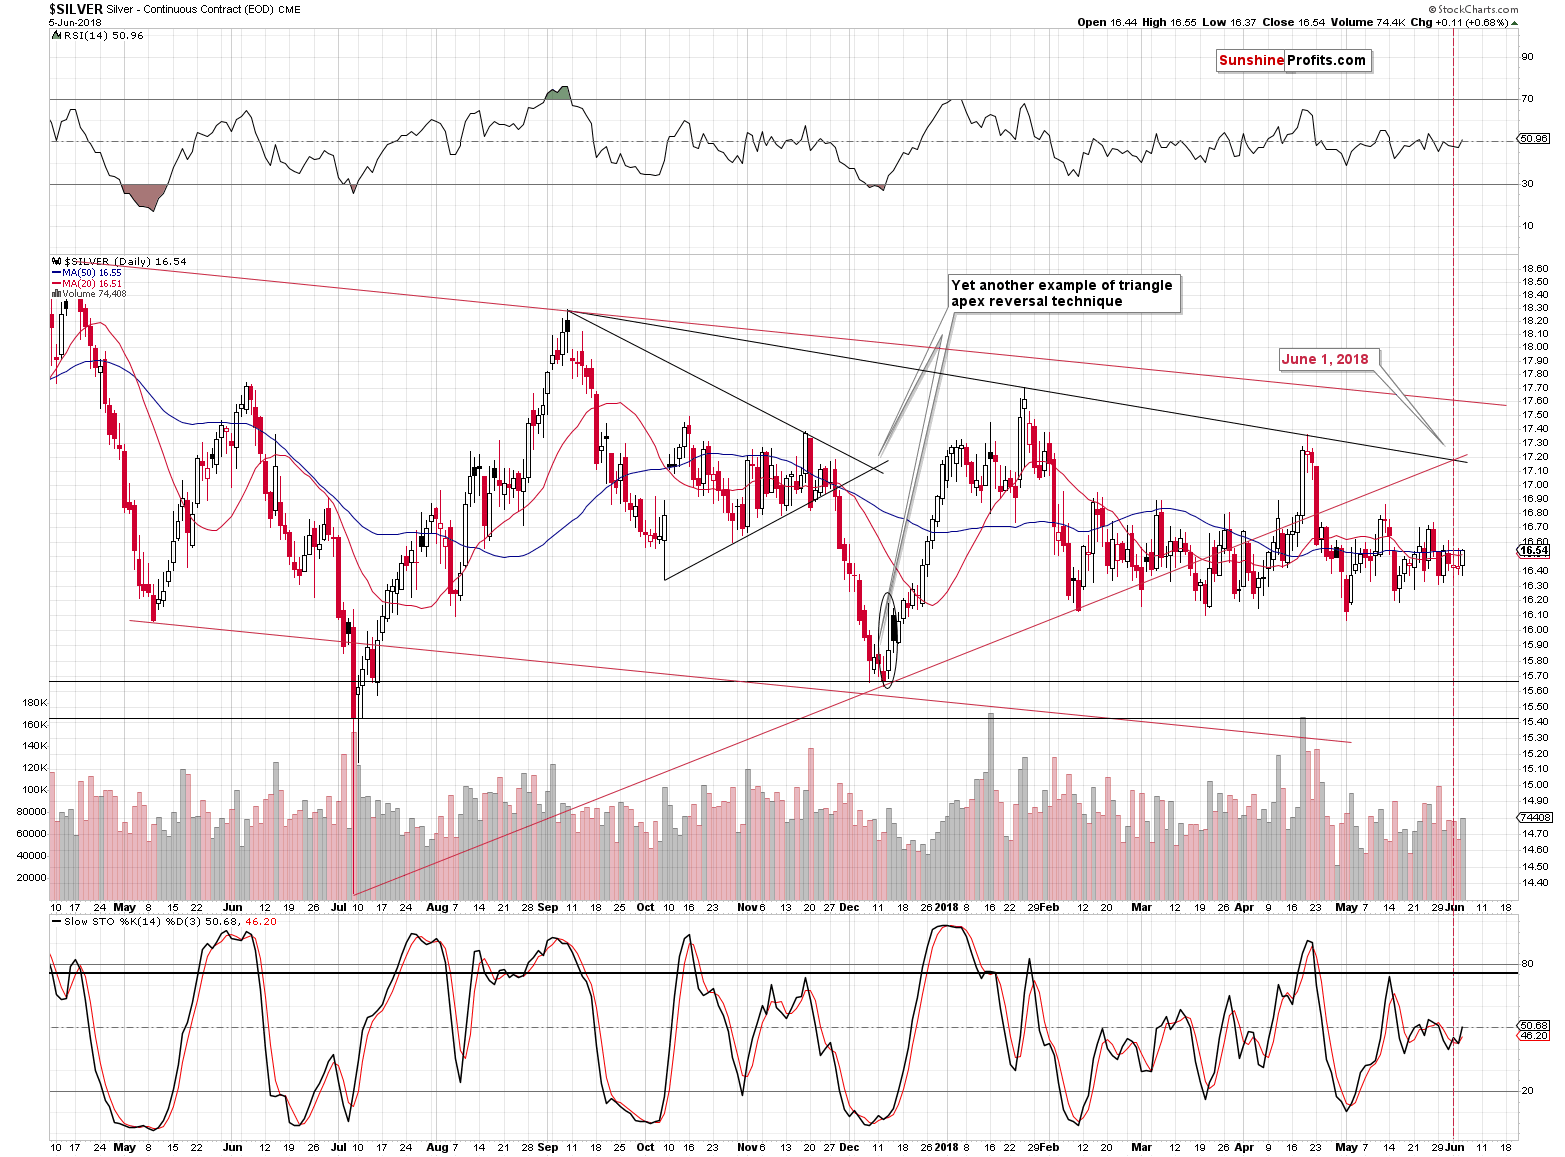
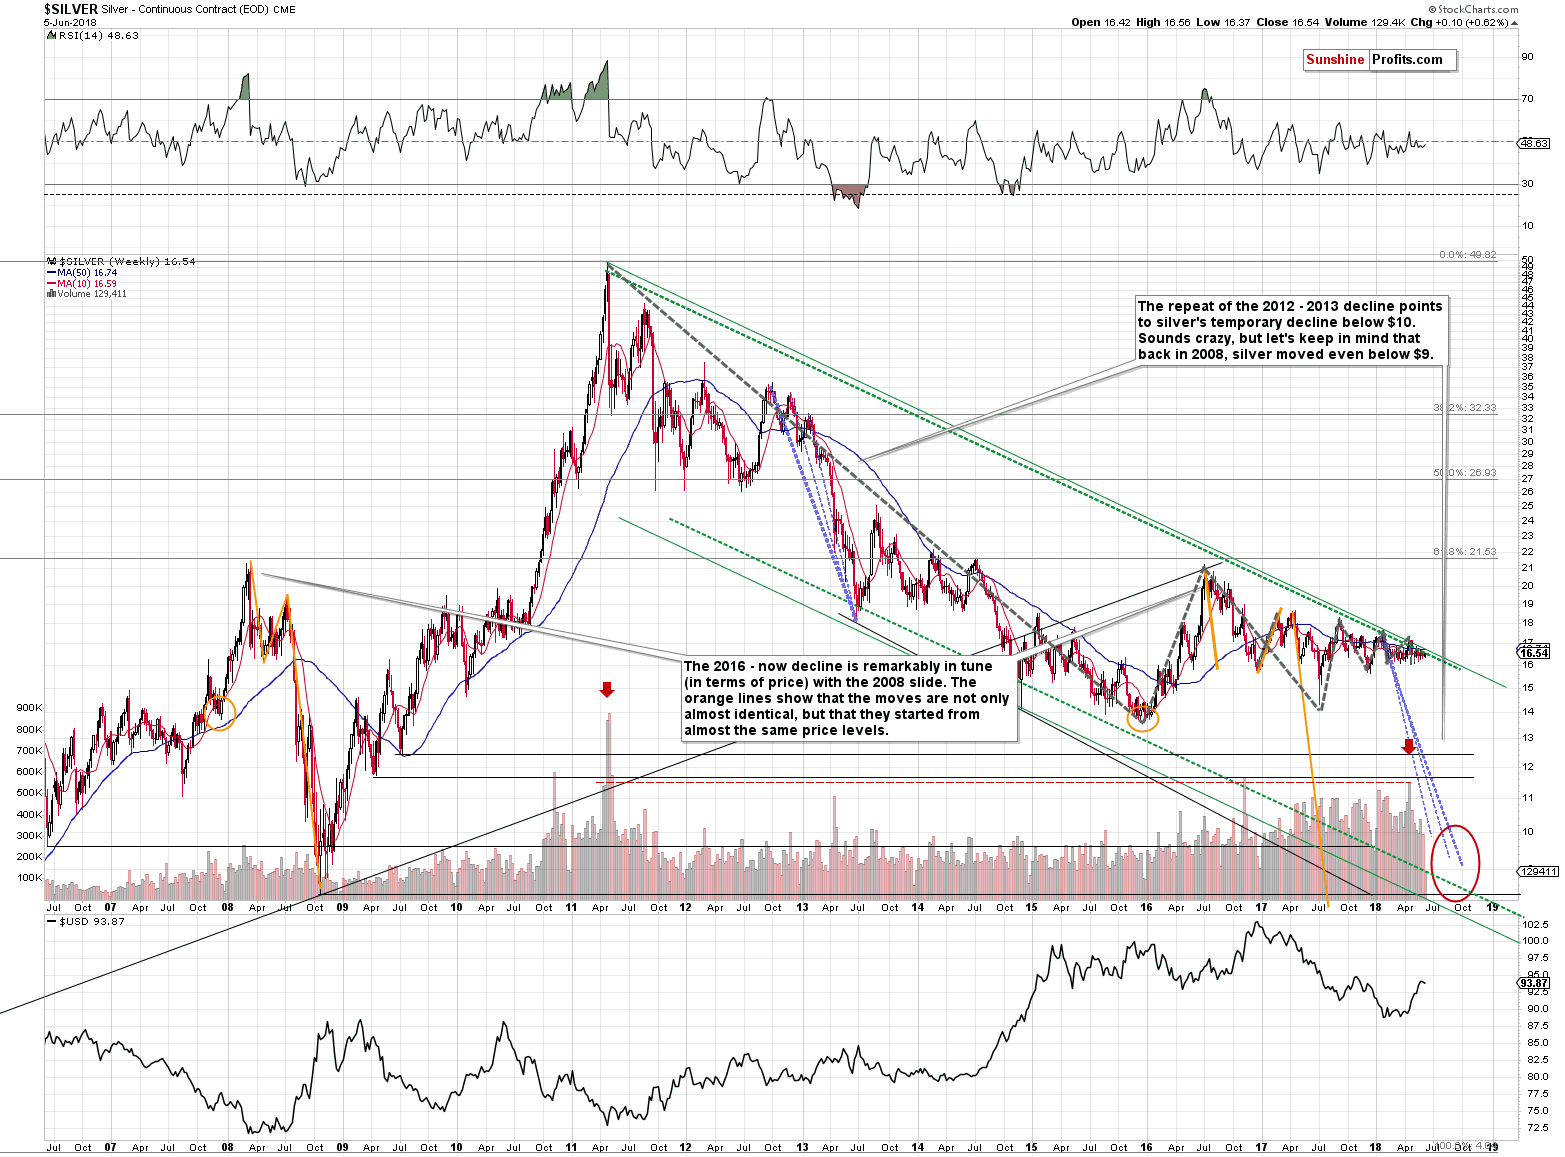
The first indication is the analogy to what happened in 2008. The price moves that we marked with orange lines in 2008 and in 2016 and 2017 are almost identical and we can even say that both patterns started from the same price level (areas marked with orange ellipses). In both cases, there were tops close to $21, then a decline to about $16 and then another attempt to move higher that ended at about $19.
The analogy is unbelievably clear and very bearish for the following months as the next big move that followed in 2008 was a decline below $9. The problem with this analogy is that it exists only in terms of price. In terms of time, there is no analogy, so the above doesn’t say when we should expect the big decline to take place.
The second indication is about silver’s oscillating nature and this signal definitely remains up-to-date, even though we first wrote about it in April. In fact, what we’ve been seeing in the past several weeks confirms it. Here’s the updated version of what we wrote back then:
Many years ago, when I was taking my school leaving exams, I thought to myself that I would never use one of the things that learned. One of the exams was a physics exam and my task on it was to show the derivation of the formula for the damping of vibration motion in a swinging pendulum. Don’t worry – I will not torture you with the derivation process. Instead I will prove myself wrong by actually applying some of the theory to the silver market.
There are quite a few things that actually are harmonic oscillators: for instance, something attached to a spring that’s being stretched and then let go, or a pendulum that’s swinging. In practice, they are all damped, because there are forces that make the subsequent moves smaller and smaller. For instance, friction can cause the moves to be damped. This may seem quite complicated when you read about it, but a brief look at a picture can make it all seem familiar.
Source: http://hyperphysics.phy-astr.gsu.edu/hbase/oscda.html
The moves, for instance in a swinging pendulum, are decreasing over time, just as what you can see above – the calculations behind it are rather complex, but the shape of the move is quite intuitive.
There seems to be one damped oscillator that no physics book ever featured. Maybe the only one ever which allows to directly profit from it.
The price of silver.
Since topping in 2011, silver has been moving back and forth in a specific way. The moves down and up were smaller, just like the ones in a damped harmonic oscillator.
On the above silver chart, we marked the key moves with thick gray dashed lines. Please note that their size is declining over time – just like it is the case with damped oscillators.
Ok, but why is this important from the investment point of view? Why should I care about all this?
Because it shows how little is needed for silver to start a massive move.
The existence of the oscillating pattern alone is not enough to draw the above conclusion, but it is enough once we combine it with the simple fact that the biggest and most volatile moves are characterized by declining and very low volatility. That’s exactly what the damped vibrations are – a decrease in silver’s volatility. The fact that silver’s price moves are smaller and smaller is a clear sign that silver is preparing for a big move. Based on multiple factors that we discussed previously, it’s likely that this big move is going to be lower.
What does the oscillating pattern imply again?
The oscillator implies a clear pattern – each move should be smaller than the previous one. As soon as the above is broken – by a move that’s bigger than the previous one, we have a major breakout or breakdown. Normally, one would want to wait for a bigger confirmation like a weekly close below or above a key price extreme. Being aware of the mentioned pattern, we know that it’s not necessary to wait for it. In other words, we’ll get the “Buckle up! The big move is starting!” signal much sooner than those who are not aware of this pattern.
Since the recent moves in silver were small (especially taking the last few weeks into account), it takes very little for the white metal to break from it and be ready for a major move. It seems that our patience with the current trading position will be well rewarded.
On a side note, in order to let everyone know more or less what we do in our regular alerts, every now and then we share parts of our analyses publicly (naturally, without disclosing the key details like positions and position sizes), but we will not share the above with anyone else. This part of our analysis will remain exclusive to you – our subscribers.
This brings us to the analysis of mining stocks.
Miners’ Short- and Long-term Signals
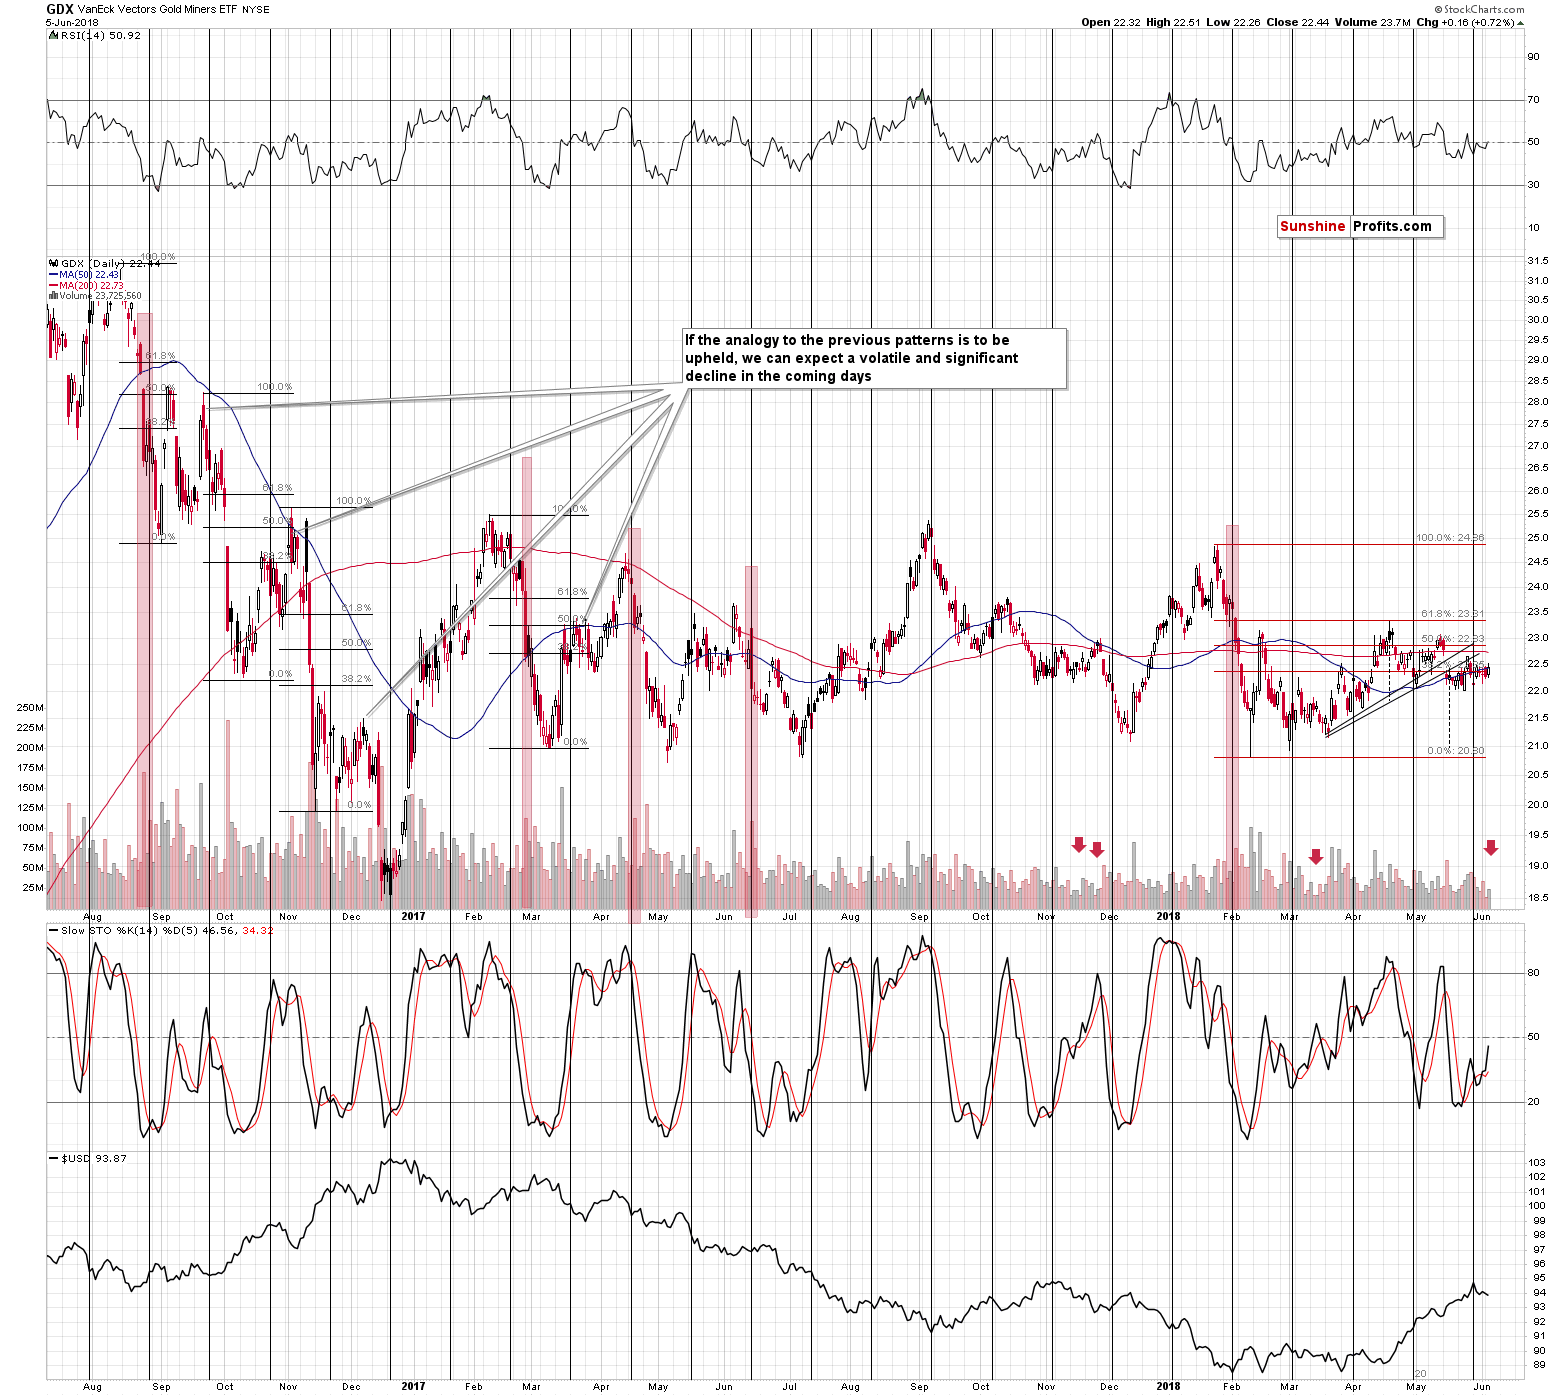
The volume that we saw yesterday was bigger than what we had seen on Monday, but it was still nothing to call home about. We can say the same thing about GDX’s rally of 16 cents. Mining stocks are moving back and forth and yesterday’s move was just a part of this pattern. Speaking of patterns, let’s not forget that miners have tested the mid-February high a few times and this means that they can now slide much lower. In other words, our Monday’s comments remain up-to-date:
After each short-term downswing that was particularly volatile, GDX moved back up a few times before the decline continued. The early 2018 decline was definitely very volatile, so we shouldn’t be surprised to see this kind of consolidation. It’s longer than the previous ones, but in terms of the prices that were reached, the 2016 price moves and the 2018 ones seem quite similar. The implication here is that once mining stocks break below their previous 2018 low, the following slide is likely to be volatile, just like the declines in 2016 were. In the light of the above, one might expect GDX to reach its late 2016 lows after such breakdown.
On a more short-term note, please note that mining stocks were also trying to break above the rising resistance line based on the March and early May lows, which is also the neck level of the bearish head-and-shoulders formation. Since there was no invalidation, the implications of this formation remain in place. Namely, GDX is likely to move at least to the mid-February 2018 lows rather sooner than later.
All in all, the short-term outlook for the precious metals mining stocks is bearish and it seems that it may become even more bearish later this month, after GDX breaks to the new 2018 lows.
As far as the big picture is concerned, the key thing to keep in mind about mining stocks is that they are after two major breakouts with regard to their performance vs. gold and vs. other stocks.

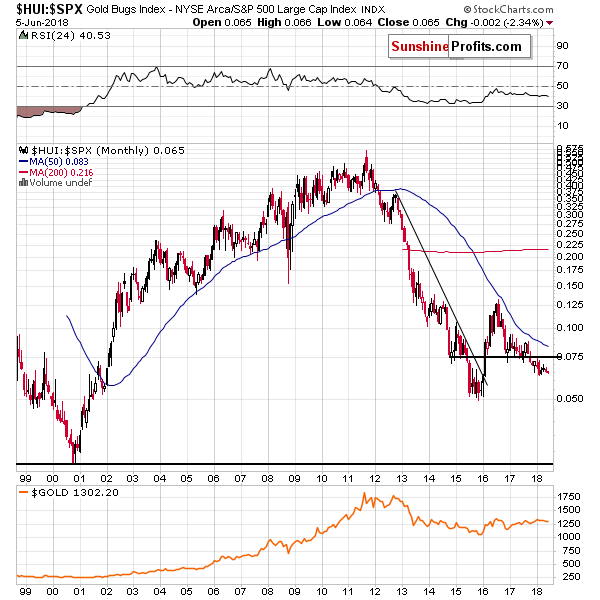
As you can see on the above charts, both key gold stock ratios are after major, long-term breakdowns. Both moves were also confirmed, which means that they were not accidental and the implications should be considered important. The moves were not only confirmed in terms of time and by a move back to the previously broken level (in the case of the HUI to gold ratio on the upper chart) – the moves actually confirm each other. If it was just one of the ratios providing this kind of signals, its strength would be limited, but since both of them point to the same – bearish – outlook, it’s something that one needs to keep in mind.
Summary
Summing up, while the precious metals market is boring on a day-to-day basis and nothing seems to be going on, if we consider a slightly broader timeframe, we see that the signals are pointing to lower prices in the coming weeks, which is in tune with the current True Seasonal patterns. Moreover, let’s keep in mind that the analogies to what happened in gold and silver when the market was just as boring as it’s been recently suggest that if we get another very short-term and small move higher, it may be the final one before the move to the final bottom begins.The outlook for the precious metals sector remains bearish.
As always, we’ll keep you – our subscribers – informed.
To summarize:
Trading capital (supplementary part of the portfolio; our opinion): Full short positions (200% of the full position) in gold, silver and mining stocks are justified from the risk/reward perspective with the following stop-loss orders and initial target price levels:
- Gold: initial target price: $1,251; stop-loss: $1,382; initial target price for the DGLD ETN: $48.88; stop-loss for the DGLD ETN $37.48
- Silver: initial target price: $15.73; stop-loss: $18.06; initial target price for the DSLV ETN: $27.58; stop-loss for the DSLV ETN $19.17
- Mining stocks (price levels for the GDX ETF): initial target price: $21.03; stop-loss: $23.54; initial target price for the DUST ETF: $28.88; stop-loss for the DUST ETF $21.16
In case one wants to bet on junior mining stocks' prices (we do not suggest doing so – we think senior mining stocks are more predictable in the case of short-term trades – but if one wants to do it anyway, we provide the details), here are the stop-loss details and initial target prices:
- GDXJ ETF: initial target price: $30.62; stop-loss: $36.14
- JDST ETF: initial target price: $59.68 stop-loss: $40.86
Long-term capital (core part of the portfolio; our opinion): No positions (in other words: cash)
Insurance capital (core part of the portfolio; our opinion): Full position
Plus, you might want to read why our stop-loss orders are usually relatively far from the current price.
Important Details for New Subscribers
Whether you already subscribed or not, we encourage you to find out how to make the most of our alerts and read our replies to the most common alert-and-gold-trading-related-questions.
Please note that the in the trading section we describe the situation for the day that the alert is posted. In other words, it we are writing about a speculative position, it means that it is up-to-date on the day it was posted. We are also featuring the initial target prices, so that you can decide whether keeping a position on a given day is something that is in tune with your approach (some moves are too small for medium-term traders and some might appear too big for day-traders).
Plus, you might want to read why our stop-loss orders are usually relatively far from the current price.
Please note that a full position doesn’t mean using all of the capital for a given trade. You will find details on our thoughts on gold portfolio structuring in the Key Insights section on our website.
As a reminder – “initial target price” means exactly that – an “initial” one, it’s not a price level at which we suggest closing positions. If this becomes the case (like it did in the previous trade) we will refer to these levels as levels of exit orders (exactly as we’ve done previously). Stop-loss levels, however, are naturally not “initial”, but something that, in our opinion, might be entered as an order.
Since it is impossible to synchronize target prices and stop-loss levels for all the ETFs and ETNs with the main markets that we provide these levels for (gold, silver and mining stocks – the GDX ETF), the stop-loss levels and target prices for other ETNs and ETF (among other: UGLD, DGLD, USLV, DSLV, NUGT, DUST, JNUG, JDST) are provided as supplementary, and not as “final”. This means that if a stop-loss or a target level is reached for any of the “additional instruments” (DGLD for instance), but not for the “main instrument” (gold in this case), we will view positions in both gold and DGLD as still open and the stop-loss for DGLD would have to be moved lower. On the other hand, if gold moves to a stop-loss level but DGLD doesn’t, then we will view both positions (in gold and DGLD) as closed. In other words, since it’s not possible to be 100% certain that each related instrument moves to a given level when the underlying instrument does, we can’t provide levels that would be binding. The levels that we do provide are our best estimate of the levels that will correspond to the levels in the underlying assets, but it will be the underlying assets that one will need to focus on regarding the signs pointing to closing a given position or keeping it open. We might adjust the levels in the “additional instruments” without adjusting the levels in the “main instruments”, which will simply mean that we have improved our estimation of these levels, not that we changed our outlook on the markets. We are already working on a tool that would update these levels on a daily basis for the most popular ETFs, ETNs and individual mining stocks.
Our preferred ways to invest in and to trade gold along with the reasoning can be found in the how to buy gold section. Additionally, our preferred ETFs and ETNs can be found in our Gold & Silver ETF Ranking.
As a reminder, Gold & Silver Trading Alerts are posted before or on each trading day (we usually post them before the opening bell, but we don't promise doing that each day). If there's anything urgent, we will send you an additional small alert before posting the main one.
=====
Latest Free Trading Alerts:
Italy has a new government. The 66th since World War II. Meanwhile, the U.S. unemployment rate declined to the 18-year low. What does it all mean for the gold market?
There seems to be some respite for Bitcoin traders. It might be tempting to take this breather as a sign of the tide turning. We highlight the reasons why you probably shouldn’t.
Respite for Bitcoin Traders Might Be Deceptive
=====
Hand-picked precious-metals-related links:
PRECIOUS-Gold ticks up on soft dollar, investors cautious amid trade tensions
Gold Investing Goes AWOL As Google Searches To 'Buy Gold' Hit 11-Year Low
Golden Predator and the Yukon Mint™ unveil first gold coin
Tiny Gold ETF Wages Fee War to Reap 10-Fold Surge in Assets
Gold Imports by India Have Slumped for a Fifth Month
U.S. Mint sales of American Eagle half-ounce gold bullion coins stall
Gold, World War II and Operation Fish
=====
In other news:
There’s nothing stopping the dollar now, HSBC’s chief currency strategist says
Trade Hopes Sustain Risk-On Mood; ECB Sinks Bonds: Markets Wrap
ECB Chief Economist Confirms June Meeting Is Crucial for QE Decision
India raises key rate for first time since 2014, retains 'neutral' stance
EU plans to hit U.S. imports with duties from July
World Bear Market Would Likely Start in Euro Zone, Gavekal Says
Visa failure shows the dangers of ditching cash
=====
Thank you.
Sincerely,
Przemyslaw Radomski, CFA
Founder, Editor-in-chief, Gold & Silver Fund Manager
Gold & Silver Trading Alerts
Forex Trading Alerts
Oil Investment Updates
Oil Trading Alerts

