

Briefly: In our opinion, full (150% of the regular full position) speculative short positions in gold, silver and mining stocks are justified from the risk/reward perspective at the moment of publishing this alert.
As we described in yesterday's alert, even though it got many people excited, the breakout above $1,300 was not a big deal and since it was not accompanied by practically any confirmations, it was likely to be invalidated – which is what we saw yesterday and in today’s pre-market trading. What’s next? Will we see another attempt to move above $1,300 or is the top final this time?
The latter scenario seems more likely because of all the long-term factors that are in play, because gold, silver and mining stocks moved to their target levels (silver slightly above it, but it’s more or less normal for the white metal to “fake out” before a move lower) and because we saw additional bearish signs yesterday. Let’s take a look at the charts (chart courtesy of http://stockcharts.com).
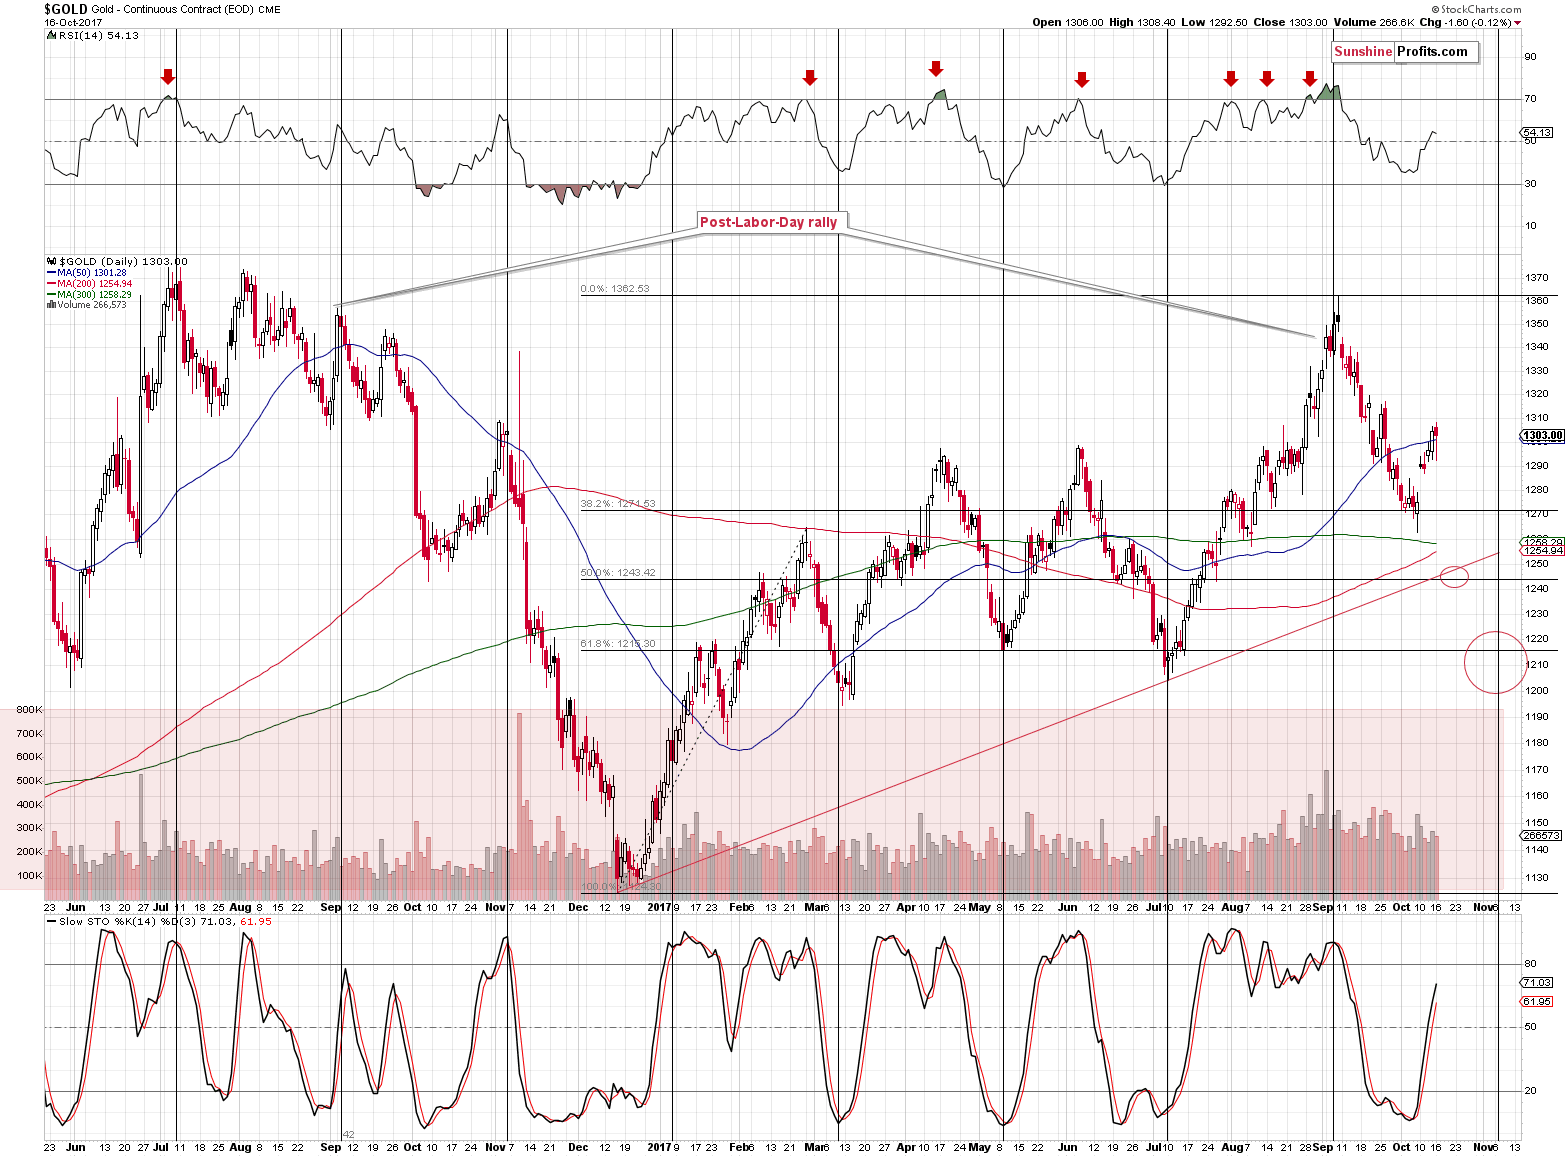
The price on the above chart doesn’t seem to truly reflect yesterday’s closing price – it was about $1,295 and at the moment of writing these words gold is trading at $1,289 - well below the $1,300 level. The recent breakout (above both $1,300 per se and the 50-day moving average) was already invalidated.
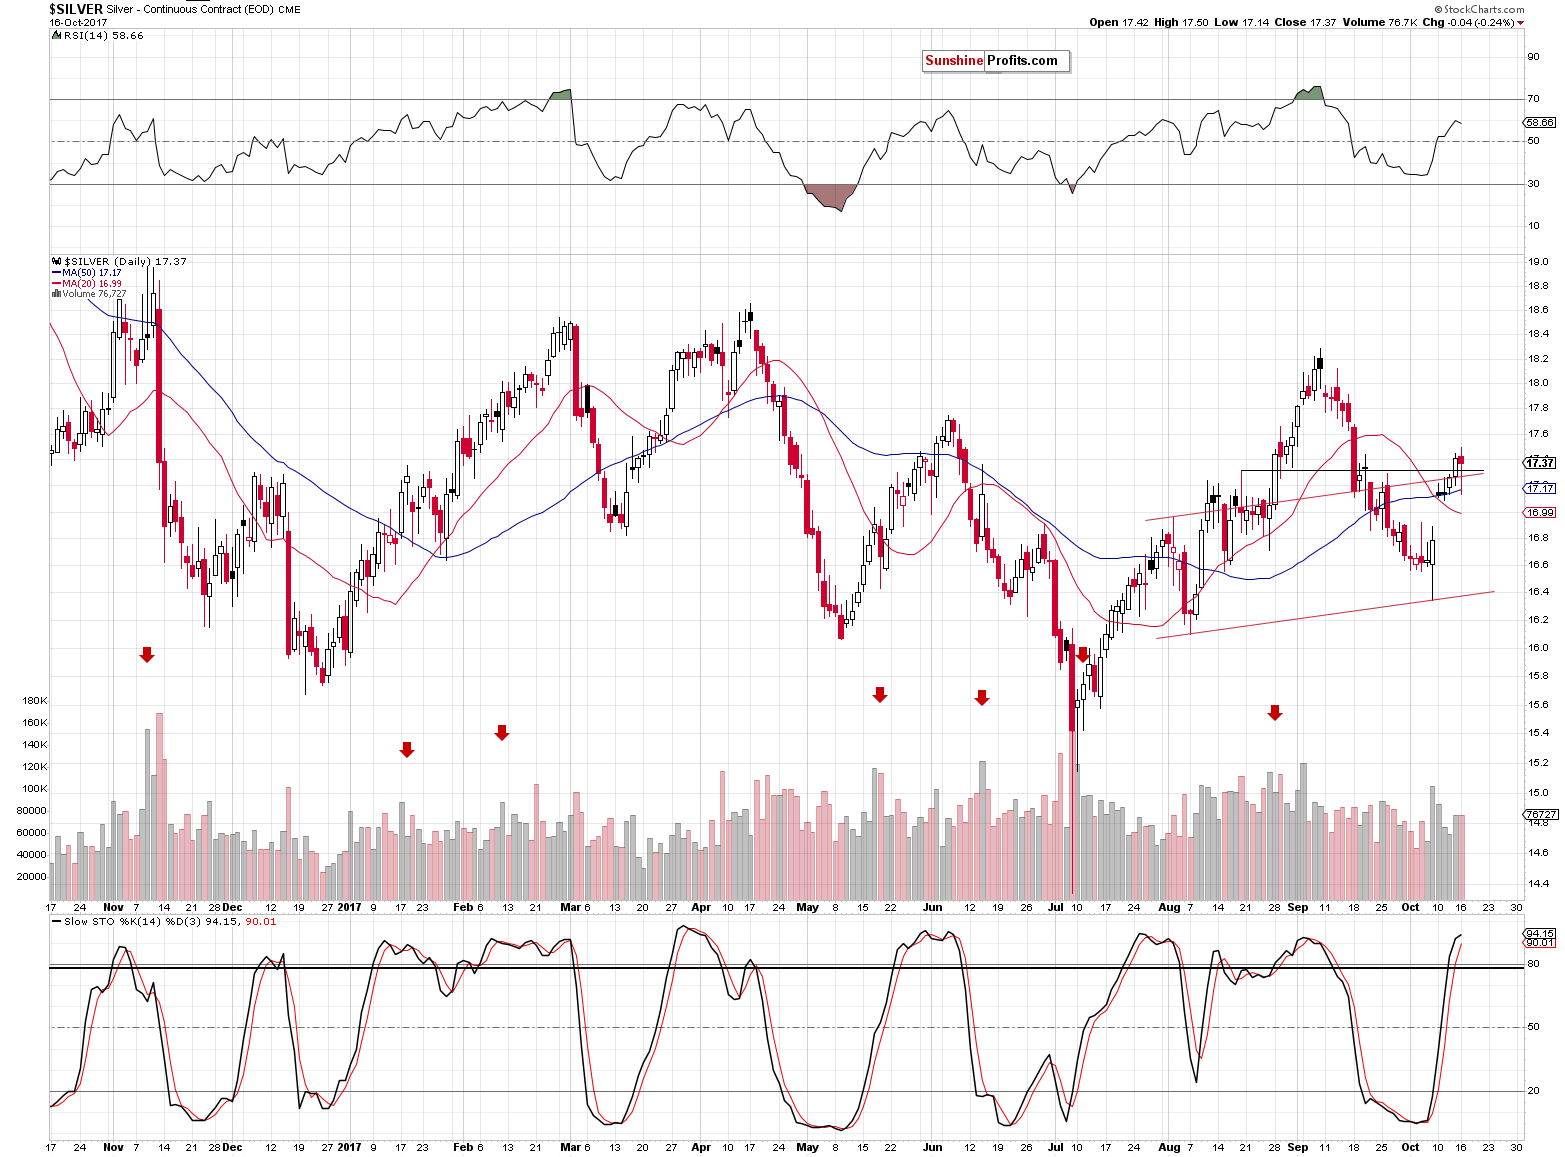
Silver is also back below its resistance levels. At the moment of writing these words, silver is trading at about $17.11 and today’s pre-market low (so far) is $16.96. In other words, silver has already erased last week’s gains with the exception of last Monday’s upswing.
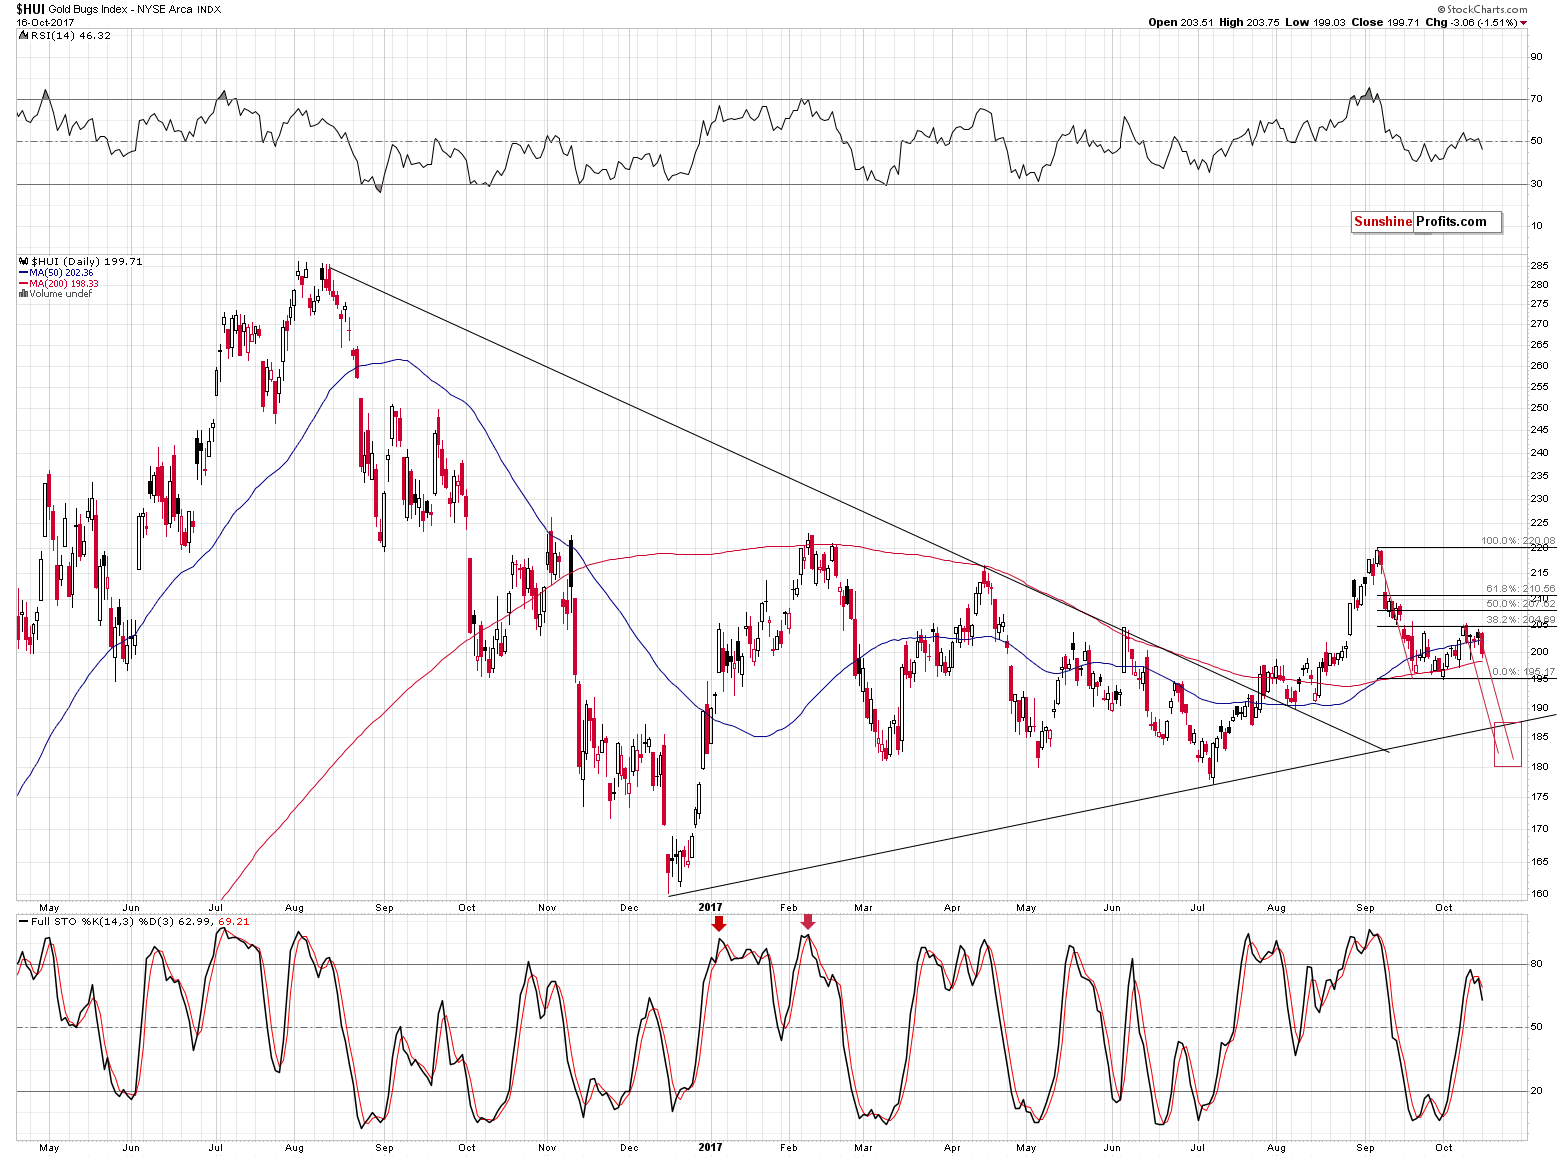
Gold stocks have already erased more than the previous week of gains. The HUI Index closed below the 200 level, its 50-day moving average and it showed weakness relative to gold and silver once again. The sell signal in the Stochastic indicator remains in place and we just saw an identical one in the case of the GDX ETF.
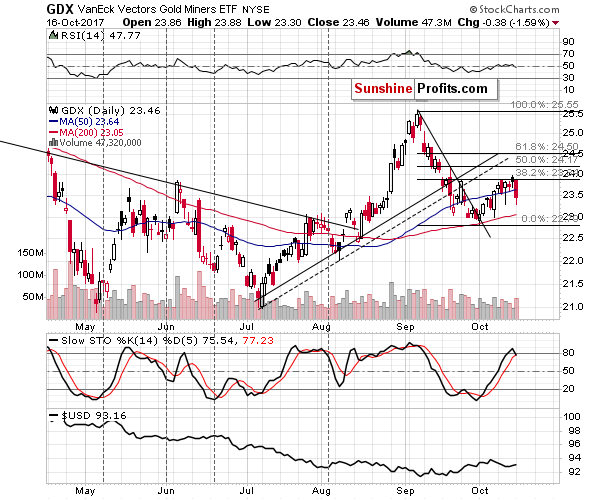
In the case of the GDX, we can also see that the volume during yesterday’s decline was relatively big, which further confirms the bearish outlook.
At this point we would like to remind you about the analogy between the current situation and what we saw in 2008 just before the slide – this analogy remains in near-perfect tune – we don’t want to quote an entire previous alert here, but we encourage you to review what we wrote 8 days ago.
The near-term implication is that we are likely to see a move back to the September low sometime this week or early in the next week and then (without another bigger correction) another slide to the 180 – 187 range in the HUI. Then – after a brief pause – the decline is likely to continue to the 2016 low (reaching them could also trigger a short-term correction).
Let’s move back to the HUI Index chart once again as it features a new technique that we’ve been validating for the precious metals market and it finally seems that it’s justified to include it in our set of tools. The technique is the triangle apex reversal. The technique is quite straightforward and even though it may appear somewhat random (it mixes both price and time), it works surprisingly well.
Moving to the point, the triangles are usually drawn in order to create support and resistance levels, check whether a breakout or breakdown is more likely and estimate the likely size of the move that follows the breakout or breakdown. However, if one continues to draw the triangle borders until they cross, they will get a quite precise time target. You can see the above in action on the HUI Index chart. The triangle’s apex is a bit below 185, in early September. The former is irrelevant, but the time wasn’t. The HUI Index indeed topped in early September.
We noticed that the more visible the triangle is and the greater number of extremes confirm its existence, the more reliable the prediction for the turning point becomes.
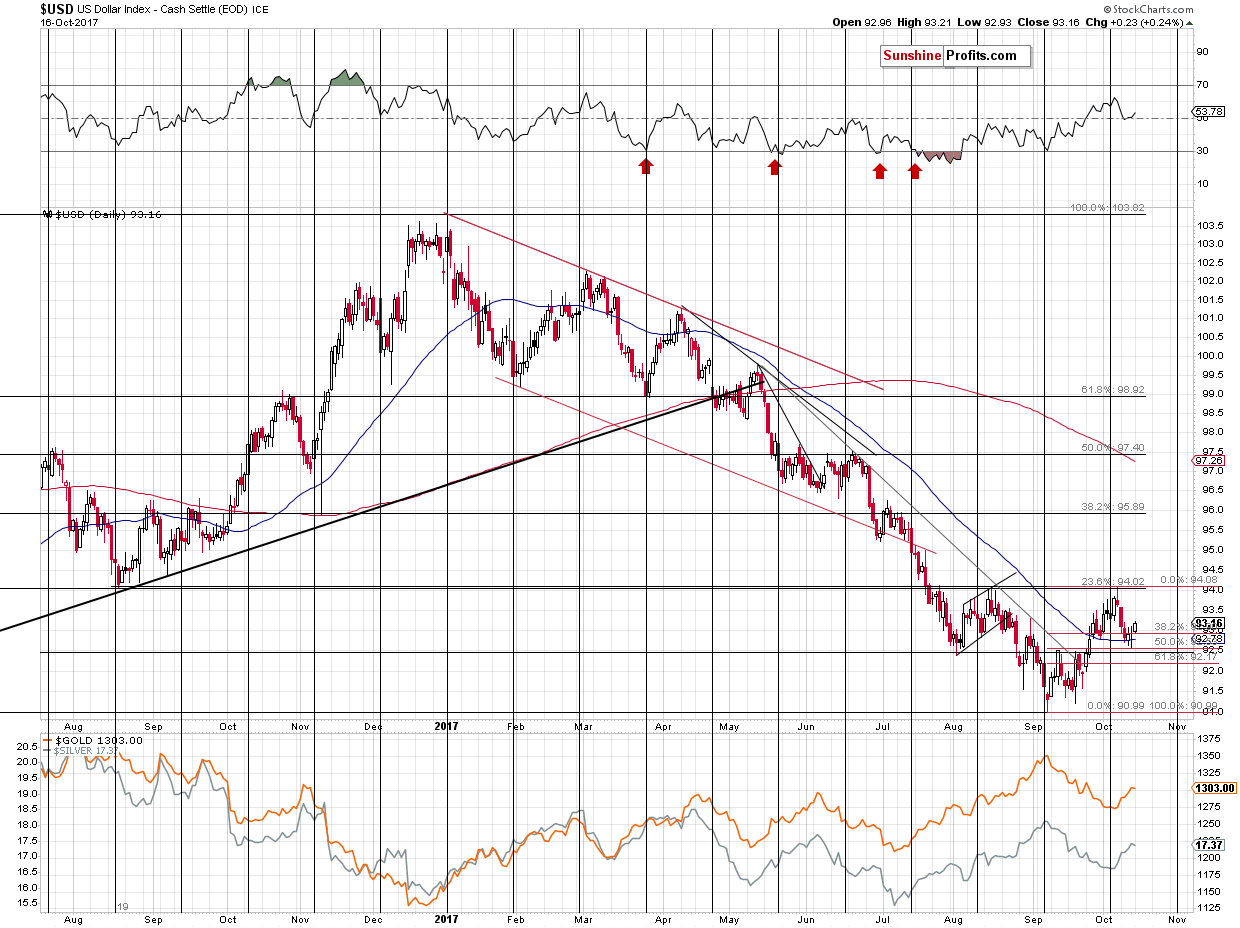
The USD Index moved higher once again (it’s above 93.40 at the moment of writing these words) and what we wrote yesterday remains up-to-date:
The USD Index moved to 92.59, which could mean that the bottom is already in. At the moment of writing these words, the USDX is back at 93.19, which could confirm the above, but we still can’t rule out another move toward 92.5 before the rally really starts. Either way, it seems that we are one step closer to seeing a bigger rally in the USD and another wave down in gold and the rest of the precious metals sector.
While we’re discussing the currency market, we would like to share a question that we received from one of our subscribers and provide a reply:
Again, concerning how gold is tracking the yen. The Yen Bollinger has tightened up just as it did back in November 2016 in which the yen topped exactly at the 50 MA. And gold still could go higher to top just where it topped when the yen topped at the beginning of Nov 2016. And then the yen dropped like a rock. I’m hoping this is going to happen. That means the XJY will top at the 50 day @ 90.32 or so and gold @ maybe 1310 and very temporarily higher. Gold then, @ Nov 2016, dropped a weekly slide of 60 or so. This topping action will be violent.
The set up seems possible from a fractal and technical indicator standpoint. It would send shockwaves to PM equities and set up a nice NUGT trade on a temporary bottom/rebound.
So the Yen dropping in tandem with the Euro giving ground, will send the USD soaring. My question is, is this scenario is viable? Will general equities be vulnerable such that both PM equities and the general SM will take a dive together? And then gold will finally hit bottom for a massive multi-year counter?
Here’s our take:
The Bollinger Band is indeed very tight in the case of the Japanese yen, which historically accompanied both important tops and important bottoms. The efficiency of this reversal indicator was quite significant. What does it indicate at this time? Most likely a top in the yen. Could gold move to $1,310 before declining? Naturally, but since it was just a few dollars below this level and it declined shortly thereafter and the decline continues also today, it seems much more likely that the top is already in.
As far as yen's 50-day moving average is concerned, this level worked in a very precise way as resistance in November 2016, but that was more of an exception than a norm - it used to work on a near-to basis in the past and the efficiency of this MA as support and resistance was rather average (for instance, it didn't work at all only a month ago). Consequently, while a bigger decline in the yen seems very likely, whether a temporary move back to the 50-day moving average would be seen beforehand seems rather unclear. Therefore, we wouldn't bet on higher yen values in the short term, but a bet on lower values in the following weeks may make sense. The implications for the precious metals sector are bearish in our view.
Will the general stock market slide along with the precious metals sector when the USD Index soars? This could be the case, at least initially. A higher USD Index means less competitive exports for the U.S. economy, which could translate into lower general stock market values. In this case, mining stocks and silver could be hit particularly hard and this does appear to be a quite likely outcome.
Summing up, it could be the case that the top in gold, silver and mining stocks is already in. On Friday, silver once again outperformed while miners disappointed, which was another classic bearish confirmation and the miners’ underperformance was seen also yesterday. Multiple bearish signals (i.a. gold’s huge monthly volume, analogy in the HUI Index, analogy between the two most recent series of interest rate hikes, and breakout in Nikkei) point to much lower gold prices in the following months and the short-term signals also confirm the bearish outlook.
As always, we will keep you – our subscribers – informed.
To summarize:
Trading capital (supplementary part of the portfolio; our opinion): Short positions (150% of the full position) in gold, silver and mining stocks are justified from the risk/reward perspective with the following stop-loss orders and initial target price levels / profit-take orders:
- Gold: initial target price level: $1,063; stop-loss: $1,366; initial target price for the DGLD ETN: $81.88; stop-loss for the DGLD ETN $38.74
- Silver: initial target price: $13.12; stop-loss: $19.22; initial target price for the DSLV ETN: $46.18; stop-loss for the DSLV ETN $17.93
- Mining stocks (price levels for the GDX ETF): initial target price: $9.34; stop-loss: $26.34; initial target price for the DUST ETF: $143.56; stop-loss for the DUST ETF $21.37
In case one wants to bet on junior mining stocks' prices (we do not suggest doing so – we think senior mining stocks are more predictable in the case of short-term trades – if one wants to do it anyway, we provide the details), here are the stop-loss details and initial target prices:
- GDXJ ETF: initial target price: $14.13; stop-loss: $45.31
- JDST ETF: initial target price: $417.04; stop-loss: $43.12
Long-term capital (core part of the portfolio; our opinion): No positions (in other words: cash)
Insurance capital (core part of the portfolio; our opinion): Full position
Important Details for New Subscribers
Whether you already subscribed or not, we encourage you to find out how to make the most of our alerts and read our replies to the most common alert-and-gold-trading-related-questions.
Please note that the in the trading section we describe the situation for the day that the alert is posted. In other words, it we are writing about a speculative position, it means that it is up-to-date on the day it was posted. We are also featuring the initial target prices, so that you can decide whether keeping a position on a given day is something that is in tune with your approach (some moves are too small for medium-term traders and some might appear too big for day-traders).
Plus, you might want to read why our stop-loss orders are usually relatively far from the current price.
Please note that a full position doesn’t mean using all of the capital for a given trade. You will find details on our thoughts on gold portfolio structuring in the Key Insights section on our website.
As a reminder – “initial target price” means exactly that – an “initial” one, it’s not a price level at which we suggest closing positions. If this becomes the case (like it did in the previous trade) we will refer to these levels as levels of exit orders (exactly as we’ve done previously). Stop-loss levels, however, are naturally not “initial”, but something that, in our opinion, might be entered as an order.
Since it is impossible to synchronize target prices and stop-loss levels for all the ETFs and ETNs with the main markets that we provide these levels for (gold, silver and mining stocks – the GDX ETF), the stop-loss levels and target prices for other ETNs and ETF (among other: UGLD, DGLD, USLV, DSLV, NUGT, DUST, JNUG, JDST) are provided as supplementary, and not as “final”. This means that if a stop-loss or a target level is reached for any of the “additional instruments” (DGLD for instance), but not for the “main instrument” (gold in this case), we will view positions in both gold and DGLD as still open and the stop-loss for DGLD would have to be moved lower. On the other hand, if gold moves to a stop-loss level but DGLD doesn’t, then we will view both positions (in gold and DGLD) as closed. In other words, since it’s not possible to be 100% certain that each related instrument moves to a given level when the underlying instrument does, we can’t provide levels that would be binding. The levels that we do provide are our best estimate of the levels that will correspond to the levels in the underlying assets, but it will be the underlying assets that one will need to focus on regarding the signs pointing to closing a given position or keeping it open. We might adjust the levels in the “additional instruments” without adjusting the levels in the “main instruments”, which will simply mean that we have improved our estimation of these levels, not that we changed our outlook on the markets. We are already working on a tool that would update these levels on a daily basis for the most popular ETFs, ETNs and individual mining stocks.
Our preferred ways to invest in and to trade gold along with the reasoning can be found in the how to buy gold section. Additionally, our preferred ETFs and ETNs can be found in our Gold & Silver ETF Ranking.
As a reminder, Gold & Silver Trading Alerts are posted before or on each trading day (we usually post them before the opening bell, but we don't promise doing that each day). If there's anything urgent, we will send you an additional small alert before posting the main one.
=====
Latest Free Trading Alerts:
On Sunday, there was an election in Austria, while on Monday, the Catalan leader failed to clarify the independence call. What do these events mean for the gold market?
=====
Hand-picked precious-metals-related links:
PRECIOUS-Gold prices fall as dollar extends gains
Goldman Says Gold Beats Bitcoin as Bank Weighs Fear and Wealth
VAT on gold and diamonds in UAE: DMCC chief urges rethink
=====
In other news:
Powell likely next Fed chief, though Yellen best suited: economists
New Bank of England deputy says not ready to vote for rate hike
BOE Nears ‘Tipping Point’ as Inflation Climbs to 5 1/2 Year High
How Wall Street's Head Honchos Feel About Cryptocurrency
Photos: The secret Swiss mountain bunker where millionaires stash their bitcoins
=====
Thank you.
Sincerely,
Przemyslaw Radomski, CFA
Founder, Editor-in-chief, Gold & Silver Fund Manager
Gold & Silver Trading Alerts
Forex Trading Alerts
Oil Investment Updates
Oil Trading Alerts

