

Briefly: in our opinion, full (250% of the regular size of the position) speculative short position in silver, and mining stocks is justified from the risk/reward perspective at the moment of publishing this Alert. We are temporarily out of the gold market.
Gold prices have finished Friday on a strong note, and have been adding to their gains earlier today. It represents a challenge of the late-2013 high. Can we expect more short-term strength - how would such a breakout fit the long-term factors? Let's not forget that these moves are happening against a backdrop of the U.S.-China trade war (of words) escalation. Let's take on the above points, one by one.
Gold moved visibly higher at the end of the previous week and also in this week's early trading, suggesting a breakout above the late-2013 high. This move was not yet confirmed, but it's significant enough to think that gold will continue to move higher in the short term as traders fully react to the trade-war scare. "Scare" because the trade war is more about mutual threats than actual actions and it can - and quite likely will - all be voided in a flash. But it seems that until that happens gold might move temporarily higher. This doesn't change the big picture based on which gold is still likely to decline severely as the USD Index soars.
Let's take a look at gold's long-term chart.
Gold: the Short-Term Upswing vs. the Long-Term Factors
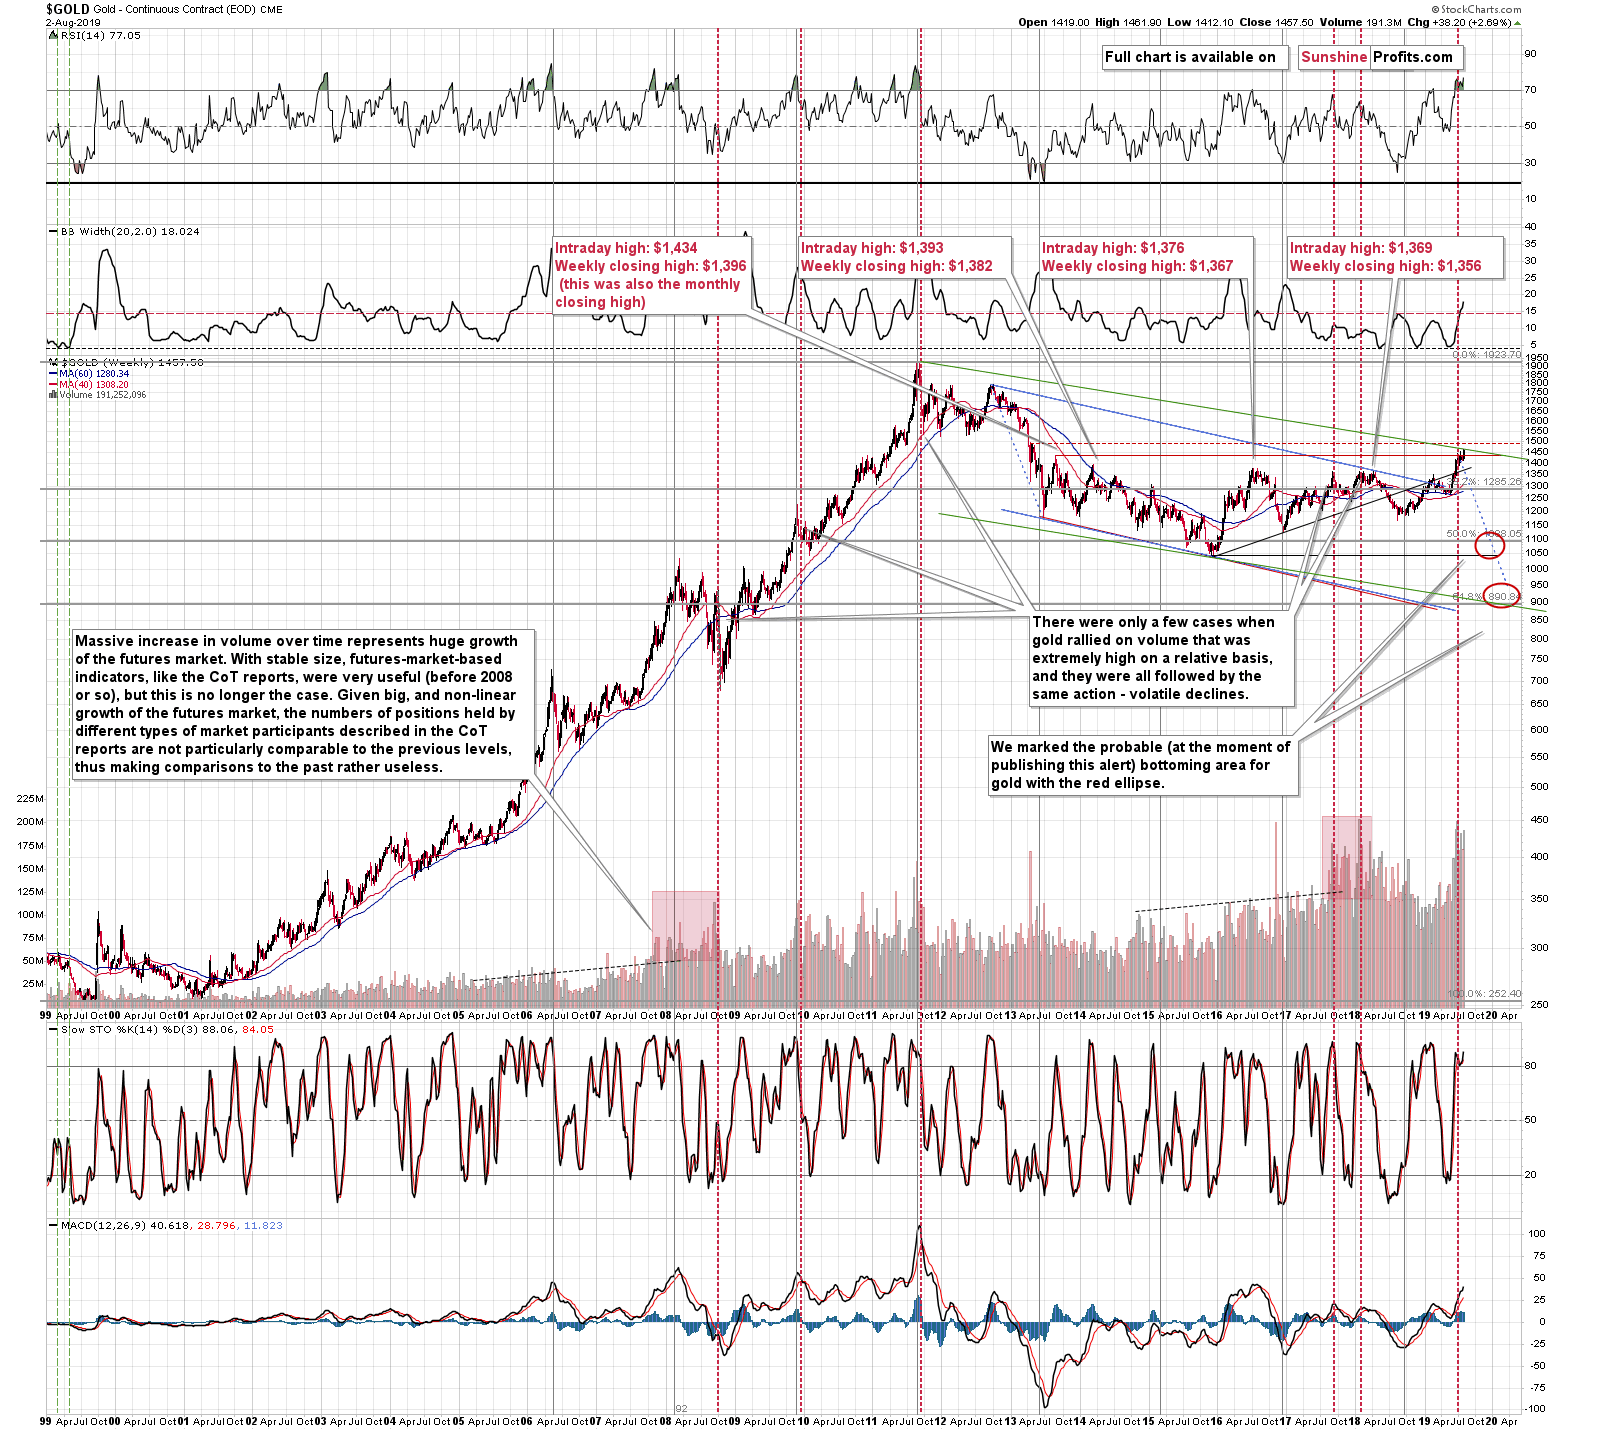
Gold seems to have broken above the late-2013 high and this move is now being verified. Some may even say that the breakout was already verified as the move above the intraday high of $1,434 is so big, and there is some truth to it. The next resistance is at about $1,500, which is where gold topped after the first corrective upswing in 2013 - $1,487. Gold might even move briefly above it, approaching $1,500, but it's unlikely to confirm a breakout above it. Why not?
For instance, because the huge-volume readings along with the very overbought status of the RSI indicator continue to point to much lower price levels. Practically all cases when gold moved higher on volume that was so extreme (or when we saw huge volume spikes) meant that really big declines were just around the corner. The red vertical lines emphasize these cases. The three notable cases that were accompanied by particularly big volume or the spike was particularly significant are: the mid-2008 top, the 2011 top, and the early 2018 top. These are the cases that are most similar to what we see in gold's price/volume performance right now. The implications are bearish.
The same goes for the situation on the very long-term charts for gold mining stocks and for silver. Our previous comments remain up-to-date, but there's one thing that we would like to add. The Stochastic Oscillator based on the weekly prices of the HUI Index has a history of being a very reliable sign for the major tops. We just saw this signal, which suggests much lower mining stock prices in the following weeks.
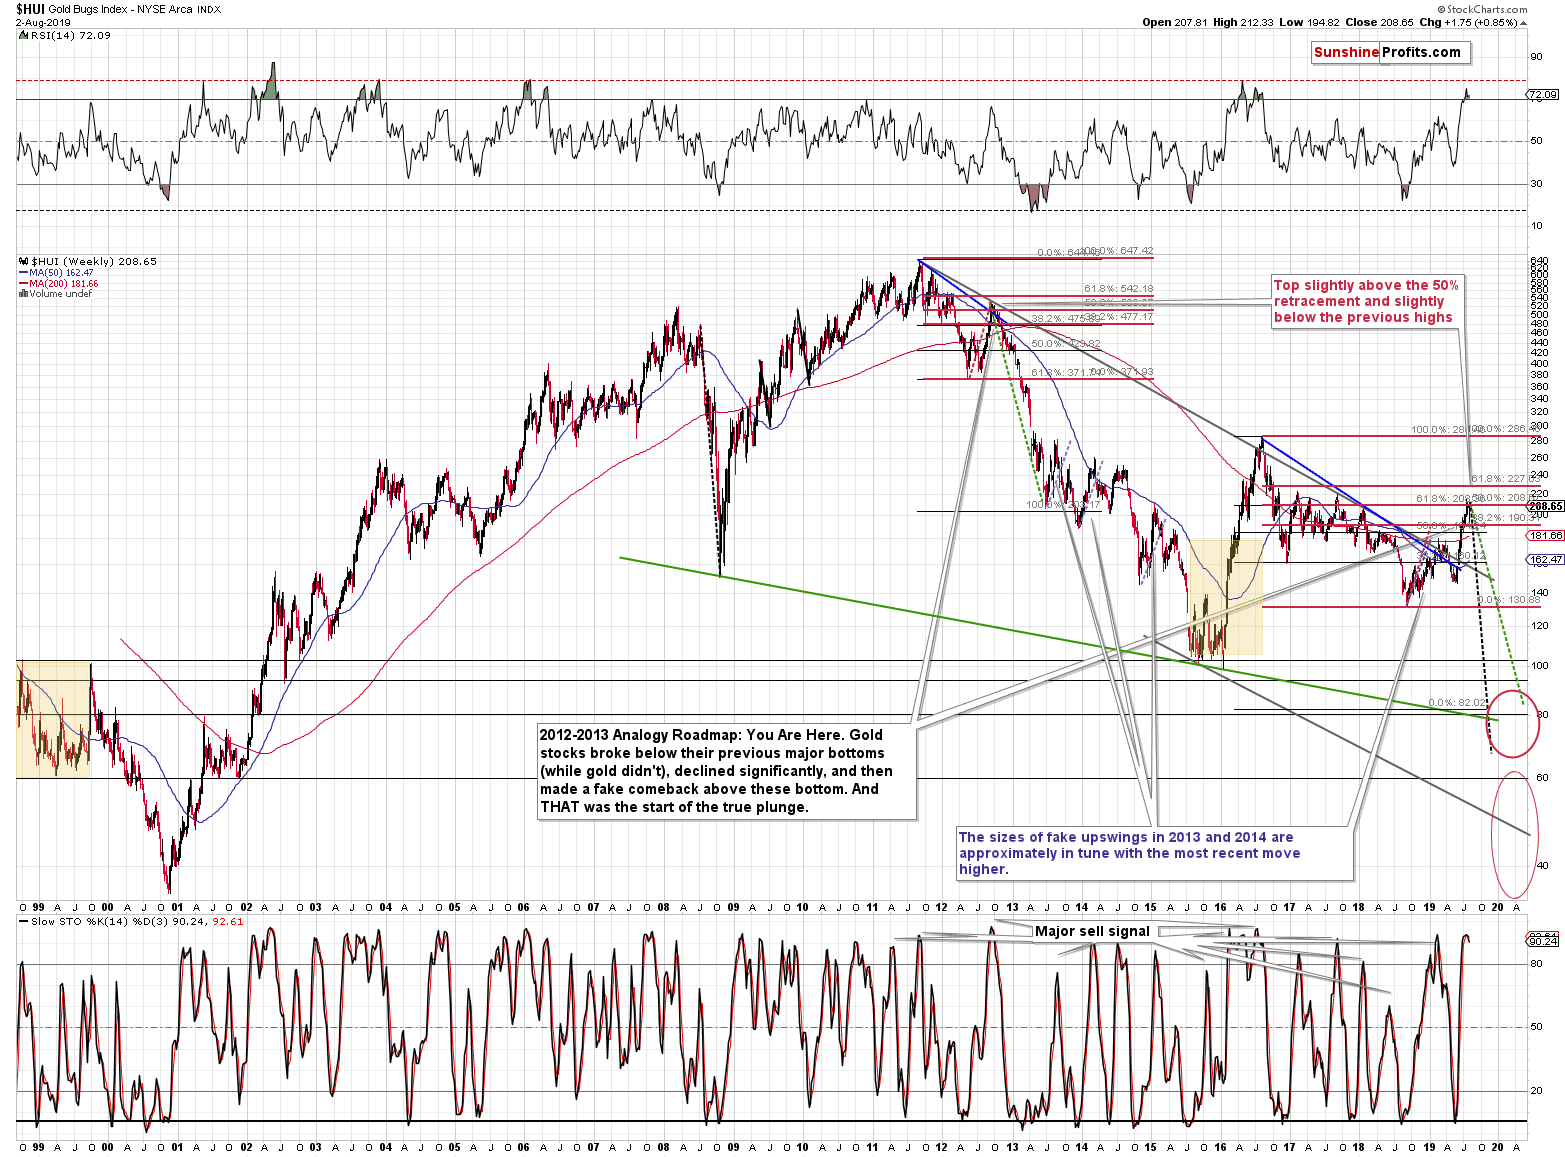
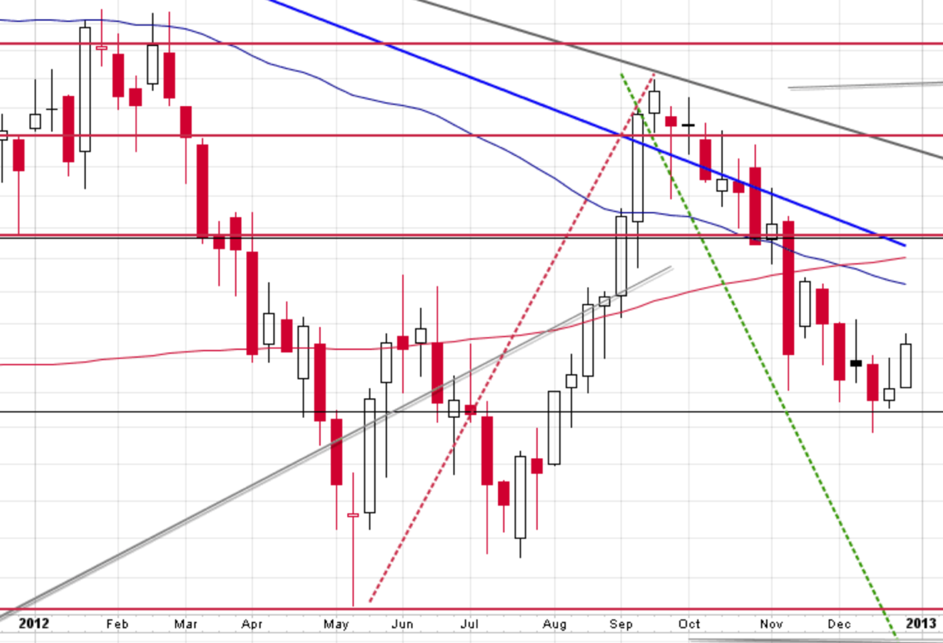
The above gold stock chart continues to highlight how similar the current situation is to what we saw in late 2012. People are very excited by gold miners' gains and the same was the case in 2012. Back then people were practically sure that gold and gold miners are going to move to new highs shortly. We have many investors and analysts thinking the same thing right now. What really followed in the past, was the biggest decline that we saw in the past several decades.
(...) Back in late 2012, the HUI Index moved a bit above its 50% retracement of the preceding decline before the top was formed. The analogous retracement is currently at about 208.
(...) Why is the situation likely to repeat itself? Because this is what generally tends to happen in the market. Not every time, but often enough to make it worth one's while to look for the similarities. The more similar the moves are, the more likely it is that the follow-up action will be similar as well. Please note that the shape of the 2018 - now rally is also similar to the one that we saw in 2012. The entire rally consisted of two parts that were separated by a decline that started from the 200-week moving average (marked with red). The second rally was sharper and bigger than the initial one. We see the same thing right now. In yesterday's first Alert, we emphasized the similarity with regard to volume in silver - the late-2012 top was one of the cases that were similar to the current situation.
Of course, just as it was the case in late 2012, we now have multiple analysts and investors that are convinced that the entire precious metals market is taking off to new highs. But will this really be the case? We doubt it.
(...) please consider the current breakout above 200 and how similar it is to the early 2016 breakdownbelow the 100 level. Both numbers are very round, and in both cases, gold miners moved to new extremes even though gold didn't. In 2016 the fake breakdown meant the start of the biggest rally in years. With the current strength, are we about to see the biggest decline in years? This appears very likely, also based on silver's outperformance and SLV's epic volume that we discussed [previously].
The rally is now practically just as big as it was in the late 2012 - naturally in relative terms. The HUI Index is slightly above the 50% Fibonacci retracement, not yet at the 61.8% retracement, and a bit below the previous highs. In this case, these are the 2017 highs, and in the past, these were the early 2012 highs.
Before moving to silver, let's keep in might that the late-2012 top was immediately followed by a decline that gave way to a quick comeback, so it's not that surprising that we saw this kind of performance last week.
If the situation is playing out practically exactly as it had played out at the top that was followed by the biggest decline in the past few decades, then how can it be bullish? Last week's late rally was not a break from the 2012-now similarity - it was its confirmation.
Please note that the week that followed the first week of the decline that was reversed, was the time when the HUI Index moved a bit higher (not above the previous high, though) and then closed the week without practically any change. Based on gold's pre-market upswing, it seems that we may see something similar also this time.
Having said that, let's take a look at silver's long-term chart. There are no changes on it, but the implications are too important not to discuss them.
Does Silver Concur?
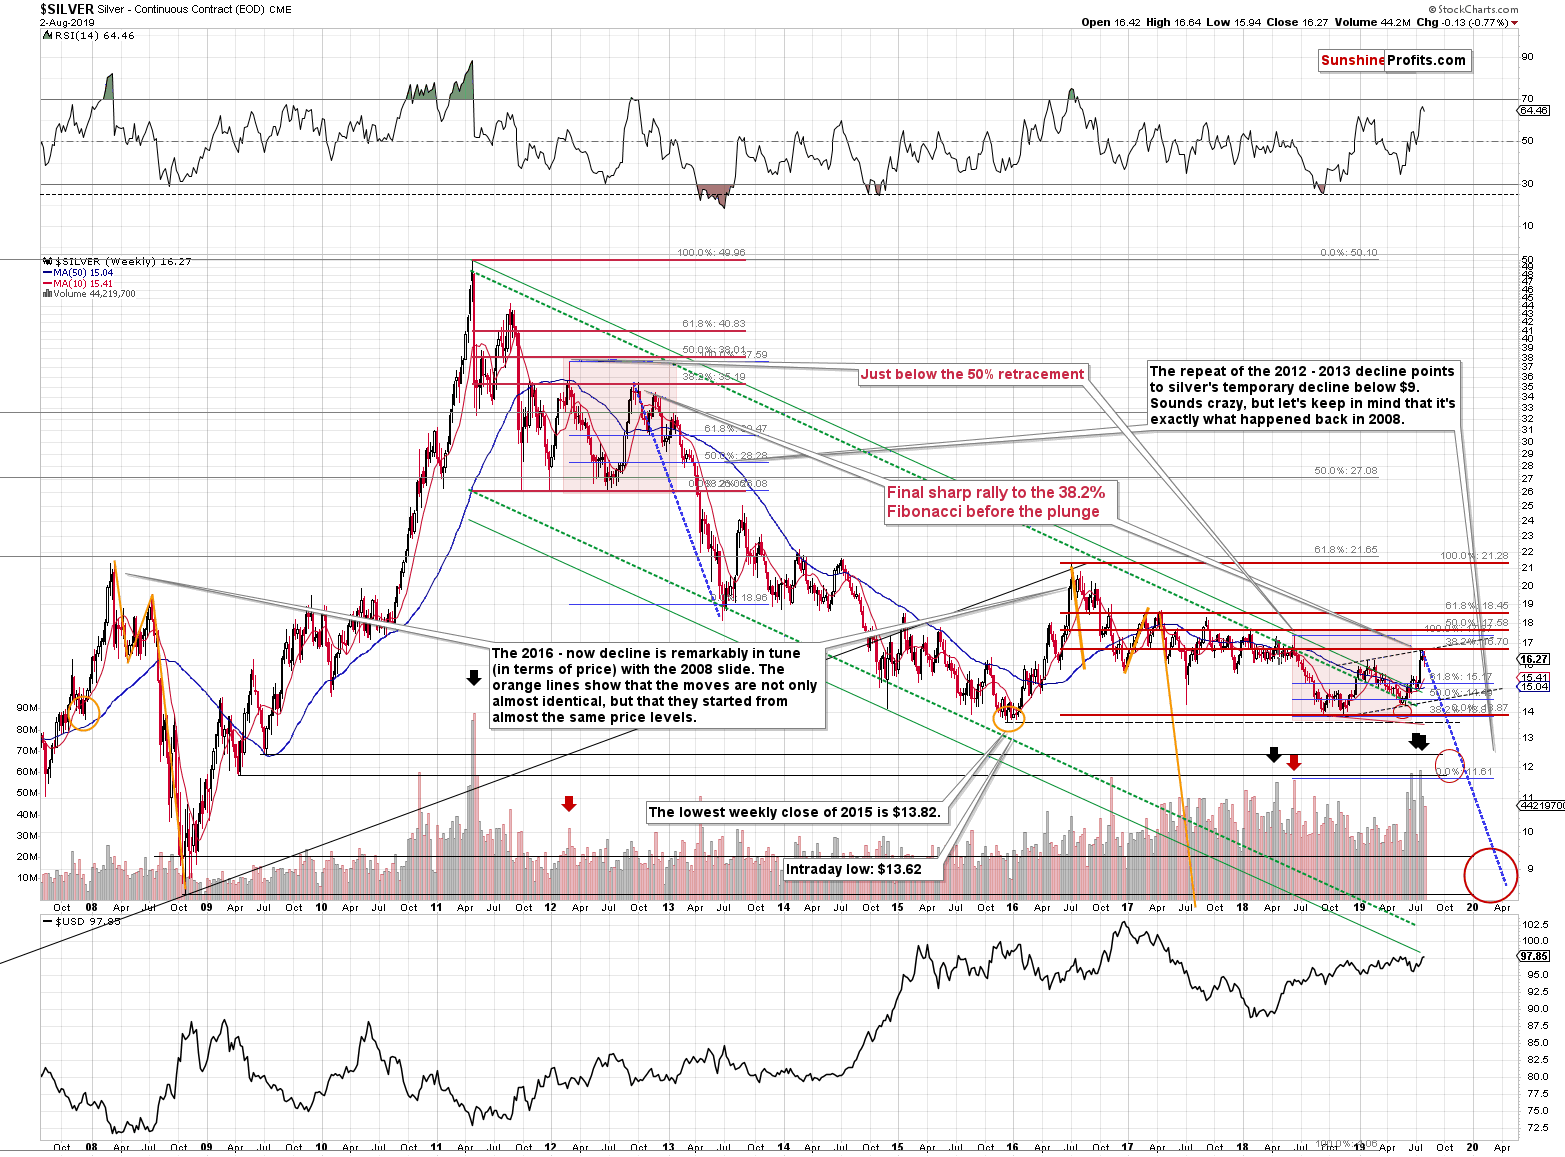
There is actually much more to the silver story than just a breakout above the recent highs. In fact, the breakout itself is not that important. What is important, is the resistance that was just reached and how it relates to what we saw in the past.
By "resistance" we actually mean two resistance levels. One is created based on the line that's parallel to the rising support line created by connecting the 2018 and 2019 bottoms. Copying this line and moving it higher so that it touches the early 2019 high creates the upper border of the rising trend channel. This is silver's second move higher and the "C" part of a rising ABC correction pattern (the late-2018 - early-2019 rally was the "A" part of the move and the subsequent decline was "B"). The ABC corrections (a.k.a. zigzags) are relatively common corrective patterns that don't change the preceding trend. In this case, the trend was down.
We can speak of the big downtrend that started in 2011, or we can speak of the more medium-term downtrend that started in 2016 - either way, the corrective ABC pattern seems to have already run its course as silver moved to the upper border of the trend channel.
There is also additional reason for silver to turn south from the current price levels that's even more important. Taking the 2016 top as the starting price for the decline and using the 2018 bottom as the final (so far) bottom, we get $16.70 as the 38.2% Fibonacci retracement. This is a good reason on its own for silver to turn around, especially if we also consider the fact that silver moved to the above-mentioned upper border of the trade channel.
The extremely bearish outlook comes from something else, though. There are many things that emphasize that the outlook is extremely bearish (such as the recent volume readings in silver and silver stocks), but with regard to the price level that was reached recently, there is one more very important detail that most investors will likely miss.
The entire 2016 - now situation and the 2011 - late-2012 price movement are very similar.
In both cases there were actually four bottoms at very similar price levels that preceded the final upswing and the first one of them was very sharp (late 2011 and mid-2017). The timing between the following bottoms was different, but there are two major similarities that just can't be ignored or left unmentioned.
The first thing is that all major tops were lower than the previous ones. The only outlier is the early-2019 top, which - as it turned out - wasn't the final top for the rally, so overall it seems that the analogy remains intact.
The second thing is that the top (the one in early 2012) that preceded the final top of the consolidation is extremely similar to the mid-2018 one and this an extremely useful roadmap sign that tells us where silver is in light of the entire analogy.
The key thing is that the final pre-slide (late-2012) top formed at the 38.2% Fibonacci retracement level based on the preceding decline. The early 2012 top formed slightly below the 50% retracement (intraday high) and the weekly close was a bit below the 38.2% retracement. The mid-2018 top (analogous to the late-2012 one) also formed a bit below the 50% retracement and the weekly close of that top was a bit below the 38.2% retracement.
This means that if the analogy remains intact, silver should top at the 38.2% retracement right now, which is at $16.70. And what was silver's recent high? $16.68 - almost exactly the level of the retracement.
Let's keep in mind that the trade-war tensions are negative for the world economy and the U.S. stock market. This means that the industrial commodities (and silver definitely plays a very important industrial role) and assets that are connected to the stock market (like mining stocks) will be affected negatively. This is likely to dampen the safe-haven demand for silver and mining stocks that might push gold higher from the current levels.
USD Index Hints at Short-Term Headwinds
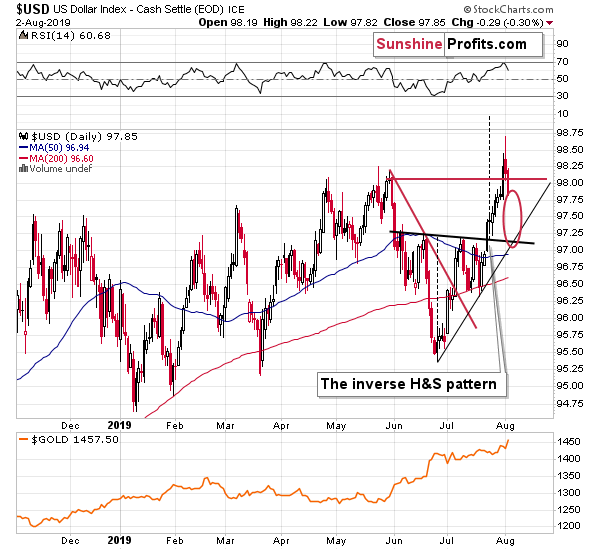
The situation on the USD Index suggests that gold might really show some strength. The USD invalidated the breakout above the previous highs, which doesn't change the bullish outlook for the medium term, but could pose a challenge in the very near term. It is possible that the USD will make another attempt to move higher, as it did in late May, but it's also possible that it will decline to the combination of the rising support line and the previously broken neck level of the inverse head-and-shoulders pattern. This could correspond to gold's attempt to break above $1,500, or it could result in gold moving to the late April 2013 high of $1,487.
Summary
Summing up, the medium-term outlook in gold, silver, and mining stocks remains down, but it could be the case that gold moves higher in the very short run, attempting to rally to $1,500. Consequently, we are temporarily closing the short position in gold with the plan to re-enter it at higher prices. We are not closing the positions in silver and mining stocks, as they are likely to be affected by the trade-war scare to a smaller extent.
As always, we'll keep you - our subscribers - informed.
To summarize:
Trading capital (supplementary part of the portfolio; our opinion): Full short position (250% of the full position) in silver, and mining stocks are justified from the risk/reward perspective with the following stop-loss orders and exit profit-take price levels:
- Silver: profit-take exit price: $13.81; stop-loss: $16.83; initial target price for the DSLV ETN: $39.08; stop-loss for the DSLV ETN $22.57
- Mining stocks (price levels for the GDX ETF): profit-take exit price: $17.61; stop-loss: $29.27; initial target price for the DUST ETF: $32.28; stop-loss for the DUST ETF $6.88
In case one wants to bet on junior mining stocks' prices (we do not suggest doing so - we think senior mining stocks are more predictable in the case of short-term trades - if one wants to do it anyway, we provide the details), here are the stop-loss details and target prices:
- GDXJ ETF: profit-take exit price: $23.71; stop-loss: $43.47
- JDST ETF: profit-take exit price: $73.32 stop-loss: $13.87
Long-term capital (core part of the portfolio; our opinion): No positions (in other words: cash)
Insurance capital (core part of the portfolio; our opinion): Full position
Whether you already subscribed or not, we encourage you to find out how to make the most of our alerts and read our replies to the most common alert-and-gold-trading-related-questions.
Please note that the in the trading section we describe the situation for the day that the alert is posted. In other words, it we are writing about a speculative position, it means that it is up-to-date on the day it was posted. We are also featuring the initial target prices, so that you can decide whether keeping a position on a given day is something that is in tune with your approach (some moves are too small for medium-term traders and some might appear too big for day-traders).
Plus, you might want to read why our stop-loss orders are usually relatively far from the current price.
Please note that a full position doesn't mean using all of the capital for a given trade. You will find details on our thoughts on gold portfolio structuring in the Key Insights section on our website.
As a reminder - "initial target price" means exactly that - an "initial" one, it's not a price level at which we suggest closing positions. If this becomes the case (like it did in the previous trade) we will refer to these levels as levels of exit orders (exactly as we've done previously). Stop-loss levels, however, are naturally not "initial", but something that, in our opinion, might be entered as an order.
Since it is impossible to synchronize target prices and stop-loss levels for all the ETFs and ETNs with the main markets that we provide these levels for (gold, silver and mining stocks - the GDX ETF), the stop-loss levels and target prices for other ETNs and ETF (among other: UGLD, DGLD, USLV, DSLV, NUGT, DUST, JNUG, JDST) are provided as supplementary, and not as "final". This means that if a stop-loss or a target level is reached for any of the "additional instruments" (DGLD for instance), but not for the "main instrument" (gold in this case), we will view positions in both gold and DGLD as still open and the stop-loss for DGLD would have to be moved lower. On the other hand, if gold moves to a stop-loss level but DGLD doesn't, then we will view both positions (in gold and DGLD) as closed. In other words, since it's not possible to be 100% certain that each related instrument moves to a given level when the underlying instrument does, we can't provide levels that would be binding. The levels that we do provide are our best estimate of the levels that will correspond to the levels in the underlying assets, but it will be the underlying assets that one will need to focus on regarding the signs pointing to closing a given position or keeping it open. We might adjust the levels in the "additional instruments" without adjusting the levels in the "main instruments", which will simply mean that we have improved our estimation of these levels, not that we changed our outlook on the markets. We are already working on a tool that would update these levels on a daily basis for the most popular ETFs, ETNs and individual mining stocks.
Our preferred ways to invest in and to trade gold along with the reasoning can be found in the how to buy gold section. Additionally, our preferred ETFs and ETNs can be found in our Gold & Silver ETF Ranking.
As a reminder, Gold & Silver Trading Alerts are posted before or on each trading day (we usually post them before the opening bell, but we don't promise doing that each day). If there's anything urgent, we will send you an additional small alert before posting the main one.
=====
Latest Free Trading Alerts:
Trump's tariff threat hasn't served oil prices well. They folded like a cheap suit. While they're rebounding today, the decline could very well be far from over. How likely is that? Let's find out.
Sliding Oil on Tariff Threats Equals More Profits
=====
Thank you.
Sincerely,
Przemyslaw Radomski, CFA
Editor-in-chief, Gold & Silver Fund Manager

