

The U.S. stock market indexes 0.3-1.0% on Friday, retracing their Thursday's advance, as investors' sentiment worsened following economic data releases, trade war fears. The S&P 500 index fell over 200 points from its previous Friday's record high of 3,027.98 a week ago on Monday. Then it retraced almost 120 points of that sell-off. The Dow Jones Industrial Average lost 0.3% and the Nasdaq Composite lost 1.0% on Friday.
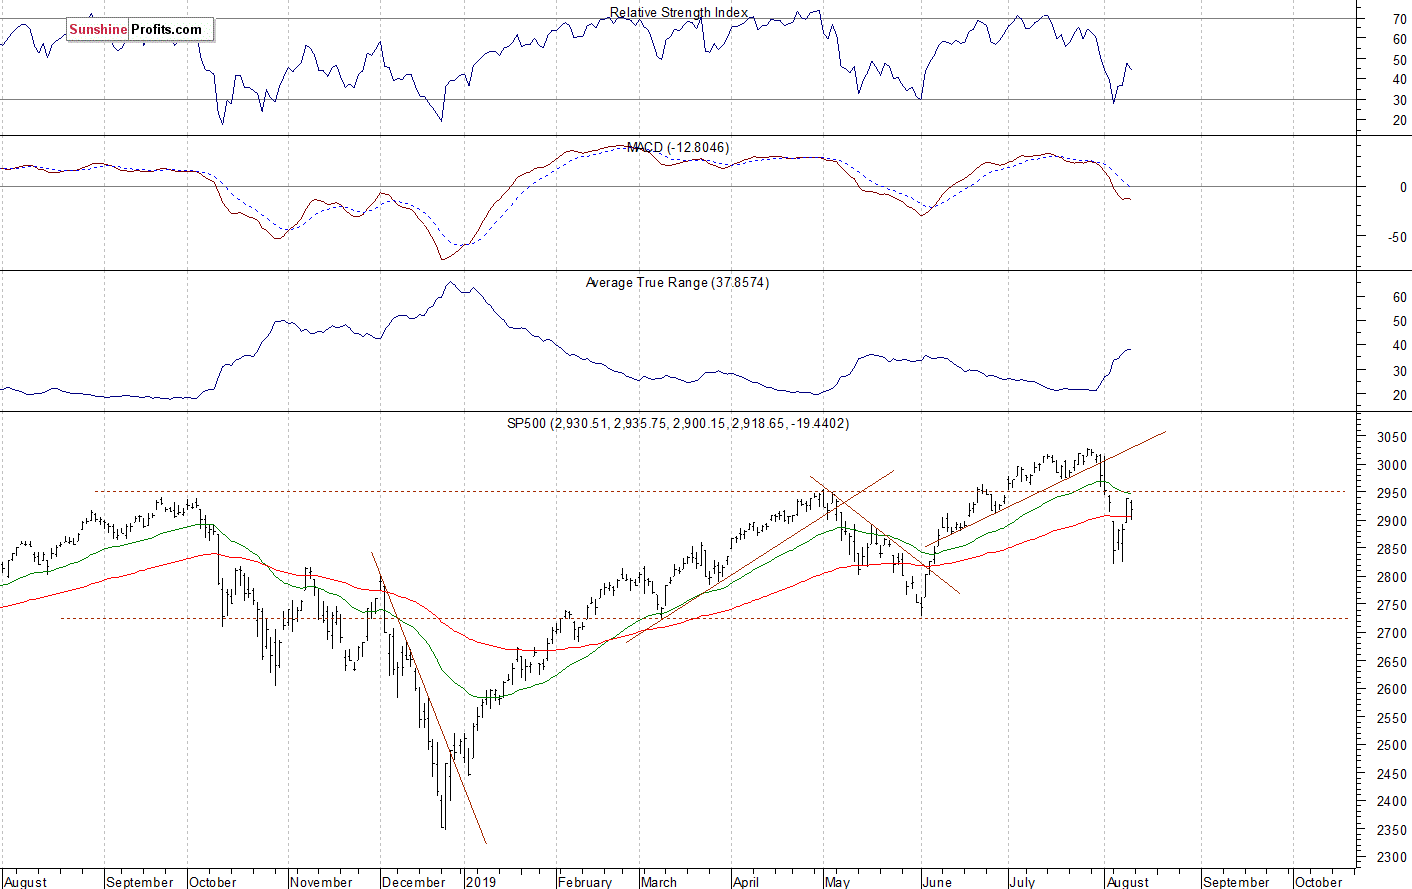
The nearest important resistance level of the S&P 500 index remains at around 2,945-2,950, marked by some previous daily low and daily high. The resistance level is also at 2,980-3,000. On the other hand, the support level is at 2,890-2,900, marked by Thursday's daily gap up of 2,892.17-2,894.47.
The broad stock market broke below its two-month-long upward trend line recently, and then it quickly retraced most of the June-July advance. The S&P 500 index remains below the previous medium-term local highs. For now, it looks like a consolidation following the January-February advance. However, it could also play out as a long-term topping pattern ahead of a more meaningful downward correction:
Negative Expectations Again
The index futures contracts trade 0.8% below their Friday's closing prices. So expectations before the opening of today's trading session are negative. The European stock market indexes have lost 0.2-0.5% so far. There will be no new important economic data releases today.
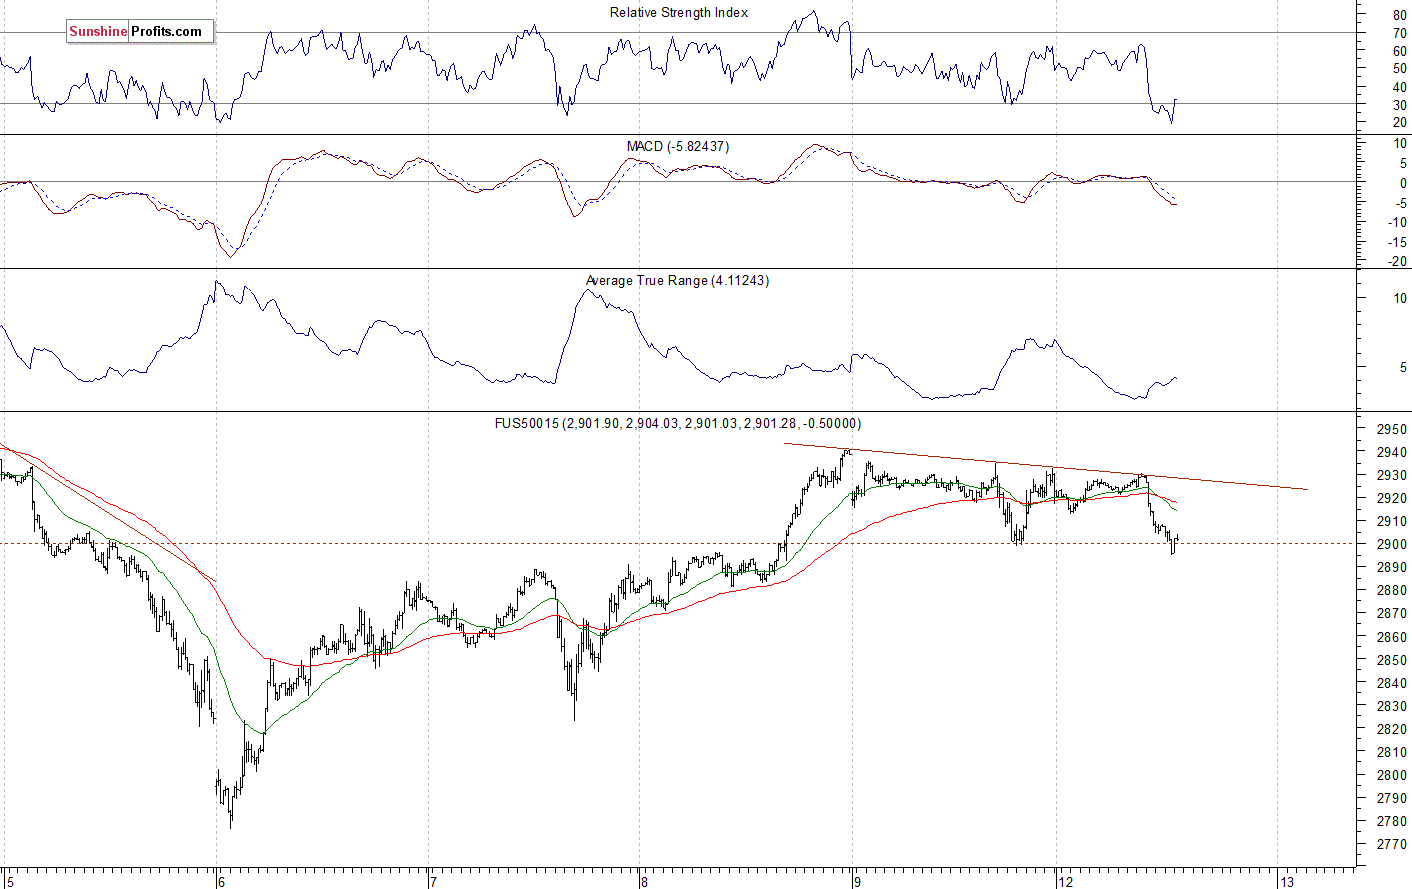
The S&P 500 futures contract trades within an intraday downtrend, as it retraces its Friday's intraday advance. The nearest important resistance level remains at 2,925-2,930, marked by the short-term local highs. On the other hand, the support level is at 2,890-2,900. The futures contract trades along the 2,900 mark this morning, as we can see on the 15-minute chart:
Nasdaq 100 Also Lower
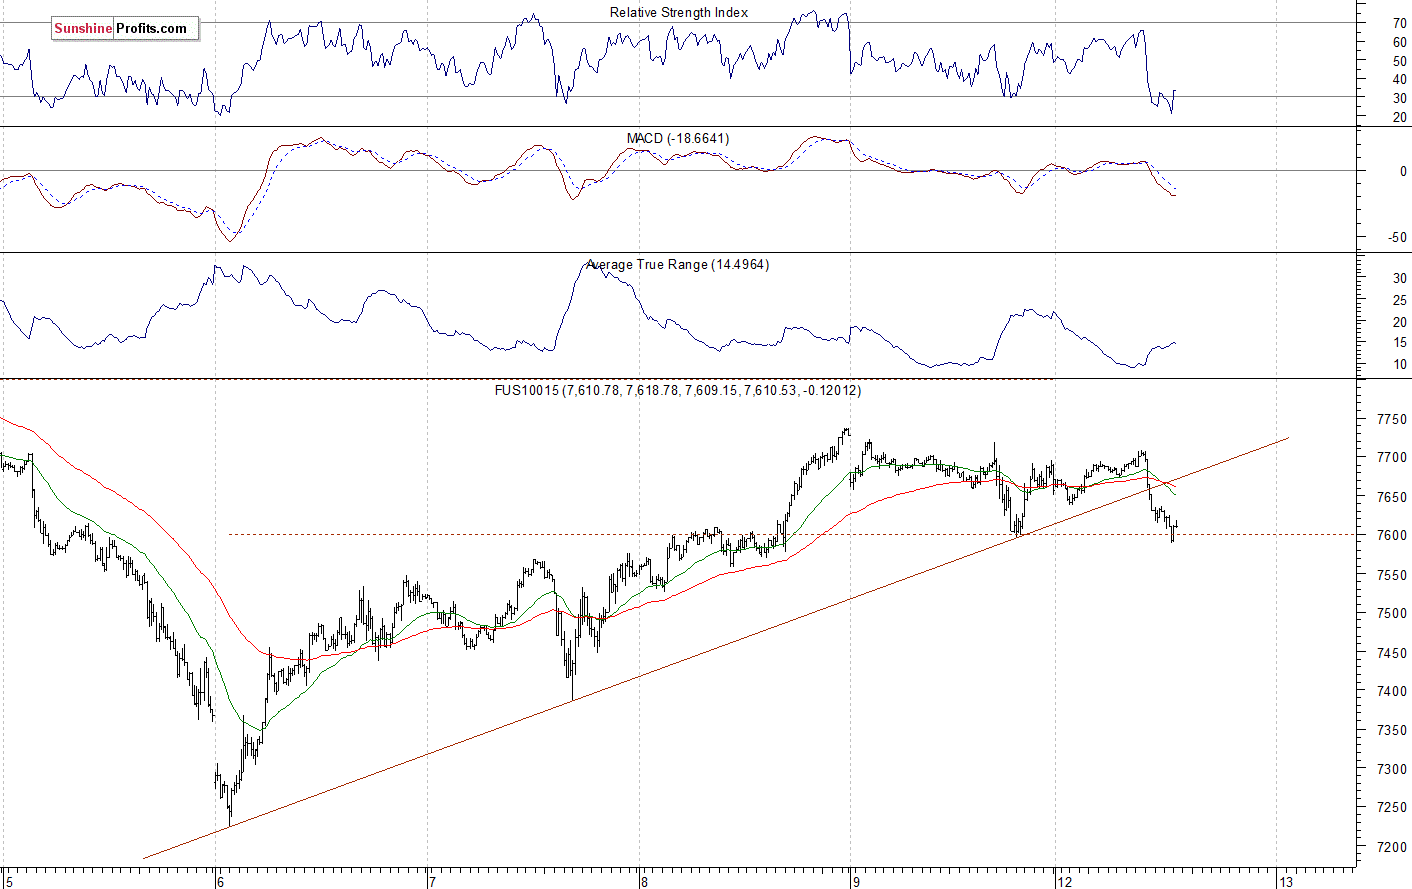
The technology Nasdaq 100 futures contract follows a similar path, as it trades within an intraday downtrend. It is closer to the 7,600 mark again. The nearest important resistance level is now at 7,700. On the other hand, the support level is at 7,550-7,600. The Nasdaq futures contract broke below its week-long upward trend line today, as the 15-minute chart shows:
Apple, Microsoft - Short-Term Uncertainty Following Rebound
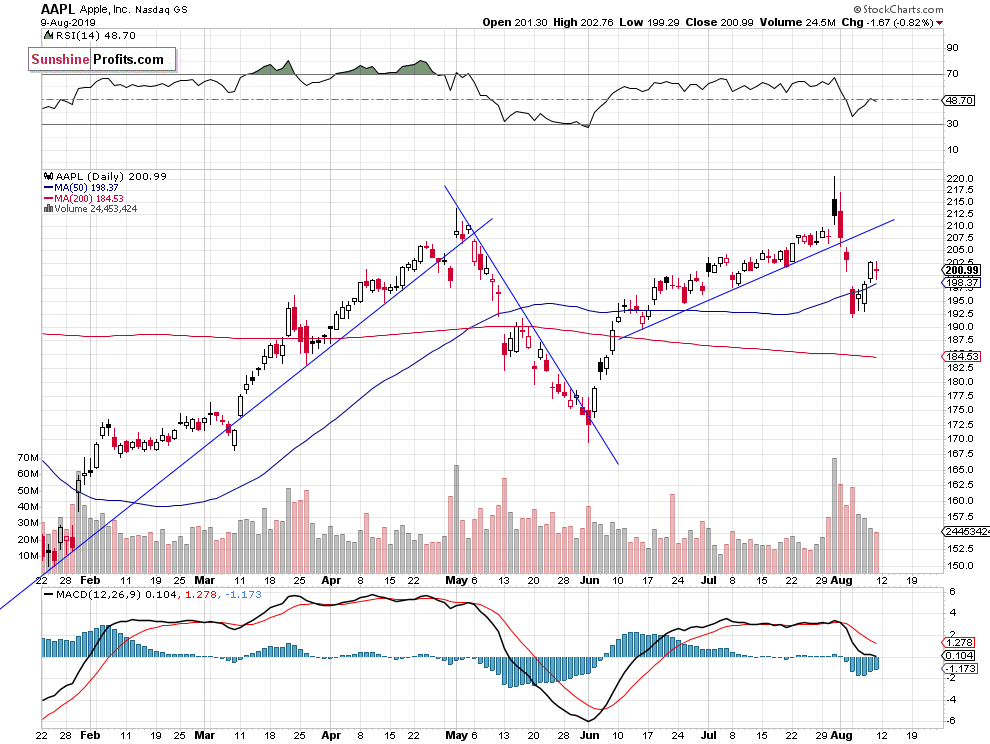
Let's take a look at the Apple, Inc. stock (AAPL) daily chart (chart courtesy of http://stockcharts.com). The stock continued to trade at the resistance level of $210-215 recently. It broke above the early May local high following quarterly earnings release. However, the market reversed downwards off its new medium-term high and then it broke below the upward trend line. On Thursday it got back above $200 price, as it retraced some of the sell-off:
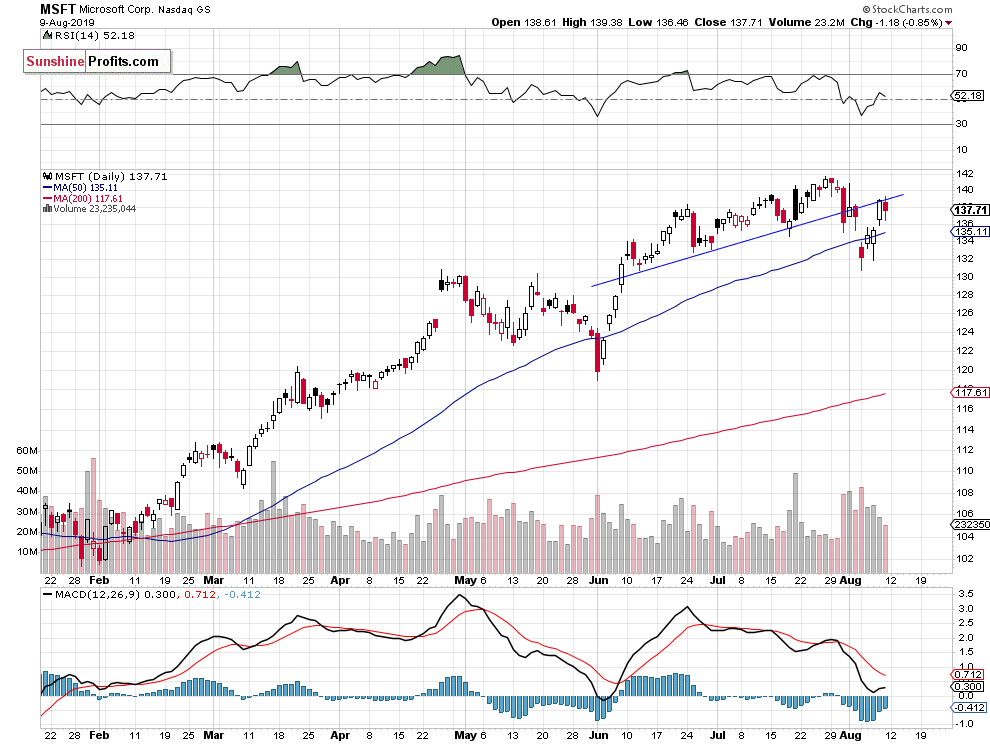
Now let's take a look at the daily chart of Microsoft Corp. stock (MSFT). The stock reached the new record high of $141.68 in the late July following quarterly earnings release. But recently it retraced most of the advance and it broke below the two-month-long upward trend line. On last Monday it accelerated lower. However, on Thursday and on Friday the price retraced some more of the decline and it got back to the broken trend line:
Dow Jones - New Uptrend or Just Upward Correction?
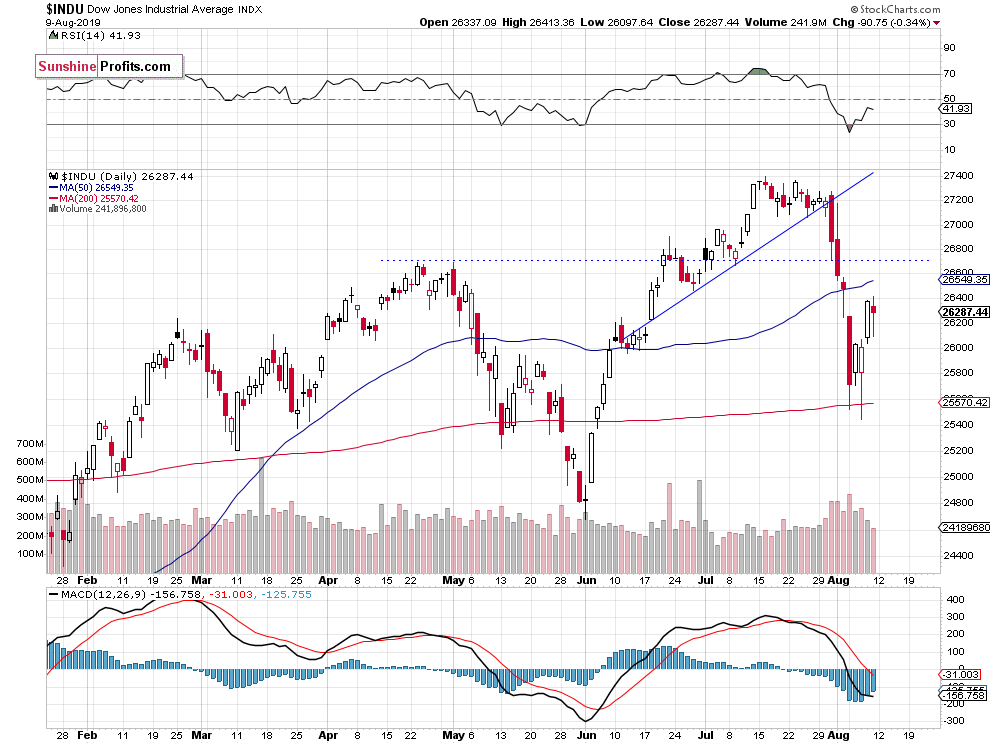
The Dow Jones Industrial Average broke below its upward trend line recently. So the second half of July consolidation was a topping pattern. Then the market broke below the previous medium-term high and last week it came back below the 26,000 mark. There we saw short-term oversold conditions. And the index bounced off its 200-day moving average:
The S&P 500 index broke below the upward trend line recently, as investors reacted to the Fed's Rate Decision release, among other factors. We saw technical overbought conditions along with negative technical divergences recently. And the market turned lower. Then it accelerated the downtrend following renewed trade war fears. The market reversed its downtrend on Wednesday and on Thursday it accelerated higher following breaking above the 2,900 mark. However, it still looks like a correction within a downtrend.
Concluding, the S&P 500 index will likely open lower today. The market may continue to fluctuate following its recent sell-off.
If you enjoyed the above analysis and would like to receive free follow-ups, we encourage you to sign up for our daily newsletter - it's free and if you don't like it, you can unsubscribe with just 2 clicks. If you sign up today, you'll also get 7 days of free access to our premium daily Gold & Silver Trading Alerts. Sign up today!
Thank you.
Paul Rejczak
Stock Trading Strategist
Sunshine Profits - Effective Investments through Diligence and Care
