Briefly: in our opinion, full (200% of the regular size of the position) speculative short positions in gold, silver and mining stocks are justified from the risk/reward perspective at the moment of publishing this alert.
Silver soared, while gold and mining stocks moved higher and reached new monthly highs. All that despite a move higher in the USD Index. It seems to be a clear bullish combination for the PMs. Moon appears to be at hand. Is it the last chance to jump into the precious metals market with both feet?
It may be, but only if one means taking on a short position.
What?! After PMs soared along with the USD?!
Yes. First of all PMs didn’t soar. The move higher in gold and mining stocks was once again relatively small and it was more visible only in case of silver. We discussed how bearish it is that we’re seeing silver’s outperformance many times in the previous days, so we don’t want to go into this issue once again today. Instead, let’s focus on other factors: gold’s move higher along with USD’s move higher and silver breaking above its medium-term resistance line. But, before moving to the above, let’s take a look at the key 3 parts of the precious metals market at the same time.
Relative Valuations
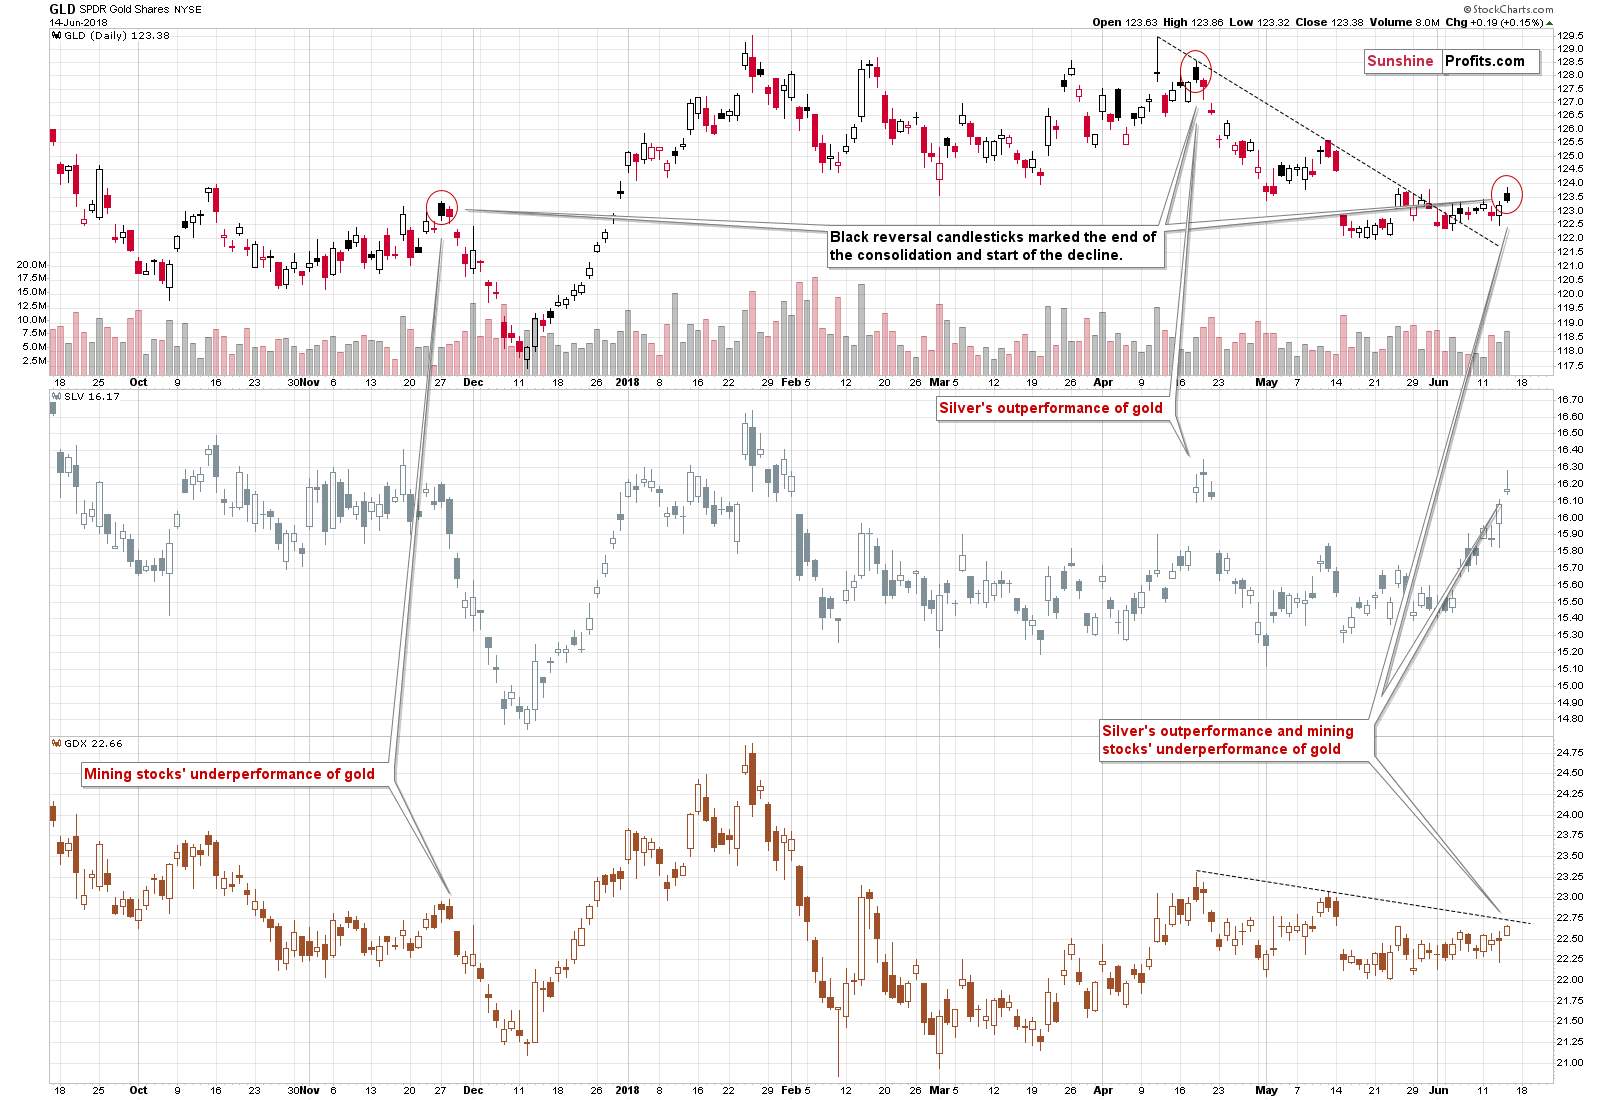
Please forget for a moment what happened yesterday and on Wednesday, what the monetary announcements were and how much USD rallied. Looking at the bottom part of the above chart, do you notice anything special? No? Exactly. The move in the mining stocks was nothing special – it was well in tune with the regular, boring, back-and-forth movement that we’ve been seeing for about a month. Even though GLD is days after its breakout above the declining short-term resistance line, GDX didn’t even reach it.
Silver, on the other hand, is clearly showing strength relative to gold. While we don’t want to discuss it again per se, we do want to mention it in the light of the specific nature of the session that we just saw in both: GLD and SLV.
GLD formed a black reversal candlestick on relatively big volume (biggest seen this month) after a prolonged sideways trading period. We marked analogous situations with red ellipses and, as you can see, both similar cases were followed by declines.
SLV’s candlestick is quite obvious to interpret – it was a reversal in the form of a “gravestone doji” pattern. It’s not visible on the above chart, but it was confirmed by huge volume, so the implications are really bearish.
Ok, buy why are you featuring all three parts of the PM market on the same chart?
Because the above-mentioned factors are not only bearish on their own – they actually confirm each other as both cases what we marked based on GLD’s candlestick pattern were accompanied by specific developments. The November 2017 bearish case was confirmed by weak mining stocks and the April 2018 bearish case was confirmed by temporarily strong silver.
We currently have both confirmations at play: strong silver and weak miners. Plus, we just saw reversals in GLD and SLV on big volume. The implications are very bearish, not bullish as one might think after just noticing that gold, silver and mining stocks ended the session higher. They did, but how they performed and what was the context for this move makes all the difference.
Metals’ Volume Confirmations
ETFs are one way to look at the precious metals sector and the volumes in them are usually important, but if there was no confirmation coming from the futures markets, we would have doubts regarding the above-mentioned signals. In particular, reversals would become doubtful if they were not accompanied by big volume also in case of gold- and silver futures.
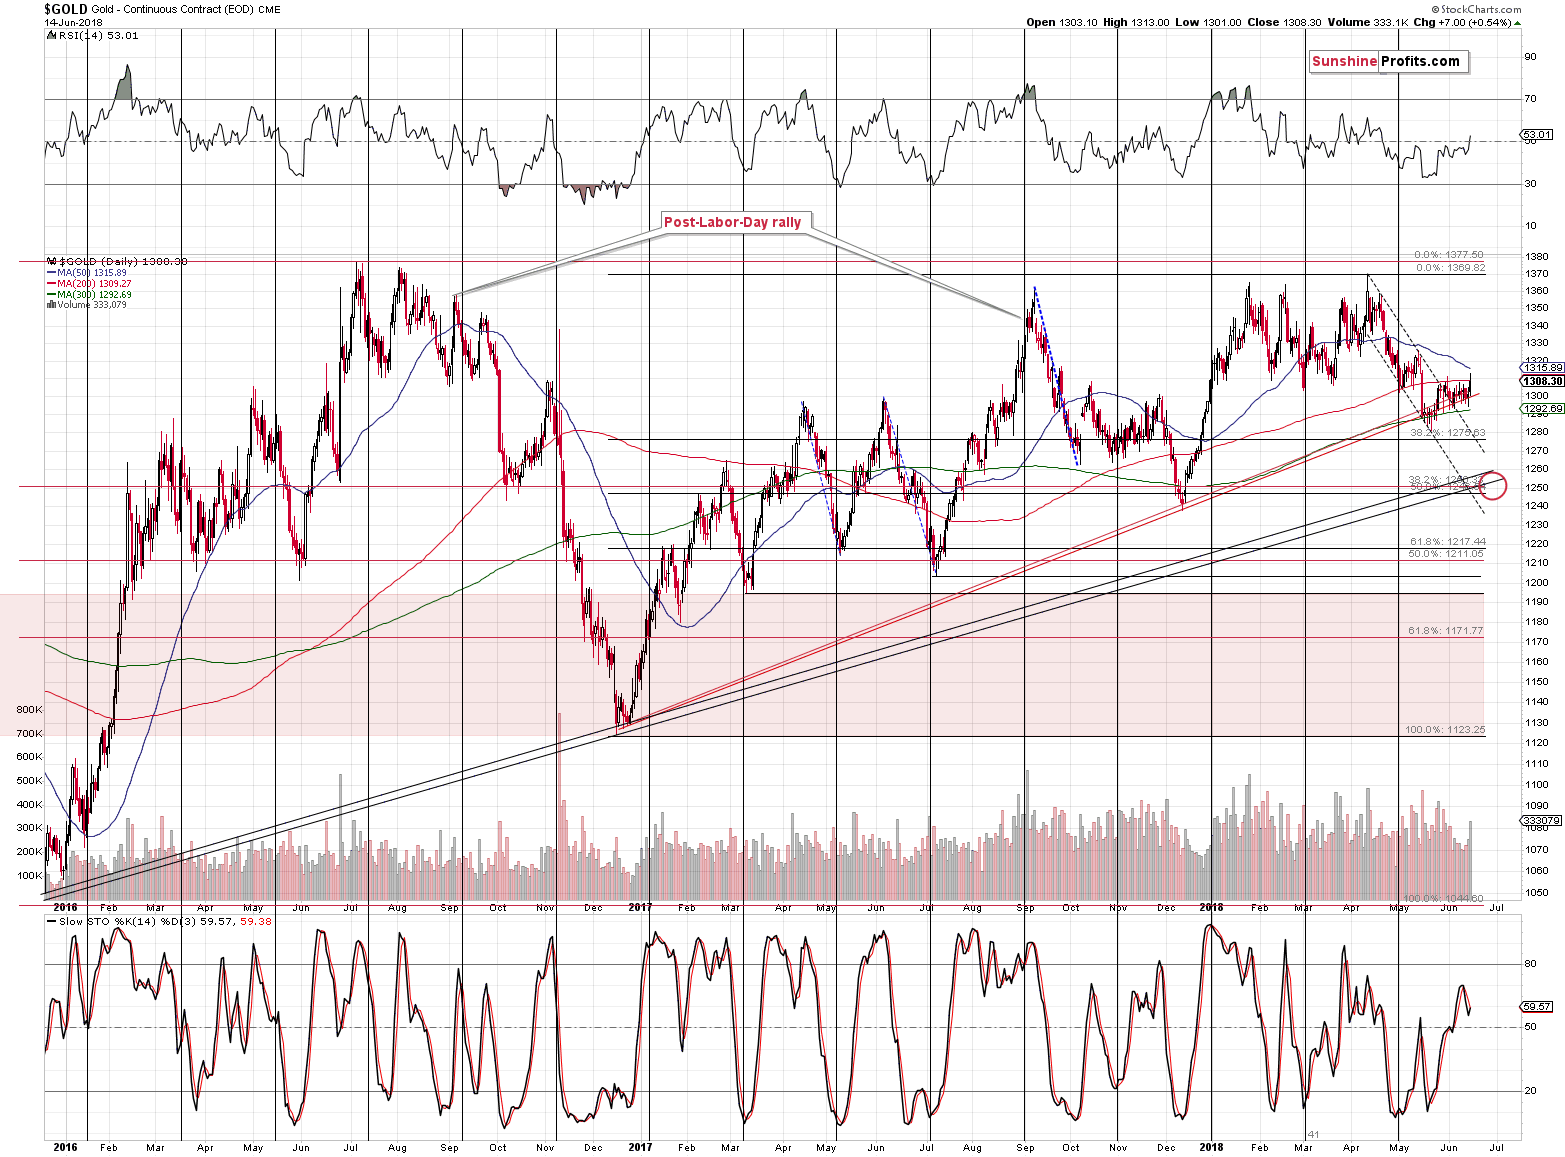
We have confirmations from both markets, so the reversals seem valid and so do the bearish implications. Interestingly, the futures’ sessions didn’t take forms of bearish reversals, but it seems that the US markets might be representative here as gold is already back below $1,300 ($1,297) at the moment of writing these words.
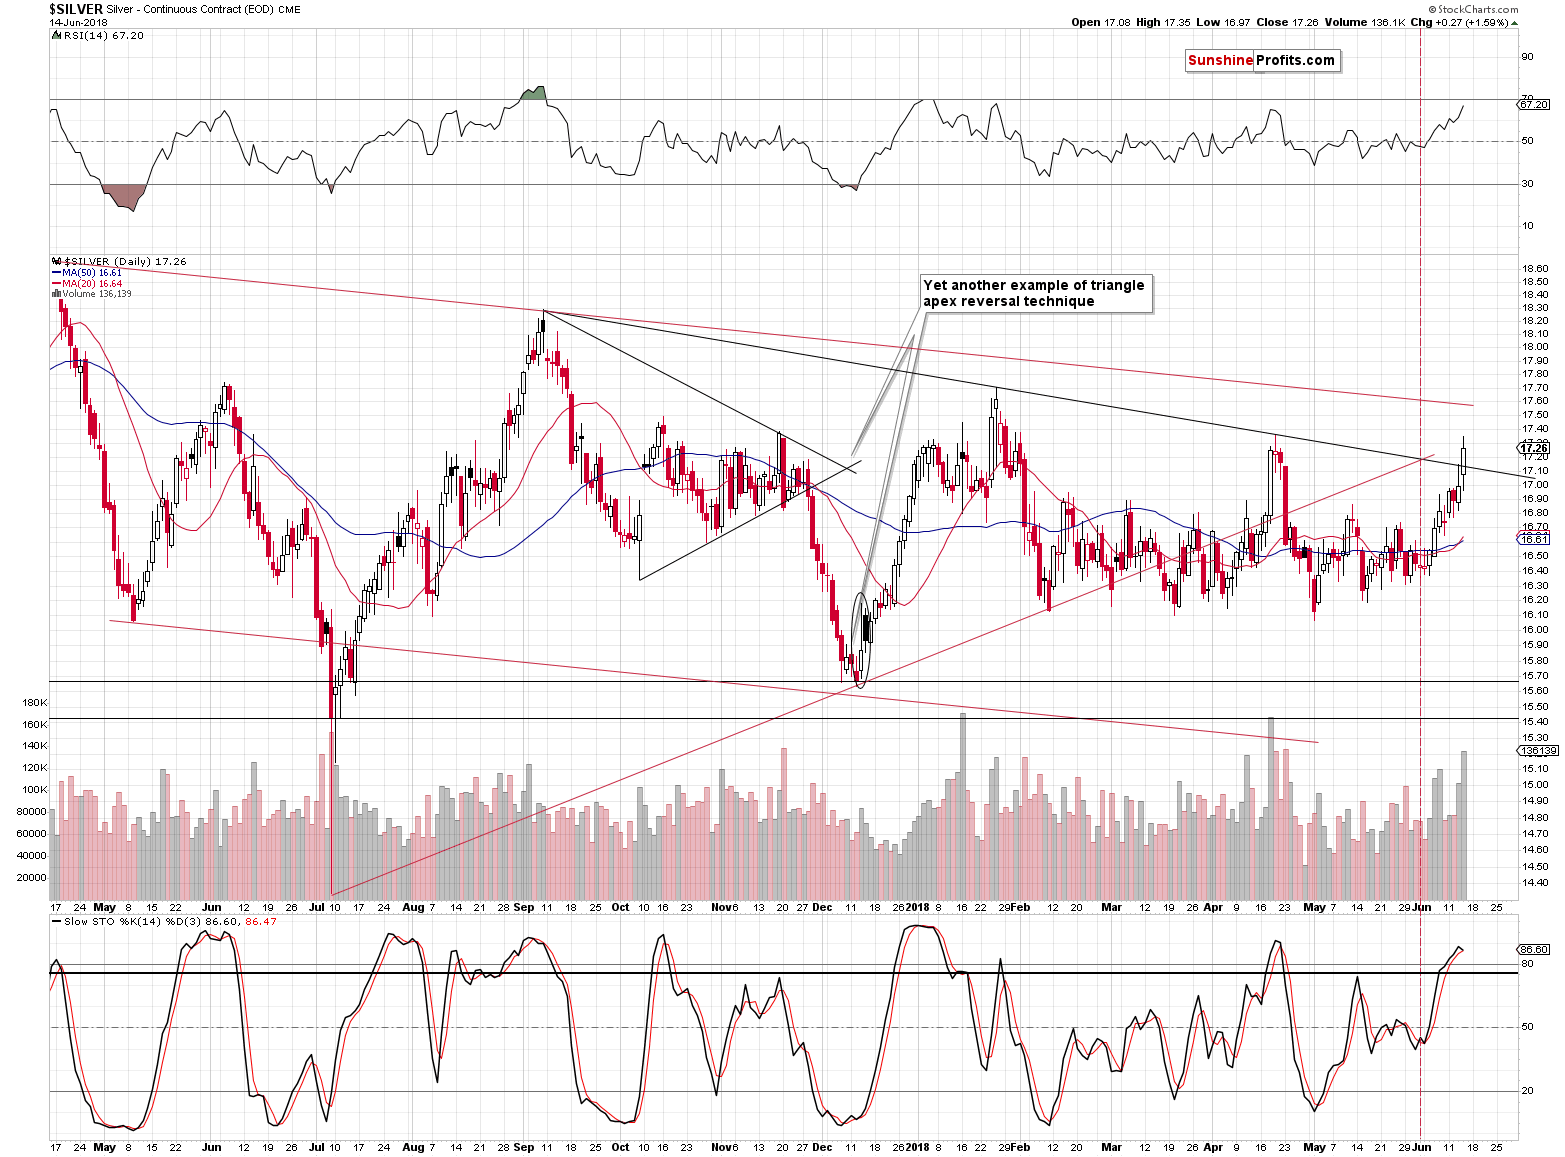
Silver is at $17.14, so there was no invalidation yet, but it strongly seems that putting “yet” in bold is justified. In yesterday’s alert, we commented on the above chart in the following way:
Silver moved higher once again and this time it reached its declining, medium-term resistance line. Does this mean that the rally is over? It could, but let’s keep in mind that silver is known for fake breakouts, so a move above this line could also be seen. In fact, today’s pre-market rally took silver several cents above yesterday’s high, which fits the above. At this point it’s imperative to keep in mind that silver breakouts – if they are not accompanied by bullish confirmations from gold and miners – are almost certainly fakeouts and excellent opportunities to enter short positions. We already have such positions, so the above doesn’t apply, but the key takeaway is that it’s not a bullish thing.
In light of the observation that we made in the previous section, it’s very likely that silver’s breakout will prove to be a fakeout shortly, likely within the next several hours.
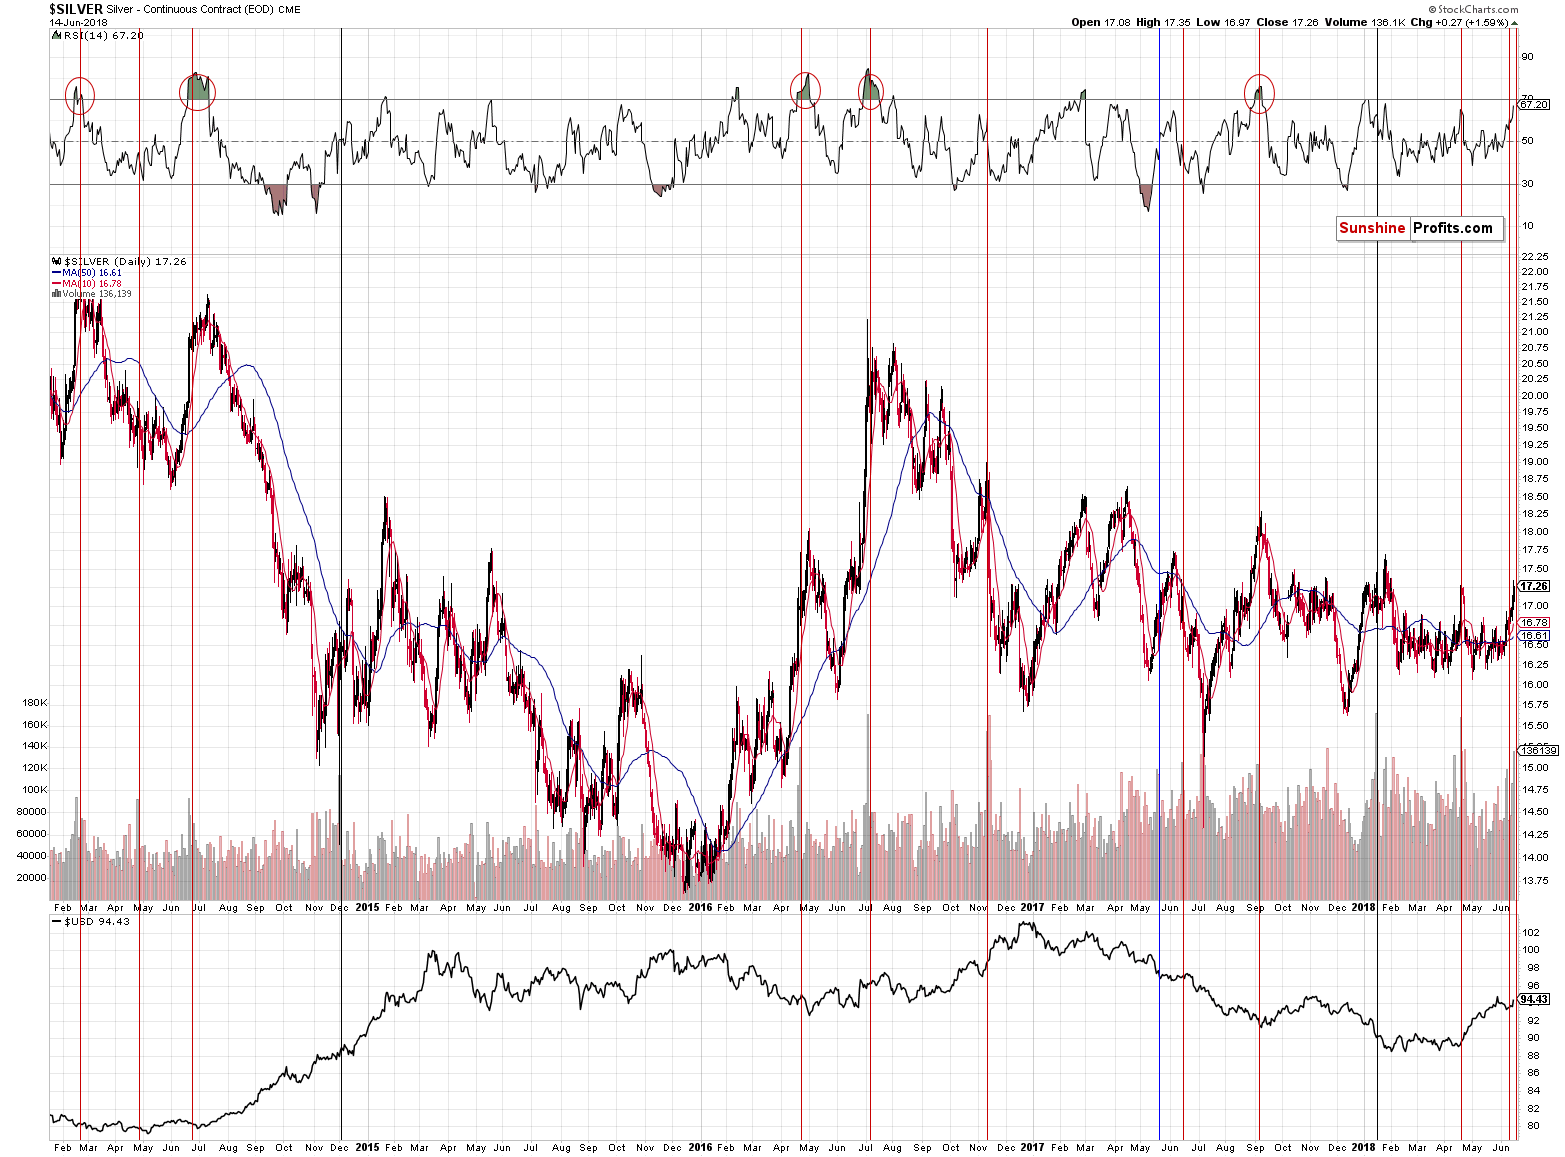
Also, let’s keep in mind that the very bearish implications of silver’s recent upswing on big volume remain in place especially that the signal was just repeated and so do our comments on the above chart:
In 9 out of 12 recent cases, big volume during daily rallies meant excellent shorting opportunities (marked with red). In 2 cases it was unclear whether it was an opportunity to go short or long (marked with black), but in both cases entering a short position at that time and keeping it for about 3 weeks would have been profitable. In the remaining case that we marked with blue, silver moved higher but only for 2 weeks – it declined then and if one simply kept the short position intact, for a few more weeks, they would have made sizable gains.
Overall, the implications of a volume spike during a daily rally are clearly bearish.
Silver to Gold Ratio
On Tuesday, we commented on the silver to gold ratio in the following way:
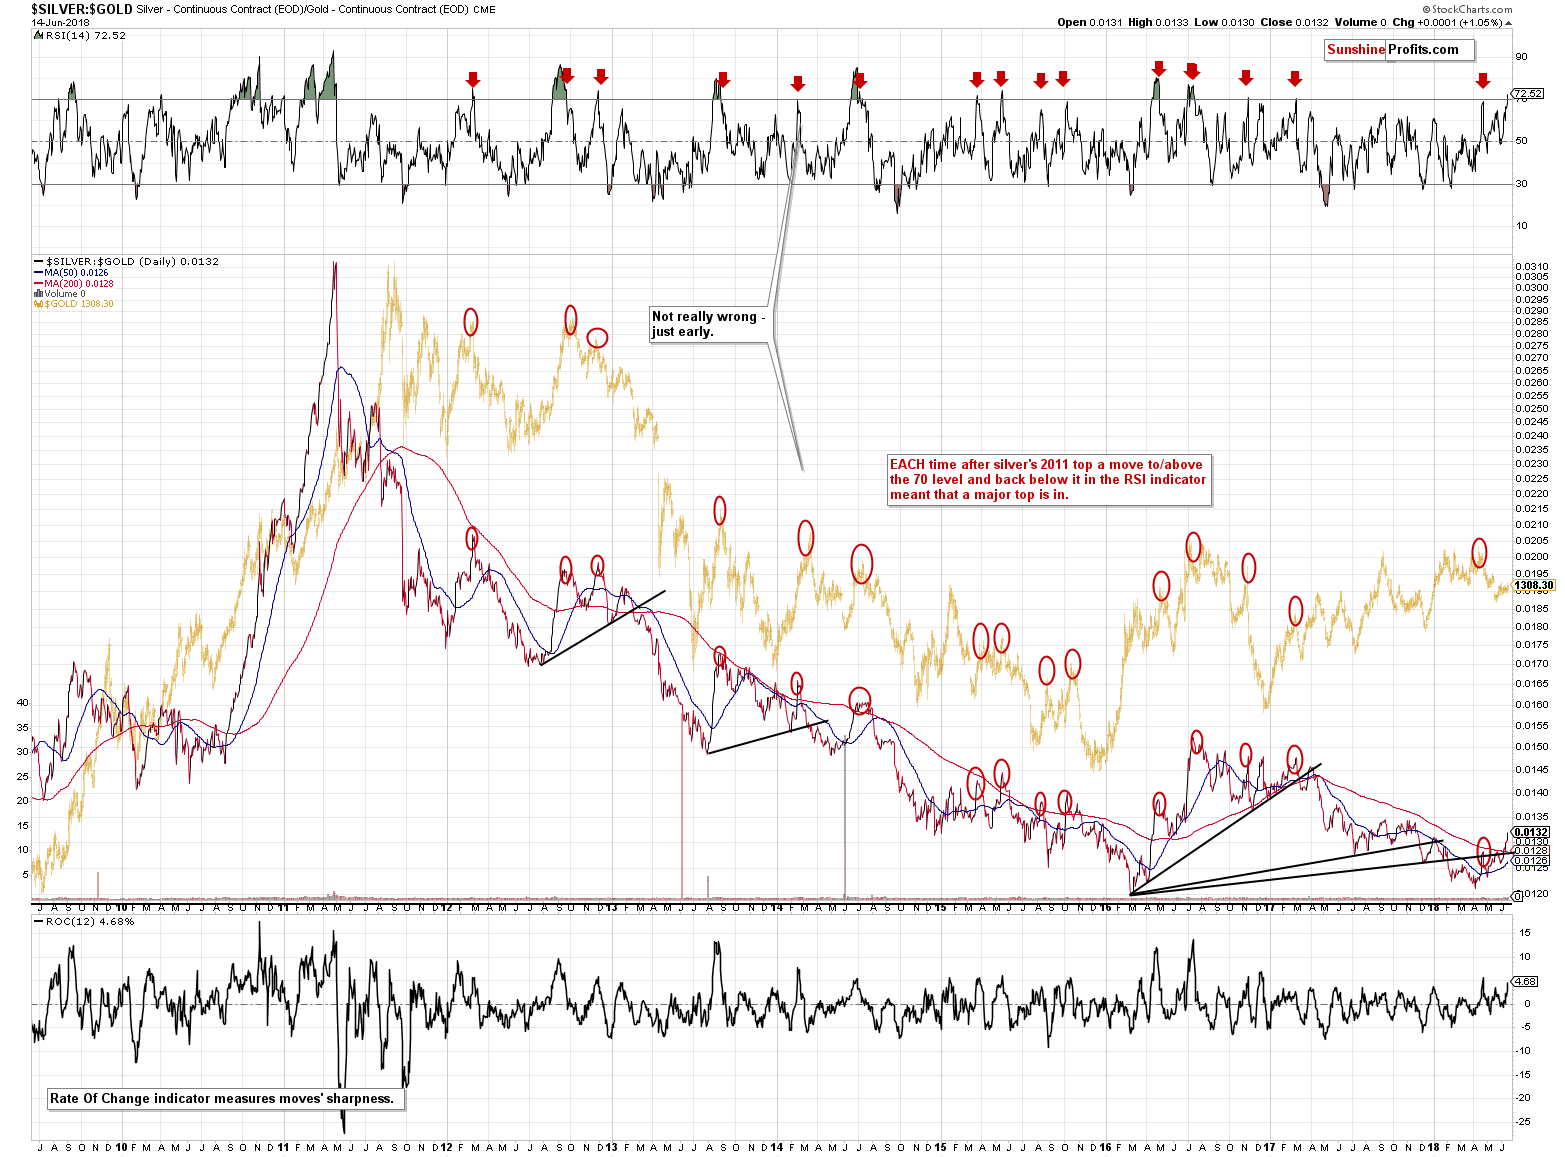
The only thing that we would like to update you on is the silver to gold ratio. Precisely, the RSI indicator that’s based on it. It moved very close to the level of 70, and this level is something that should make silver bulls consider changing their outlook to at least neutral.
The thing is that practically each time that the RSI based on the silver to gold ratio moved above 70 and then back below it meant that the top is in. In many cases (for instance earlier this year), the RSI didn’t even have to move to 70 – its proximity was enough to have bearish implications going forward.
In the April 23rd, 2018 Gold & Silver Trading Alert, we wrote that the short positions were definitely (we had 200% exposure, just like we currently do) justified, while the above RSI was a bit above 69. It turned out that it was the day when the decline accelerated. This may or may not be the case this time because of all the fundamental stuff that’s going on this week (Fed, ECB, BoJ meetings), but the decline is likely to follow shortly anyway.
Based on yesterday’s price action in gold and silver, the RSI moved above 72. That’s the highest it’s been since mid-2016. Back then gold declined over $200 and silver declined by more than $5, so that’s a quite bearish analogy.
The full sell signal will flash when the RSI moves back below 70 again and when it does, the implications will be very straightforward and very important. We marked similar situations with red arrows on the above chart and as you can see, this signal has been extremely effective.
The big-volume signal that we discussed previously along with the SLV reversal both suggest that silver will plunge shortly.This means that we’re likely to get the above-mentioned confirmation from the RSI any day now. While the situation may appear very bullish for silver at the first sight, it’s actually exactly the opposite.
Gold vs. USD
As we mentioned earlier today, the most prominent peculiarity of yesterday’s session was gold’s ability to move higher along with the USD Index. The first thing that we would like to say about the above is that one swallow doesn’t make a summer, especially during a very emotional and news-driven week. If gold continues to show strength along with the USD for at least several more days, it might indicate a change in the overall sentiment. However, since we have several reasons to believe that this was an emotional one-time event (SLV’s big-volume reversal, GLD’s big-volume reversal, silver’s strong outperformance and RSI’s move above 70 in silver to gold ratio), it seems that one shouldn’t give much emphasis to it.
The second thing that needs to be understood is that the relationship between gold and the USD Index is more complex than it appears at the first sight. The USD Index is not necessarily a measure of strength of the US economy or even the trust in the US currency. It’s a good proxy for the latter but not a perfect one. Why? Because it’s a weighted average of currency exchange rates and the biggest component (with over weight over 50%) is the EUR/USD currency pair. The value of a currency pair depends on how investors view two currencies, not one. In this case, the European developments are critical.
We already discussed the above in greater detail on May the 30th and since what we wrote over two weeks ago was based on increased uncertainty regarding the Eurozone, it applies also today (except for the fact that USD was likely to decline back then and it’s likely to rally this time):
The USD Index moved to 94.97, which is practically right at the upper border of our trading area, which means that it could correct now. This should be a bullish trigger for the precious metals market. But will it really be one?
(…)
The most recent strength in the USD Index wasn’t accompanied by gold’s decline, but by a move higher. Gold rallied more visibly in comparison to other currencies, especially in comparison to the euro. This may make you wonder if one should view this as a sign of strength in the yellow metal. Indeed, it would have been the case, if gold was moving higher despite the strength of the US currency. But, it wasn’t essentially the strength of the US currency, but the weakness of other currencies (especially the euro) that caused the USD Index to move higher.
The USD Index is a weighted average of several currency exchange rates, the biggest of which is the EUR/USD. Obviously, there are two sides of the currency exchange rate and it can move because something changed regarding either one currency, or the other, or regarding both of them. In this case, it was not US economy’s strength that pushed USDX higher – it was EU-trouble.
Why does the above matter to us - precious metals’ investors?
Because we check the gold-USD link in order to check if gold is showing adequate strength or not. If it doesn’t, it means that it’s likely to change direction. The key word here is “adequate”. We want to compare gold’s performance to factors that should generate a certain response and they don’t. For instance, a major decline in the value of the US currency in light of growing unemployment should cause gold to rally. If it doesn’t, it means that gold doesn’t really want to move higher at this time and one might consider shorting it.
But, if there are problems in one the Eurozone’s biggest economies, then shouldn’t gold actually move higher as a risk hedge? Shouldn’t the USD rally as a risk hedge as well as being world’s key currency and it’s clear that some investors will prefer to move out of the euro in the light of increased risks surrounding it? Indeed, that’s what should take place and that’s what we saw: gold moved higher along with the USD Index, but the size of both moves was not significant.
Can we really speak of gold’s strength in the light of the above? No. It moved just like it should, and its reaction actually could have been much bigger. Therefore, we don’t think that there are bullish implications of the recent action in the gold-USD link.
There is, however, an indication that the strength of gold’s value compared to the one of the USD Index is ending.
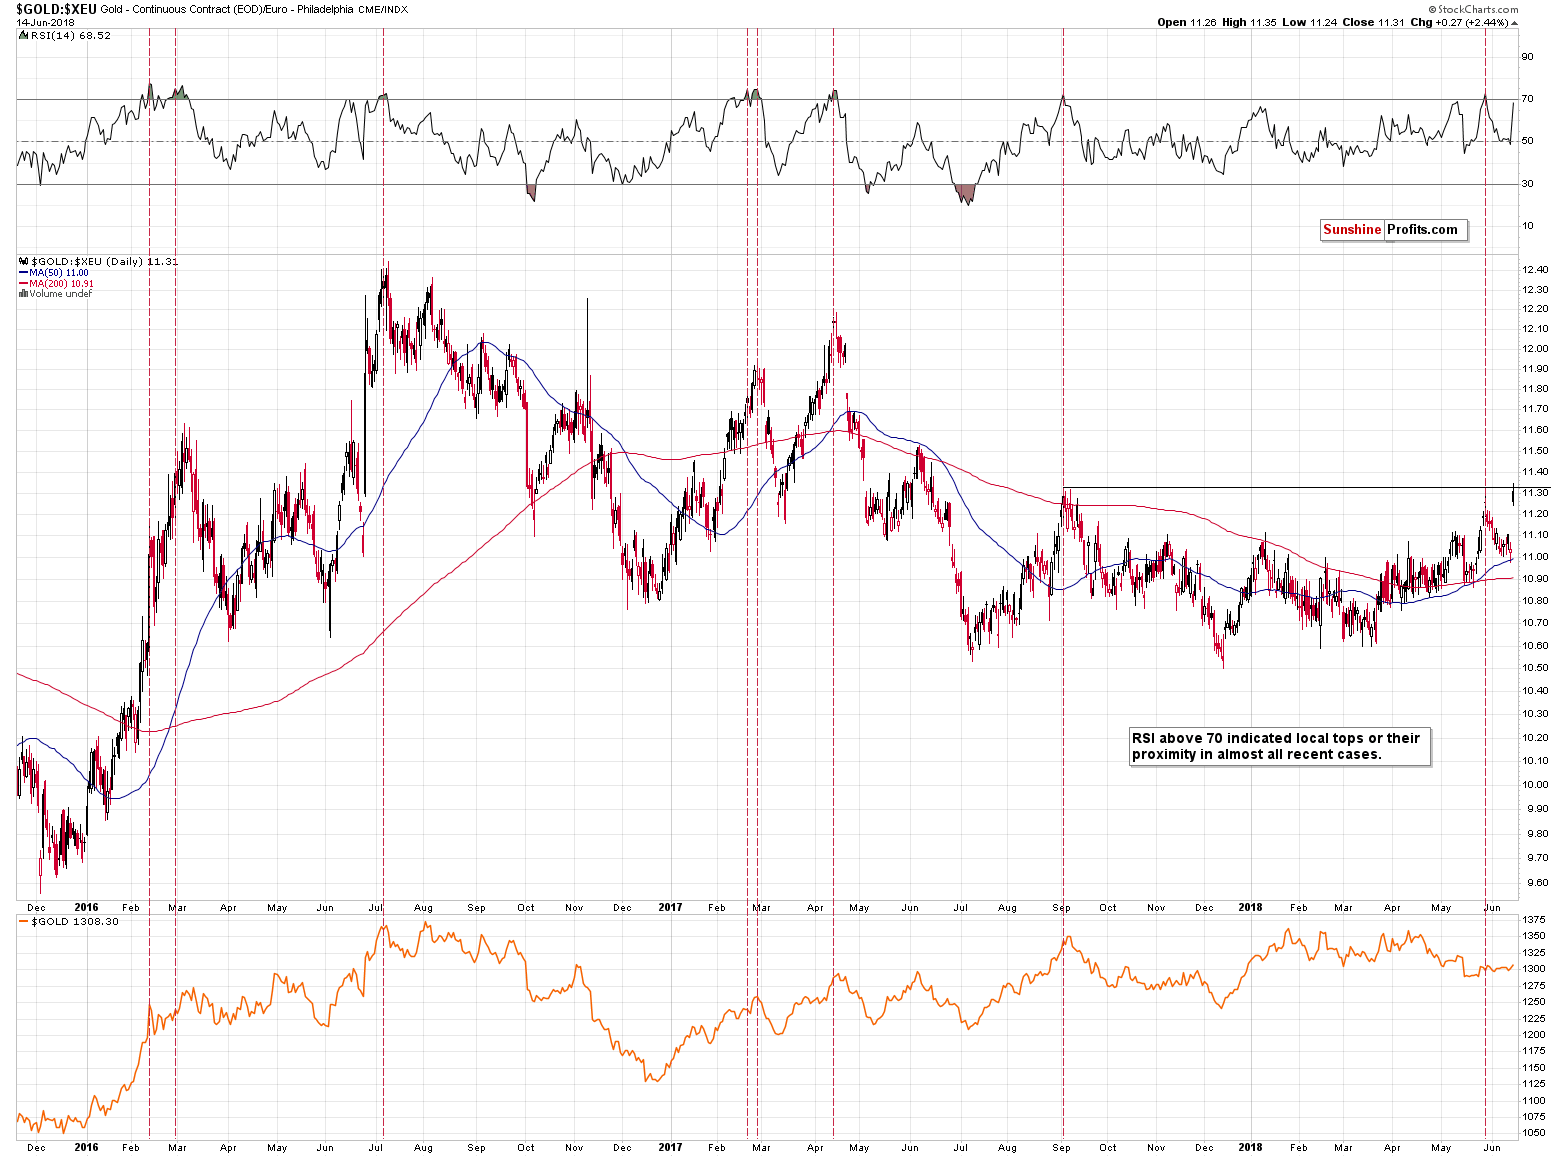
Gold’s price in terms of the euro moved sharply higher yesterday, but didn’t break above the major September 2017 high. This, plus the fact that the RSI indicator moved very close to the 70 level makes a turnaround very likely. Please note that the RSI indicator moved almost to the 70 level also in the first half of May. Gold (in USD terms) moved to new monthly low shortly thereafter.
While we’re discussing the gold’s relationship with other currencies, let’s take a look at latter for additional details.
Forex Update
As far as the situation in the currency markets is concerned, it seems that it’s developing in tune with the technical patterns and with our expectations.

We previously wrote that the correction in the USD Index was most likely ending and that we could see some sideways trading this week before the rally really continues. The above was based on the analogy to the 2014 rally and on this week’s hot nature due to incoming news from monetary authorities. Once all is said and done and the dust settles, the markets are likely to resume their trends. This meant another move higher in case of the USD Index. And – as soon as the two key monetary meetings were over, the USD Index has indeed rallied with vengeance – even more than it did in 2014.

Please note that in October 2014, the final bottom was followed by a few days of higher USD prices and then another move lower, almost to the previous low. Only after that did the USD index soar and PMs plunged. It seems that we are seeing something similar this time. Similar, but not identical. The USD Index temporarily moved even below the previous lows, but then it moved even higher than it had in 2014. Back in 2014, gold reacted to USD’s strength shortly, but this time the USDX rally was caused not by USD’s inherent strength, but by euro’s weakness and thus the fact that we haven’t seen a big plunge in the PMs is not that surprising. We are likely to see it eventually (and shortly) anyway.
Moving back to the USD Index and its key components: EUR/USD and USD/JPY, we can say that the uncertainty regarding the interest rate decisions is now gone and thus the trends can now resume.

We had already entered the short position in EUR/USD and it became profitable practically immediately and in today’s analysis we will additionally feature the long position in the USD/JPY pair (it means a bet on the decrease of yen’s value as it’s in the denominator of the pair).

There were no specific technical confirmations in case of the yen, but they were not necessary. The analogy to the previous three cases seems very strong and the price action that followed in each case is dramatic enough to justify a trading position on its own. The only reason that we hadn’t opened the positions earlier was the uncertainty regarding this week’s comments from monetary authorities and the possibility of seeing big intraday volatility.
For instance, it might seem to have been better to have an open short position in the euro earlier, but please note that before moving much higher, the USD Index moved to new lows and likely pushed many traders off the market when their stop-loss levels were reached. That’s exactly what we didn’t want to happen to you and it seems that our approach was successful.
All in all, as far as the forex market is concerned, we think that a speculative short position in the EUR/USD pair is justified from the risk to reward point of view and the same goes for the long position in the USD/JPY pair. In case of the EUR/USD, the stop-loss level for this position is 1.186 and the initial target price is 1.1203. In case of the USD/JPY, the stop-loss level for this position is 107.78 and the initial target price is 113.88.
On an administrative note, as you’ve noticed, today’s alert included quite a lot of forex details, which are normally part of the Forex Trading Alerts. For the next several days (most likely until June 22nd), your Editor will be providing the crude oil and forex analysis and we thought that it would be a pleasant surprise to include the latter right into our Gold & Silver Trading Alerts. So, while we’re not going to include forex trading positions into the normal summary of positions for this type of alert as it might be confusing for some subscribers, we will provide additional information regarding any positions in the forex sections, just like we did today.
Summary
Summing up, sometimes things are not what they appear at the first sight and yesterday’s move higher in gold, mining stocks, and – most of all – silver, has the opposite implications of what seems likely. They all moved higher, but the way in which they did (huge-volume reversals very similar to previous pre-decline cases) make the outlook bearish, not bullish. Gold’s strength relative to the rally to the USD Index might appear very encouraging, but at this time it’s just a one-time event and since the latter was not a consequence of USD strength, but EUR weakness, it’s not justified to speak of gold’s real strength. PMs do indeed appear to be on a verge of a major move, but the direction is likely to be to the downside even if it emotionally “feels” otherwise.
As always, we’ll keep you – our subscribers – informed.
To summarize:
Trading capital (supplementary part of the portfolio; our opinion): Full short positions (200% of the full position) in gold, silver and mining stocks are justified from the risk/reward perspective with the following stop-loss orders and initial target price levels:
- Gold: initial target price: $1,251; stop-loss: $1,382; initial target price for the DGLD ETN: $48.88; stop-loss for the DGLD ETN $37.48
- Silver: initial target price: $15.73; stop-loss: $18.06; initial target price for the DSLV ETN: $27.58; stop-loss for the DSLV ETN $19.17
- Mining stocks (price levels for the GDX ETF): initial target price: $21.03; stop-loss: $23.54; initial target price for the DUST ETF: $28.88; stop-loss for the DUST ETF $21.16
In case one wants to bet on junior mining stocks' prices (we do not suggest doing so – we think senior mining stocks are more predictable in the case of short-term trades – but if one wants to do it anyway, we provide the details), here are the stop-loss details and initial target prices:
- GDXJ ETF: initial target price: $30.62; stop-loss: $36.14
- JDST ETF: initial target price: $59.68 stop-loss: $40.86
Long-term capital (core part of the portfolio; our opinion): No positions (in other words: cash)
Insurance capital (core part of the portfolio; our opinion): Full position
Important Details for New Subscribers
Whether you already subscribed or not, we encourage you to find out how to make the most of our alerts and read our replies to the most common alert-and-gold-trading-related-questions.
Please note that the in the trading section we describe the situation for the day that the alert is posted. In other words, it we are writing about a speculative position, it means that it is up-to-date on the day it was posted. We are also featuring the initial target prices, so that you can decide whether keeping a position on a given day is something that is in tune with your approach (some moves are too small for medium-term traders and some might appear too big for day-traders).
Plus, you might want to read why our stop-loss orders are usually relatively far from the current price.
Please note that a full position doesn’t mean using all of the capital for a given trade. You will find details on our thoughts on gold portfolio structuring in the Key Insights section on our website.
As a reminder – “initial target price” means exactly that – an “initial” one, it’s not a price level at which we suggest closing positions. If this becomes the case (like it did in the previous trade) we will refer to these levels as levels of exit orders (exactly as we’ve done previously). Stop-loss levels, however, are naturally not “initial”, but something that, in our opinion, might be entered as an order.
Since it is impossible to synchronize target prices and stop-loss levels for all the ETFs and ETNs with the main markets that we provide these levels for (gold, silver and mining stocks – the GDX ETF), the stop-loss levels and target prices for other ETNs and ETF (among other: UGLD, DGLD, USLV, DSLV, NUGT, DUST, JNUG, JDST) are provided as supplementary, and not as “final”. This means that if a stop-loss or a target level is reached for any of the “additional instruments” (DGLD for instance), but not for the “main instrument” (gold in this case), we will view positions in both gold and DGLD as still open and the stop-loss for DGLD would have to be moved lower. On the other hand, if gold moves to a stop-loss level but DGLD doesn’t, then we will view both positions (in gold and DGLD) as closed. In other words, since it’s not possible to be 100% certain that each related instrument moves to a given level when the underlying instrument does, we can’t provide levels that would be binding. The levels that we do provide are our best estimate of the levels that will correspond to the levels in the underlying assets, but it will be the underlying assets that one will need to focus on regarding the signs pointing to closing a given position or keeping it open. We might adjust the levels in the “additional instruments” without adjusting the levels in the “main instruments”, which will simply mean that we have improved our estimation of these levels, not that we changed our outlook on the markets. We are already working on a tool that would update these levels on a daily basis for the most popular ETFs, ETNs and individual mining stocks.
Our preferred ways to invest in and to trade gold along with the reasoning can be found in the how to buy gold section. Additionally, our preferred ETFs and ETNs can be found in our Gold & Silver ETF Ranking.
As a reminder, Gold & Silver Trading Alerts are posted before or on each trading day (we usually post them before the opening bell, but we don't promise doing that each day). If there's anything urgent, we will send you an additional small alert before posting the main one.
=====
Latest Free Trading Alerts:
Powell delivered and hiked again. Draghi halved the amount of purchased assets, but did not have the courage to end the quantitative easing program. Does the former have bigger cojones than the latter? And what does it mean for the gold market?
Does Powell Have Bigger Balls Than Draghi?
=====
Hand-picked precious-metals-related links:
PRECIOUS-Gold slips on stronger dollar; U.S.-China trade war fears loom
The World's Largest Gold Fund Is Getting a Cheaper Little Brother
Two Banks See Post-FOMC Upside Potential For Gold Prices
The future of gold exploration is under cover
=====
In other news:
Powell Styles Himself a Fed Chairman for the People
Stocks fall, dollar hits seven-month high as U.S. readies China tariffs
Trump Approves Tariffs on $50 Billion of Chinese Goods
Japan's central bank cuts inflation view, narrowing stimulus-exit path
Volcker 'fix' may cause new headaches for Wall Street
Here’s how top investors are preparing for the ECB’s ‘easy-money’ exit
Bitcoin's Greater Fools Go Into Hiding
=====
Thank you.
Sincerely,
Przemyslaw Radomski, CFA
Founder, Editor-in-chief, Gold & Silver Fund Manager
Gold & Silver Trading Alerts
Forex Trading Alerts
Oil Investment Updates
Oil Trading Alerts


