

Powell delivered and hiked again. Draghi halved the amount of purchased assets, but did not have courage to end the quantitative easing program. Does the former have bigger cojones than the latter? And what does it mean for the gold market?
Don’t Worry, It’s Just another Hike
In line with the expectations, the FOMC acknowledged the improved economic outlook (the economy has grown at solid rate, while job gains have been strong) and raised interest rates again. The key paragraph of the recent monetary policy statement is as follows:
In view of realized and expected labor market conditions and inflation, the Committee decided to raise the target range for the federal funds rate to 1-3/4 to 2 percent. The stance of monetary policy remains accommodative, thereby supporting strong labor market conditions and a sustained return to 2 percent inflation.
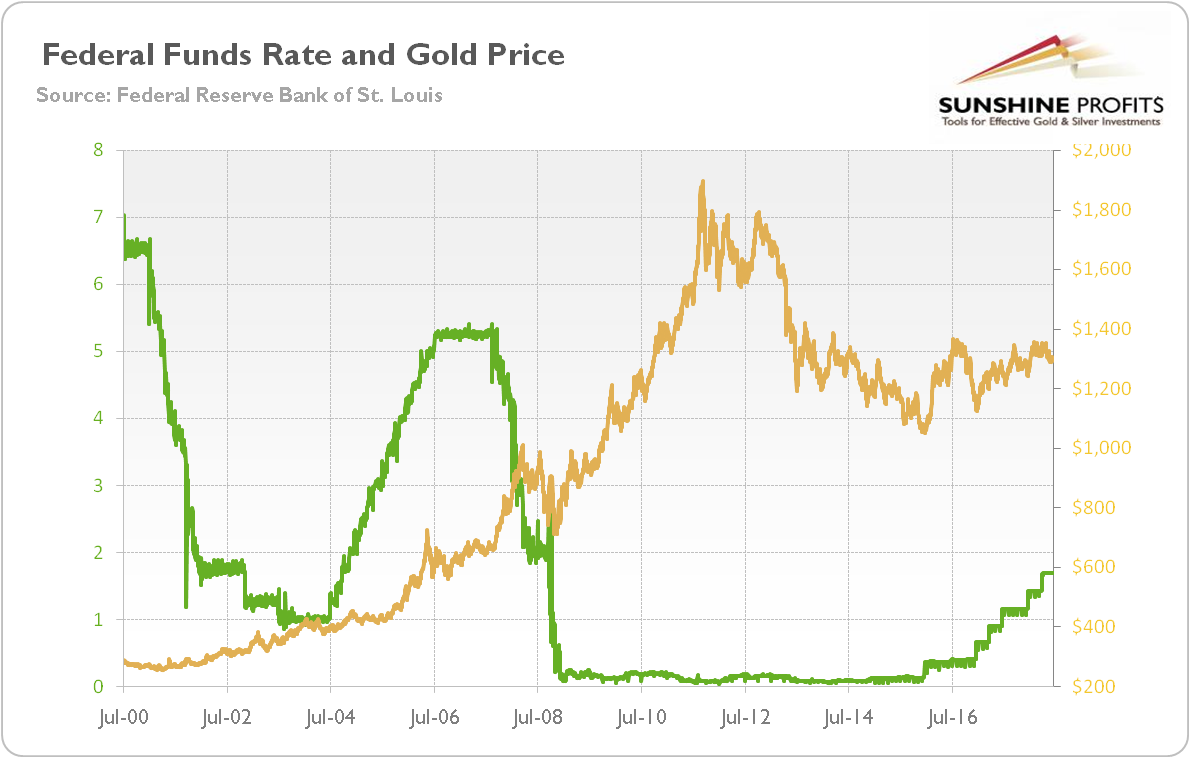
It was the seventh hike during the current Fed’s tightening cycle. The current target range for the federal funds rate is 1.75-2 percent. However, the stance of monetary policy remains accommodative, and the pace of tightening is gradual, as the chart below shows.
Chart 1: Effective federal funds rate (green line, left axis, in %, daily) and the price of gold (yellow line, right axis, London P.M. Fix, in $) from 1968 to 2018.
As in the previous cases, the Fed also raised the interest rate paid on required and excess reserve balances from 1.75 to 1.95 percent (so the U.S. central bank set that interest 5 basis points below the top of the target range for the federal funds rate to foster trading in the federal funds market at rates well within the target range) and the primary credit rate from 2.25 percent to 2.50 percent. The vote was again unanimous and already priced in the gold rates, so it shouldn’t affect the precious metals market.
Fed Sees Four Hikes in 2018
The June FOMC projections were much more interesting. The members of the Committee edged up their forecasts of GDP growth in 2018 (from 2.7 to 2.8 percent), signaling confidence in the U.S. economy in the short run. They also projected a lower unemployment rate in 2018 (3.6 percent compared to 3.8 percent in the previous forecast) and later in 2019 and 2020 (3.5 percent versus 3.6 percent). The U.S. central bankers also increased their forecast for inflation in 2018 (the overall PCE inflation is expected to rise 2.1 percent versus 1.9 percent, while the core index is estimated to increase 2 percent instead of 1.9 percent) and in 2019 (the overall inflation rate is forecasted to rise 2.1 percent versus 2 percent expected in March).
And most importantly, the U.S. central bank lifted its expected median federal funds rate in 2018 from 2.1 to 2.4. It implies four hikes in 2018 overall (two more hikes this year), compared to three moves seen in March. In line with that change, the FOMC members revised their projection for 2019 from 2.9 percent to 3.1 percent. The table below summarizes the June FOMC projections.
Table 1: June FOMC Projections (the most important changes; source: federalreserve.gov)
| SunshineProfits.com | ||||
|---|---|---|---|---|
| Variable | 2018 | 2019 | 2020 | Longer run |
|
Change in real GDP |
2.8 |
2.4 |
2.0 |
1.8 |
|
March projection |
2.7 |
2.4 |
2.0 |
1.8 |
|
Unemployment rate |
3.6 |
3.5 |
3.5 |
4.5 |
|
March projection |
3.8 |
3.6 |
3.6 |
4.5 |
|
PCE inflation |
2.1 |
2.1 |
2.1 |
2.0 |
|
March projection |
1.9 |
2.0 |
2.1 |
2.0 |
|
Core PCE inflation |
2.0 |
2.1 |
2.1 |
|
|
March projection |
1.9 |
2.1 |
2.1 |
|
|
Federal funds rate |
2.4 |
3.1 |
3.4 |
2.9 |
|
March projection |
2.1 |
2.9 |
3.4 |
2.9 |
Therefore, the new composition of the FOMC confirmed its hawkish stance, just as we had been warning investors for a long time (for example, in the December edition of the Market Overview). What is really important is that the rate expectations are higher, as the most dovish participants raised their dots. It signals the upbeat optimism among the FOMC members, if even the most dovish members raised their projections. On the other hand, investors should remember that most participants did not revise their projections. Anyway, the more hawkish Fed may be a headwind for the gold prices in the medium term, although the price of the yellow metal showed an impressive resilience on Thursday.
ECB on Hold
The ECB released its monetary policy statement one day after the Fed. The ECB did not announce the end of its quantitative easing. Instead, the bank prolonged it until December. However, it halved the asset purchase program from €30 billion per month to €15 billion per month from September 2018. The ECB also pledged to keep interest rates unchanged until at least the middle of next year:
The Governing Council expects the key ECB interest rates to remain at their present levels at least through the summer of 2019 and in any case for as long as necessary to ensure that the evolution of inflation remains aligned with the current expectations of a sustained adjustment path.
Implications for Gold
Both the Fed and the ECB released their monetary policy statements. Powell delivered hike (and two more are coming this year), while Draghi chickened out. Surely, he halved the amount of purchased assets each month, but did not announce the end of the program in September. Instead, he said that the quantitative easing will last until December. And Draghi also pledged to remain the interest rates unchanged at their current ultra low level until summer 2019.
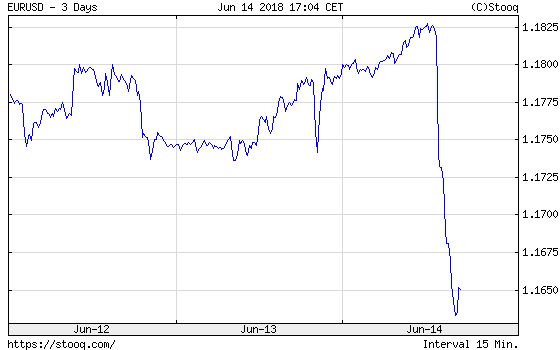
What does it all mean for the gold market? Well, the Fed turned out to be more hawkish than expected, while the ECB more dovish. It should strengthen the U.S. dollar against the euro. Indeed, the common currency plunged against the greenback on Thursday, as one can see in the chart below.
Chart 2: EUR/USD exchange rate from June 12 to June 14.
However, gold showed impressive resilience in the face of rallying dollar, as the next chart shows.
Chart 3: Gold prices from June 12 to June 14.
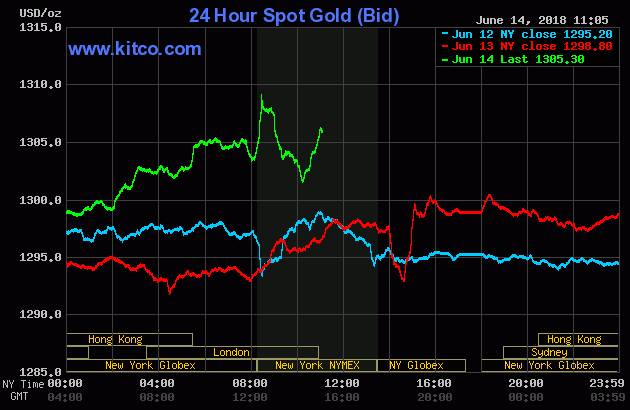
It suggests that gold could have already bottomed out or at least that the sideways trend could continue in the near term, or that the traditional relationship between the yellow metal and the dollar has broken. It could also mean that the emotions reached extreme levels after two major monetary decisions almost right after each other and that there are actually no implications as we’ll need to wait until the dust settles a bit, before making conclusions. In the next edition of the Gold News Monitor, we will dig into the press conferences of Powell and Draghi and we will elaborate on gold’s outlook from the fundamental point of view. Stay tuned!
If you enjoyed the above analysis, we invite you to check out our other services. We focus on fundamental analysis in our monthly Market Overview reports and we provide daily Gold & Silver Trading Alerts with clear buy and sell signals. If you’re not ready to subscribe yet and are not on our gold mailing list yet, we urge you to sign up. It’s free and if you don’t like it, you can easily unsubscribe. Sign me up!
Disclaimer: Please note that the aim of the above analysis is to discuss the likely long-term impact of the featured phenomenon on the price of gold and this analysis does not indicate (nor does it aim to do so) whether gold is likely to move higher or lower in the short- or medium term. In order to determine the latter, many additional factors need to be considered (i.e. sentiment, chart patterns, cycles, indicators, ratios, self-similar patterns and more) and we are taking them into account (and discussing the short- and medium-term outlook) in our trading alerts.
Thank you.
Arkadiusz Sieron, Ph.D.
Sunshine Profits‘ Gold News Monitor and Market Overview Editor
Gold News Monitor
Gold Trading Alerts
Gold Market Overview
