

Briefly: in our opinion, full (250% of the regular size of the position) speculative short position in gold, silver, and mining stocks are justified from the risk/reward point of view at the moment of publishing this Alert.
Precious metals barely moved yesterday, yet even no moves to speak of can be telling ones. The key is to put them into context with the preceding action. In today's Alert, we further look at the phenomenon of round numbers - we compare the 2011 break above $1,900 with this $1,500 break.
Today's Alert is going to be relatively short, as barely anything happened yesterday in the precious metals market and in the currency market. This means that everything that we wrote yesterday remains up-to-date. The same goes for the long-term factors visible on the long-term silver chart, gold to silver ratio chart, gold stocks to gold ratio chart, and the long-term HUI Index chart. Please click on the above links for details.
Yesterday's Calm PMs Session
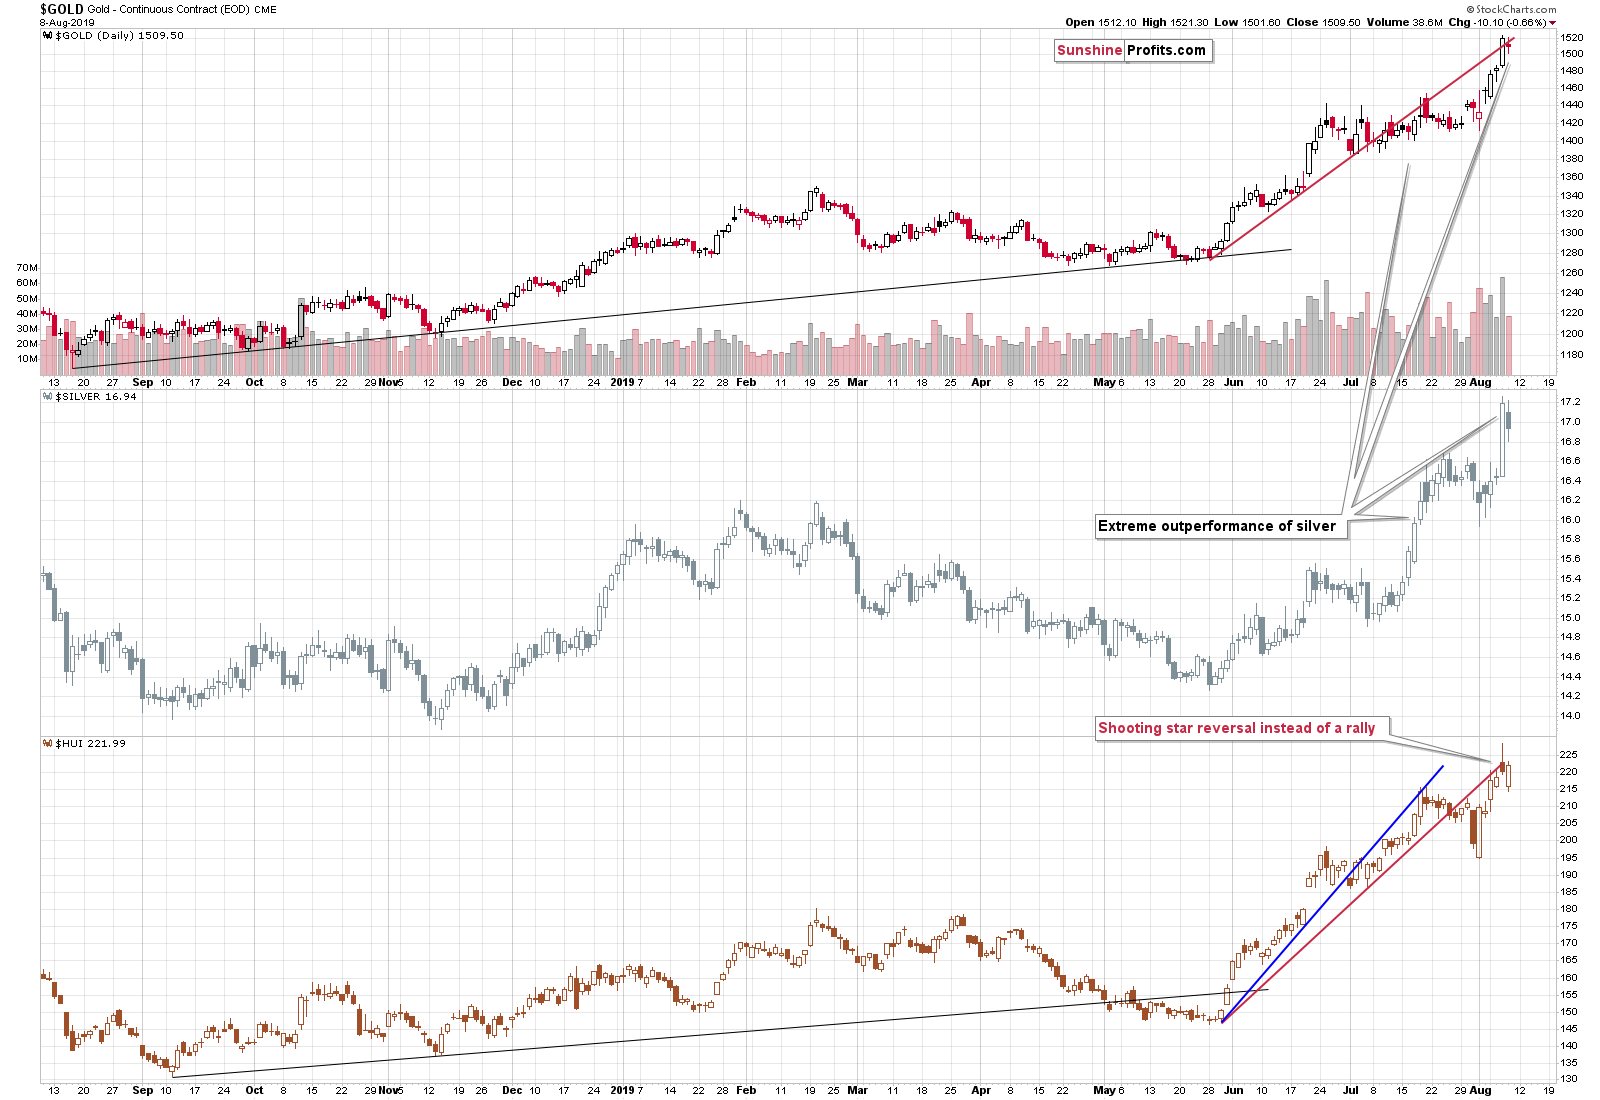
On the short-term chart we see that gold and silver sold off a bit, but the decline has not been profound so far. The gold miners moved higher, but the move was so small that the session brought almost no changes on a closing prices basis.
The most important thing that we see on the above chart continues to be Wednesday's relative performance of the different parts of the PM sector. Namely, silver soared and it greatly - and clearly - outperformed gold on a short-term basis, which is a traditional sell signal for the entire precious metals sector, especially when it's accompanied by weak performance in the mining stocks. And miners were definitely weak on that day. They moved higher initially, but reversed shortly and instead of rallying, they formed a clear bearish shooting star reversal. The reversal is bearish on its own but taking it into account along with silver's outperformance makes it exceptionally bearish. It's difficult to imagine a more bearish combination of daily price moves in the precious metals sector.
What Clues Does the USD Index Send?
At the same time, the USD Index is moving back and forth at the combination of two short-term support levels, which is in tune with what we wrote previously:
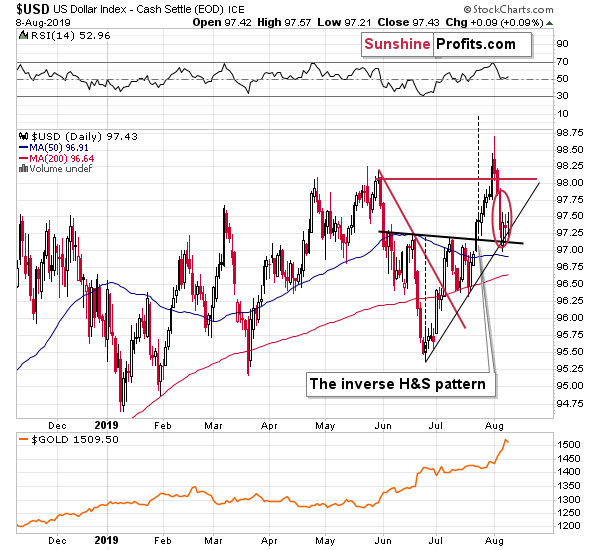
The situation on the USD Index suggests that gold might really show some strength. The USD invalidated the breakout above the previous highs, which doesn't change the bullish outlook for the medium term, but could pose a challenge in the very near term. It is possible that the USD will make another attempt to move higher, as it did in late May, but it's also possible that it will decline to the combination of the rising support line and the previously broken neck level of the inverse head-and-shoulders pattern. This could correspond to gold's attempt to break above $1,500, or it could result in gold moving to the late April 2013 high of $1,487.
The USD Index moved almost right to the combination of the neck level of the previously completed inverse head-and-shoulders pattern and the rising support line. This means that the bottom was likely either reached or it's very close to being reached. The mid-July consolidation took several days, so it might be the case that despite the target being (almost) reached, we'll see at least a few back-and-forth trading days before the USD rallies once again.
That's exactly what we saw - the U.S. currency has been moving back and forth for a few days, but the support lines remain intact. It seems that a bottom in the USD Index has formed and that it can now resume its upward trajectory. This will likely result in the invalidation of the move above $1,500 in gold, which in turn could lead to much bigger declines.
Round Numbers Note
Before summarizing, we would like to draw your attention to the fact that the when gold broke above $1,900 after a volatile price move and made headlines based on that, it rallied $23.70 above this level before reaching THE top. The current move above $1,500 was also widely covered by the financial press, so the immediate reaction of the momentum- and news-followers was quite likely to be similar. This time, gold moved $22.70 above the round number, which is very similar to the 2011 reaction. To be clear, this analogy on its own isn't enough for one to expect a downturn in the precious metals sector, but since it's only an addition to a wide range of factors pointing to the decline, we can use it as a confirmation that makes the bearish picture even more bearish.
Summary
Summing up, we wrote about opening the short positions in gold, silver, and mining stocks based on gold reaching $1,519 without any other conditions, but based on silver's and miners' movement, we see that this was most likely a good decision. From the long-term point of view, it appears that the recent move higher in gold was fake and that the next big move will be to the downside, just as other parts of the precious metals market suggest. The big picture of silver and mining stocks, key precious metals ratios that we covered earlier this week, and the USD Index all point to much lower precious metals prices in the following months. Based on how silver and mining stocks moved on Wednesday, we also have the very short-term confirmation of the bearish scenario.
As always, we'll keep you - our subscribers - informed.
To summarize:
Trading capital (supplementary part of the portfolio; our opinion): Full speculative short position (250% of the full position) in gold, silver, and mining stocks is justified from the risk/reward perspective with the following stop-loss orders and exit profit-take price levels:
- Gold: profit-take exit price: $1,241; stop-loss: $1,552; initial target price for the DGLD ETN: $51.87; stop-loss for the DGLD ETN $25.37
- Silver: profit-take exit price: $13.81; stop-loss: $17.53; initial target price for the DSLV ETN: $39.08; stop-loss for the DSLV ETN $20.67
- Mining stocks (price levels for the GDX ETF): profit-take exit price: $17.61; stop-loss: $33.37; initial target price for the DUST ETF: $32.28; stop-loss for the DUST ETF $5.78
In case one wants to bet on junior mining stocks' prices (we do not suggest doing so - we think senior mining stocks are more predictable in the case of short-term trades - if one wants to do it anyway, we provide the details), here are the stop-loss details and target prices:
- GDXJ ETF: profit-take exit price: $23.71; stop-loss: $48.42
- JDST ETF: profit-take exit price: $73.32 stop-loss: $9.67
Long-term capital (core part of the portfolio; our opinion): No positions (in other words: cash)
Insurance capital (core part of the portfolio; our opinion): Full position
Whether you already subscribed or not, we encourage you to find out how to make the most of our alerts and read our replies to the most common alert-and-gold-trading-related-questions.
Please note that the in the trading section we describe the situation for the day that the alert is posted. In other words, it we are writing about a speculative position, it means that it is up-to-date on the day it was posted. We are also featuring the initial target prices, so that you can decide whether keeping a position on a given day is something that is in tune with your approach (some moves are too small for medium-term traders and some might appear too big for day-traders).
Plus, you might want to read why our stop-loss orders are usually relatively far from the current price.
Please note that a full position doesn't mean using all of the capital for a given trade. You will find details on our thoughts on gold portfolio structuring in the Key Insights section on our website.
As a reminder - "initial target price" means exactly that - an "initial" one, it's not a price level at which we suggest closing positions. If this becomes the case (like it did in the previous trade) we will refer to these levels as levels of exit orders (exactly as we've done previously). Stop-loss levels, however, are naturally not "initial", but something that, in our opinion, might be entered as an order.
Since it is impossible to synchronize target prices and stop-loss levels for all the ETFs and ETNs with the main markets that we provide these levels for (gold, silver and mining stocks - the GDX ETF), the stop-loss levels and target prices for other ETNs and ETF (among other: UGLD, DGLD, USLV, DSLV, NUGT, DUST, JNUG, JDST) are provided as supplementary, and not as "final". This means that if a stop-loss or a target level is reached for any of the "additional instruments" (DGLD for instance), but not for the "main instrument" (gold in this case), we will view positions in both gold and DGLD as still open and the stop-loss for DGLD would have to be moved lower. On the other hand, if gold moves to a stop-loss level but DGLD doesn't, then we will view both positions (in gold and DGLD) as closed. In other words, since it's not possible to be 100% certain that each related instrument moves to a given level when the underlying instrument does, we can't provide levels that would be binding. The levels that we do provide are our best estimate of the levels that will correspond to the levels in the underlying assets, but it will be the underlying assets that one will need to focus on regarding the signs pointing to closing a given position or keeping it open. We might adjust the levels in the "additional instruments" without adjusting the levels in the "main instruments", which will simply mean that we have improved our estimation of these levels, not that we changed our outlook on the markets. We are already working on a tool that would update these levels on a daily basis for the most popular ETFs, ETNs and individual mining stocks.
Our preferred ways to invest in and to trade gold along with the reasoning can be found in the how to buy gold section. Additionally, our preferred ETFs and ETNs can be found in our Gold & Silver ETF Ranking.
As a reminder, Gold & Silver Trading Alerts are posted before or on each trading day (we usually post them before the opening bell, but we don't promise doing that each day). If there's anything urgent, we will send you an additional small alert before posting the main one.
=====
Latest Free Trading Alerts:
The inversion of the yield curve is of crucial importance as it has historically been one of the most reliable recessionary gauges. Consequently, we invite you to read our today's article about the history of the yield curve inversions and find out whether the recession is coming, and what does it mean for the gold market.
History of Yield Curve Inversions and Gold
Don't be fooled by the apparent indecision in some currency pairs while we see the others moving to fresh 2019 extremes. Such an action smells of cashing profits and identifying new trading setups, which is exactly the subject of today's Alert.
The Glorious Sound of Ringing In Decent Profits
=====
Thank you.
Sincerely,
Przemyslaw Radomski, CFA
Editor-in-chief, Gold & Silver Fund Manager

