

The inversion of the yield curve is of crucial importance as it has historically been one of the most reliable recessionary gauges. Consequently, we invite you to read our today's article about the history of the yield curve inversions and find out whether the recession is coming, and what does it mean for the gold market.
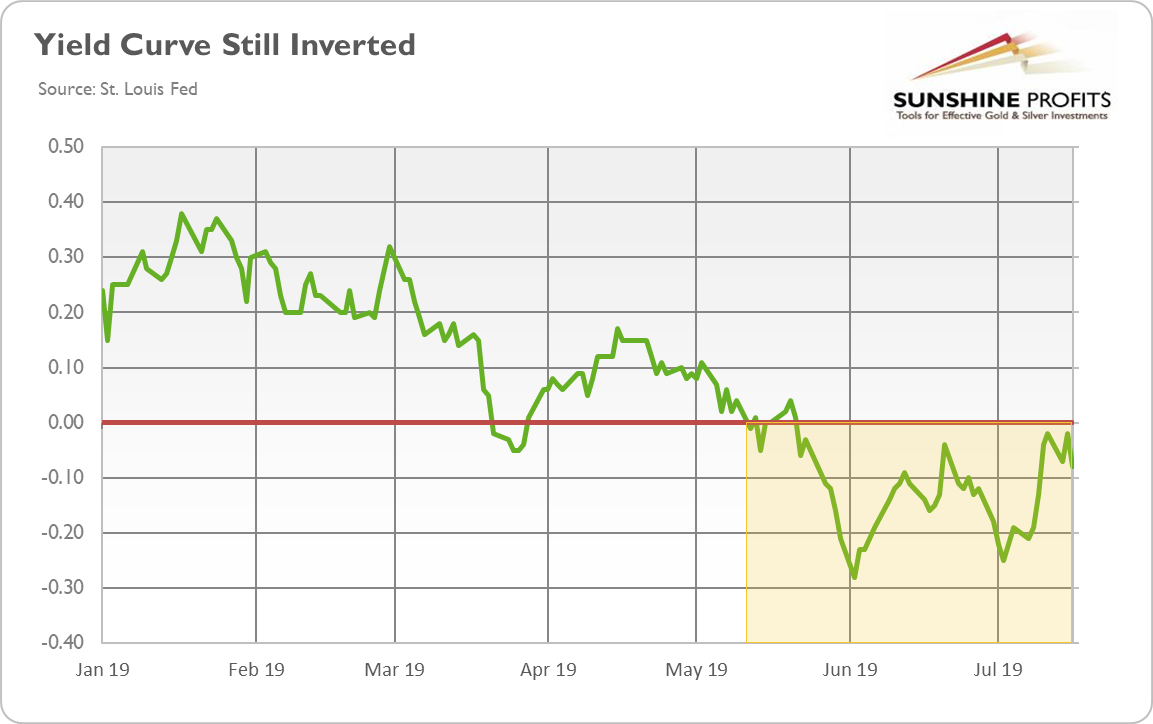
We keep our promises. In the previous edition of the Market Overview, we promised our Readers to "dig even deeper into the predictive power of the yield curve". As a refresher, please take a look at the chart below. It shows the U.S. Treasury yield curve, or actually not the whole curve, but the spread between 10-year and 3-month government bonds. As one can see, that difference is still negative (as of July 19). It means that the yield curve remains inverted (on a daily basis) since May 2019 (we abstract from the short-lived dip in March 2019).
Chart 1: Yield curve (spread between US 10-year and 3-month Treasuries, daily numbers, in %) in 2019.
The inversion of the yield curve is of crucial importance as it has historically been one of the most reliable recessionary gauges. Indeed, the inverted yield curve is an anomaly happening rarely, and is almost always followed by a recession. The chart below presents the history of the U.S. yield curve inversions, as provided by the New York Fed.
Chart 2: Yield curve (spread between US 10-year and 3-month Treasuries, monthly averages, data retrieved from the New York Fed, in %) in 2019.
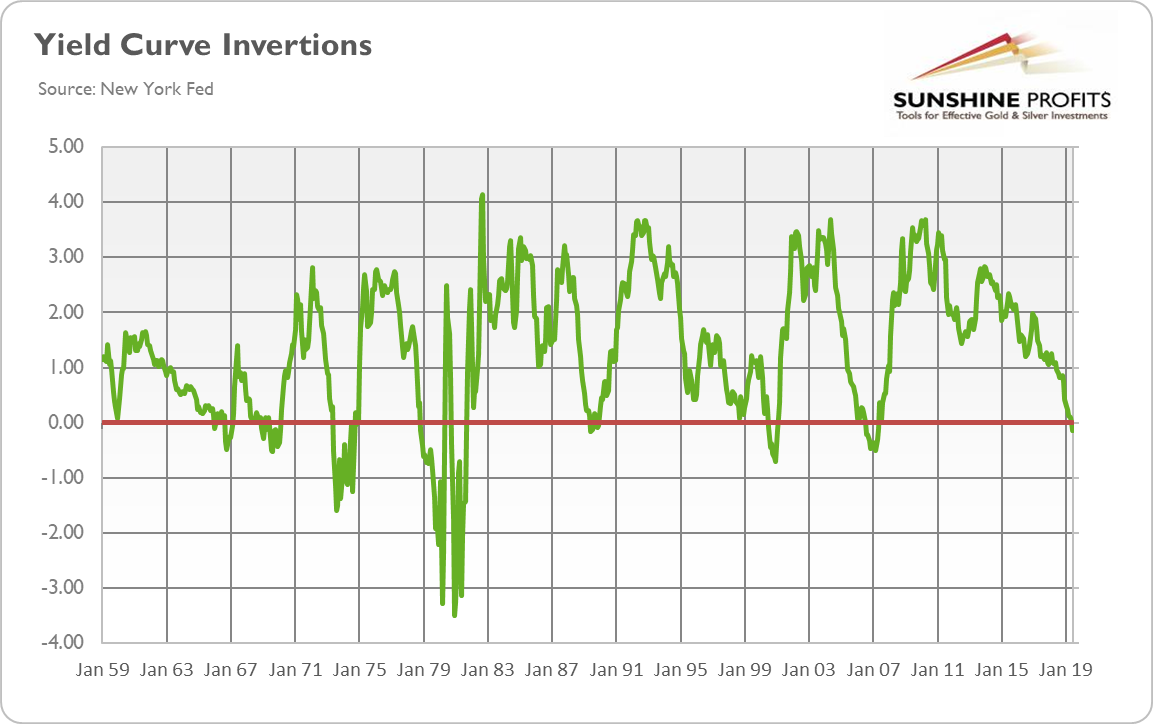
As you can see, the yield curve inverted before both the dot-com bubble and the Great Recession, the two most US recent recessions. The table below provides a more detailed dating of the yield curve inversions and the following recessions.
Table 1: U.S. yield curve inversions and recessions
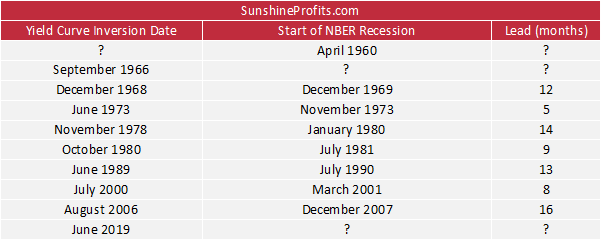
Our data series goes back to 1953 - since then, we had eight yield curve inversions and almost all of them were followed by a recession. The only exception was September 1966. The yield curve inverted, but no officially-declared recession took place. However, there was a credit crunch in 1966 and the slowdown in economic growth in 1967, so the relationship between the flattening of the yield curve and economic growth was still there, although a weaker one.
And there was also one case when the yield curve did not invert, the recession of 1960-1961. However, the spread narrowed substantially, falling below 1 percent in mid-1959, and reaching 0.09 percent in December 1959. Additionally, although the 10-year/3-month spread did not become negative, the 10-year/1-year spread fell below zero in September 1959, seven months before the onset of recession.
Hence, although we put question marks in the table at these two cases, the predictive power of the inversion of the yield curve remains, at least historically speaking, very powerful. As the average span between inversions and subsequent recessions has been 11 months, with a range of 5 to 16 months, and the yield curve inverted in June 2019 (in terms of monthly averages), we should expect recession somewhere between November 2019 and October 2020, possibly around May 2020.
Indeed, this key indicator is now flashing red light warning. Please examine the next two charts. They might be the most valuable charts you will see in the foreseeable future, so look carefully.
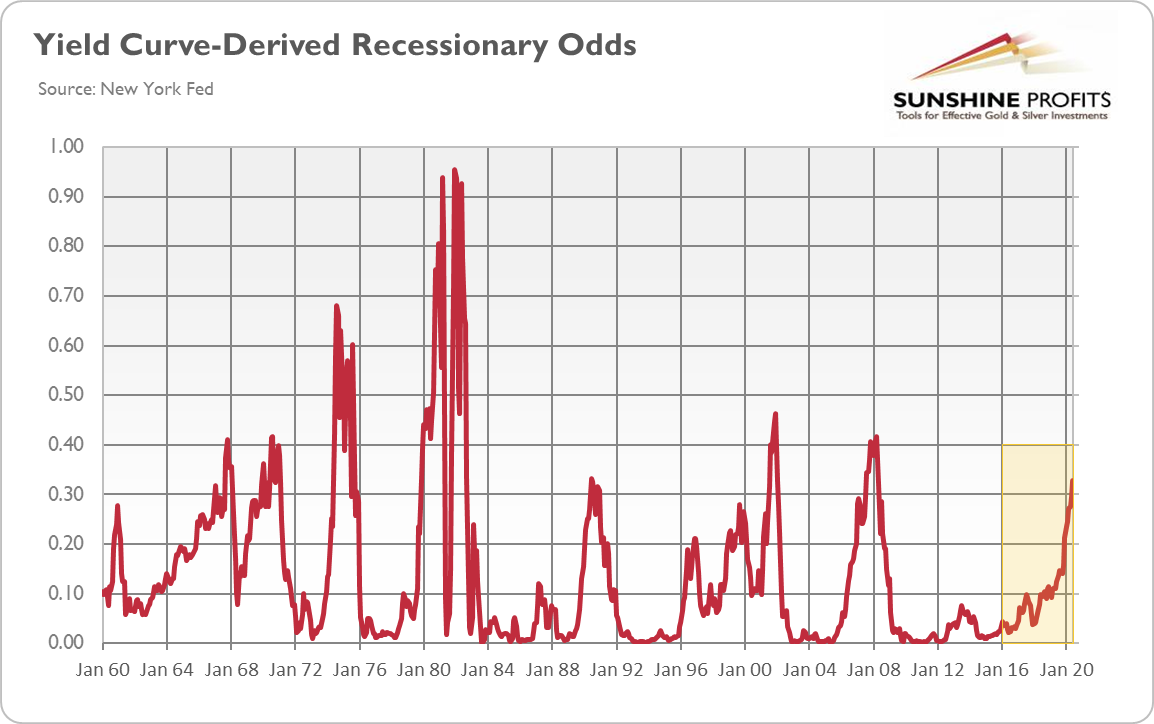
The first one displays the recessionary odds derived from the yield curve and is calculated by the New York Fed. As one can see, the probability of a recession in America twelve months ahead is 32.88 percent, an important jump in recessionary odds from 12.51 percent one year ago and from 29.62 percent in May 2019. They are now above 30 percent, an important level, whose surpassing was always followed by a recession.
Chart 3: Yield curve-derived recession probabilities twelve months ahead (calculated by the New York Fed, in %) from January 1960 to June 2020.
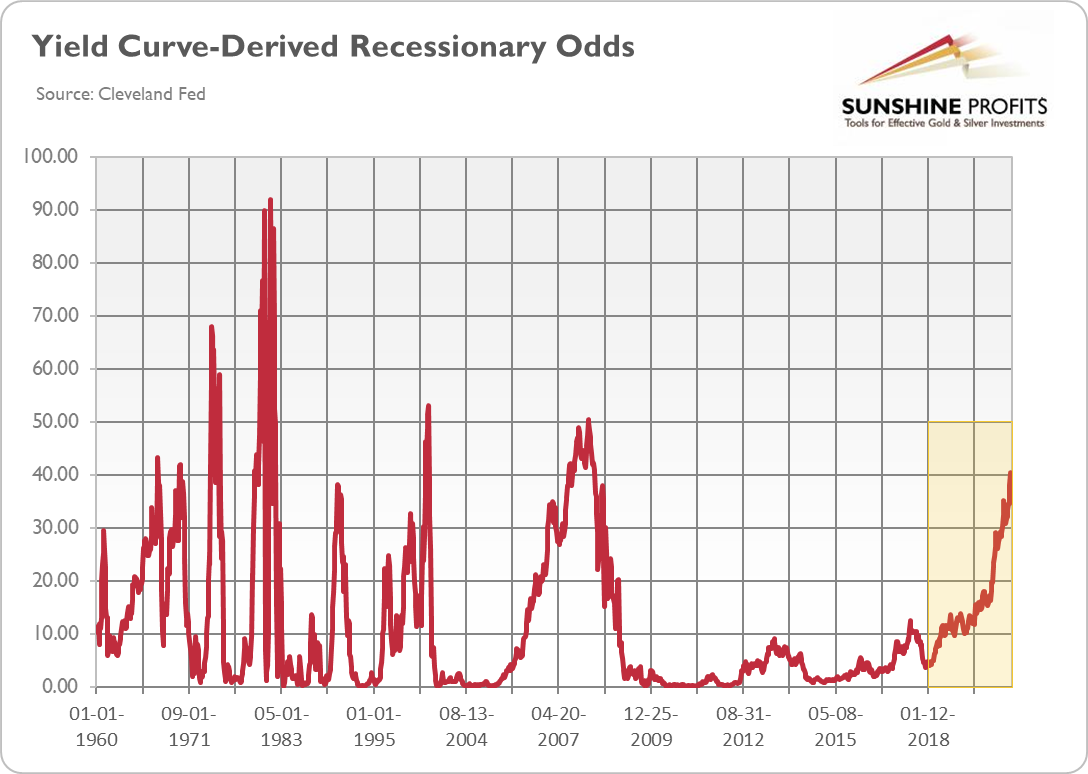
The yield curve-derived recession odds calculated by the Cleveland Fed are even more worrisome, as they soared from 14 percent one year ago to more than 40 percent in June 2019, the level which never was crossed without a recession following.
Chart 4: Yield curve-derived recession probabilities twelve months ahead (calculated by the Cleveland Fed in %) from January 1960 to June 2020.
It means that the odds of a recession have increased compared to the last month. Two important levels in both models - 30 and 40 percent, respectively - were exceeded, so we feel obliged to warn again our Readers that there are high chances, or even very high chances right now, of the U.S. recession arriving somewhere around the second quarter of 2020.
It might be, of course, the case that this time will be different. The yield curve is not an ideal recessionary indicator. But it is probably the best one we have. So, it would be unwise to ignore it. When you read these words, the Fed has probably just cut interest rates, "just in case". They adopted a risk management principles to the monetary policy, concluding that "insurance cut" is warranted. Consequently, perhaps investors should also apply a risk management approach to their investment portfolios and buy some insurance, such as gold, "just in case"?
If you enjoyed the above analysis and would you like to know more about the fundamentals of the gold market, we invite you to read the August Gold Market Overview report. If you're interested in the detailed price analysis and price projections with targets, we invite you to sign up for our Gold & Silver Trading Alerts. If you're not ready to subscribe yet and are not on our gold mailing list yet, we urge you to sign up. It's free and if you don't like it, you can easily unsubscribe. Sign up today!
Thank you.
Arkadiusz Sieron
Sunshine Profits' Gold News Monitor and Gold Market Overview Editor
