

Briefly: in our opinion, full (300% of the regular position size) speculative short positions in junior mining stocks are justified from the risk/reward point of view at the moment of publishing this Alert.
Gold, silver, and mining stocks moved a bit lower yesterday, and they moved a bit higher in today’s pre-market trading. Overall, the situation is the same as it was when I described it in yesterday’s video analysis. Consequently, today’s technical part will include just one chart that features a significant change, and one that might feature a major change shortly. If you haven’t watched my yesterday’s premium video analysis so far, I encourage you to do so today.
The chart with the important change is the one featuring the USD Index.
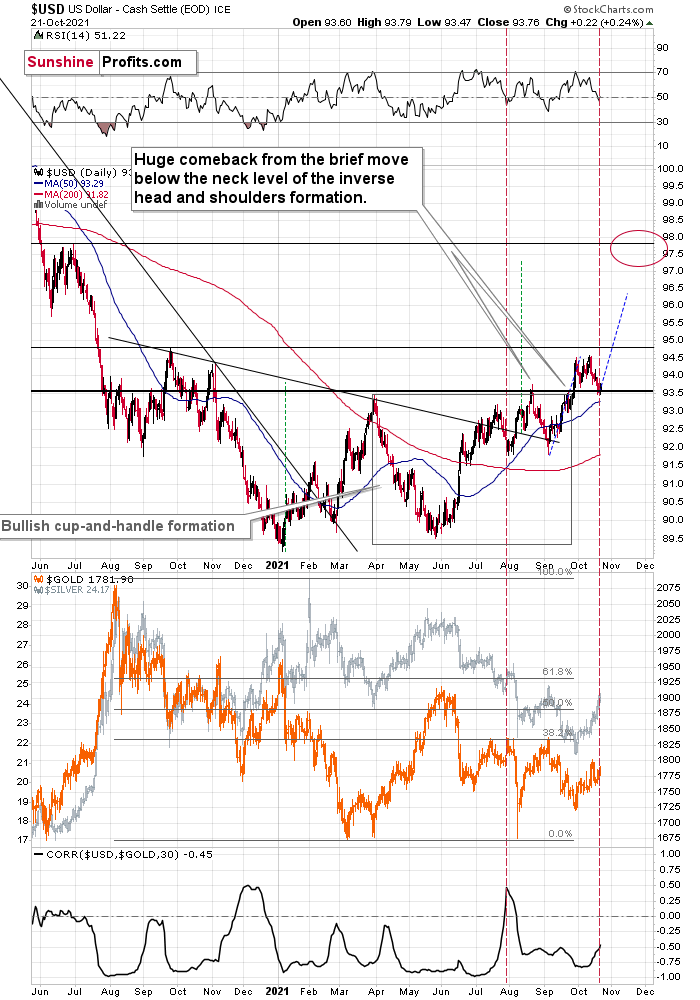
The important change is that the USD Index once again closed the day above its previous 2021 highs. In the above-linked video, I said that I viewed the daily close below the highest August close as rather accidental, and yesterday’s comeback confirmed that this was indeed the case.
So, since the breakout above the previous 2021 highs held, and the situation in the USD Index appears quite similar to what we saw in early August (in terms of the RSI and the USD’s position relative to its 50-day moving average), it seems that we might see the same thing once again in the case of the follow-up price moves.
And the follow-up price moves were higher in the USD Index and much lower in the case of gold.
Investors in Eager Anticipation
Powell is about to speak in several hours, which means that the markets could get a boost in any direction. Based on what we see in the charts, it seems that the next big move is likely to be to the upside in the case of the USD Index and to the downside in the case of the precious metals sector.
Moreover, please note that if Powell says something bearish for stocks, it might trigger a big move lower – if not immediately, then sooner rather than later. Why?
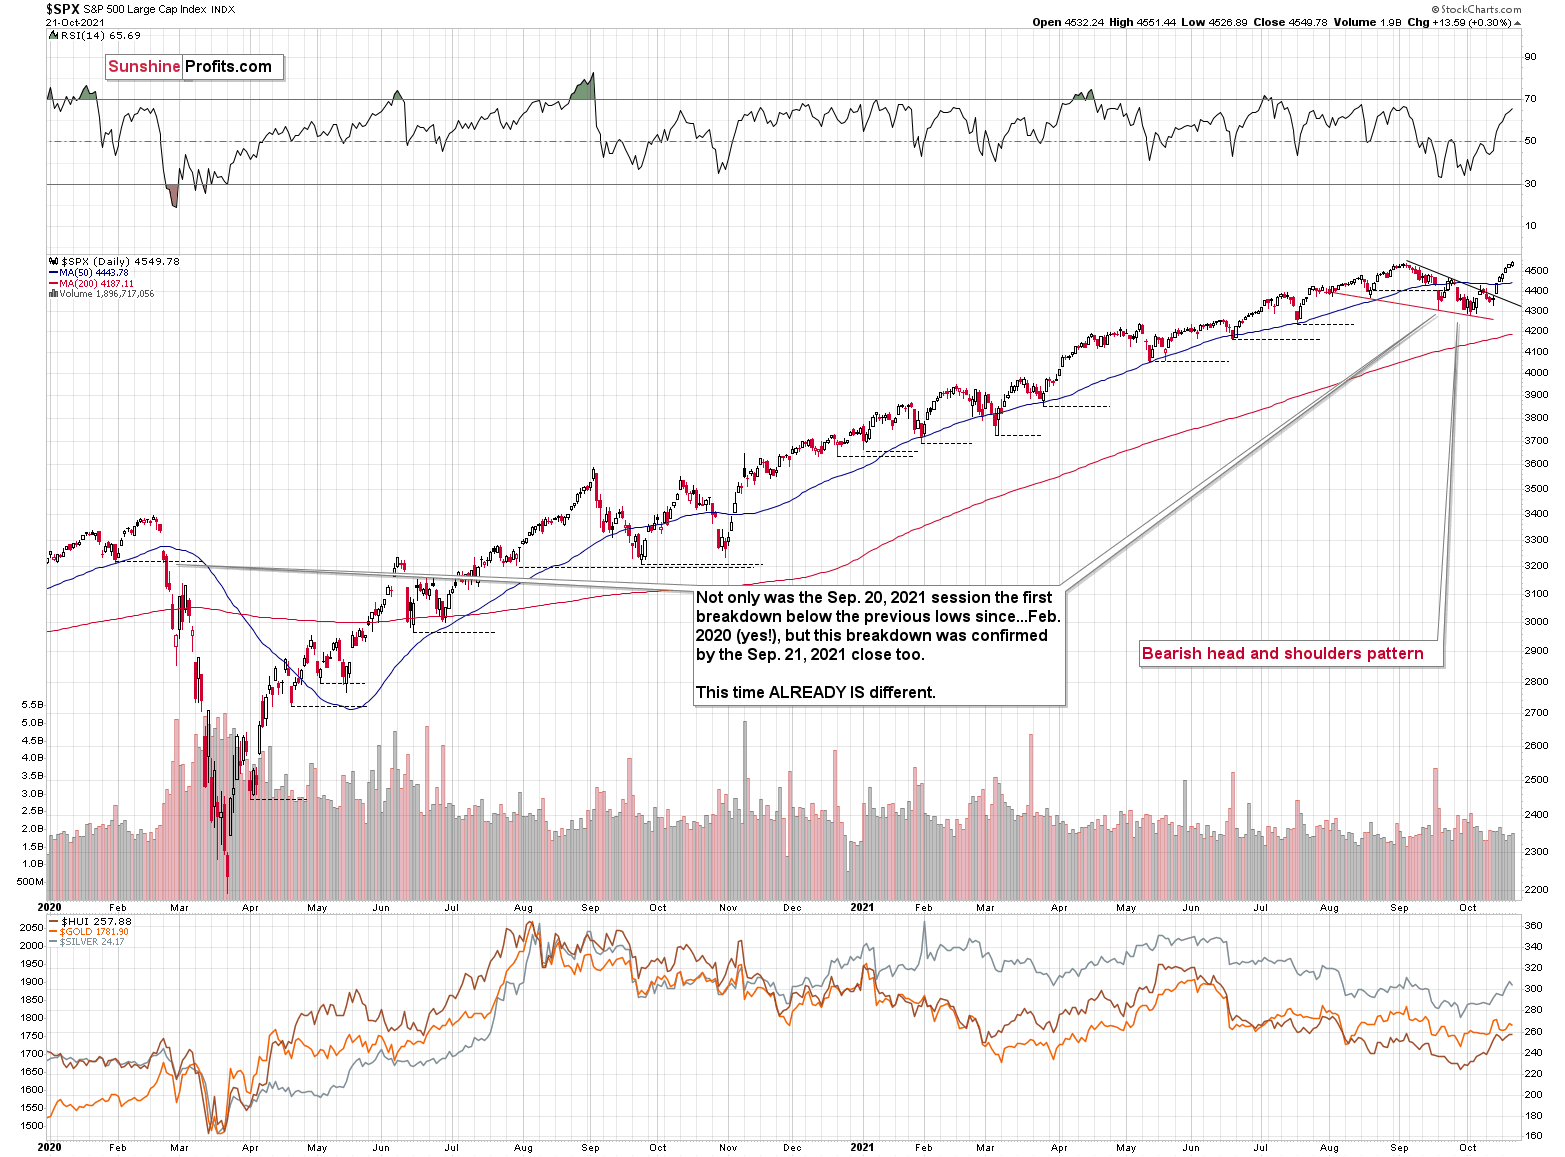
Because the S&P 500 just closed at new all-time highs; however, this move was not substantial. If stocks decline today, it might mean that the breakout will be invalidated, and invalidations of breakouts are important sell signs. Let’s keep in mind that the situation is already different than it was in the preceding months, as the September lows were finally lower than the previous local lows – something that we haven’t really seen since the March 2020 bottom.
And if stocks fall and the USD Index rallies, it will be a big bearish push to the precious metals sector, particularly to silver and mining stocks.
Having said that, let’s move to a more fundamental take on the markets.
The FOMO Rally
While the S&P 500 has demonstrated a resounding ability to shake off bad news, an epic divergence has developed between positioning and economic expectations. And while ‘fear of missing out’ (FOMO) keeps sentiment near the high-end of its range, Q3 GDP growth is projected near the low-end of its range.
For example, while the Atlanta Fed’s third-quarter GDP growth estimate was north of 5% in early September, the bank reduced the estimate to 1.3% on Oct. 5. Moreover, with the outlook even worse now, the Atlanta Fed cut its Q3 GDP growth estimate to 0.5% on Oct. 19.
Please see below:
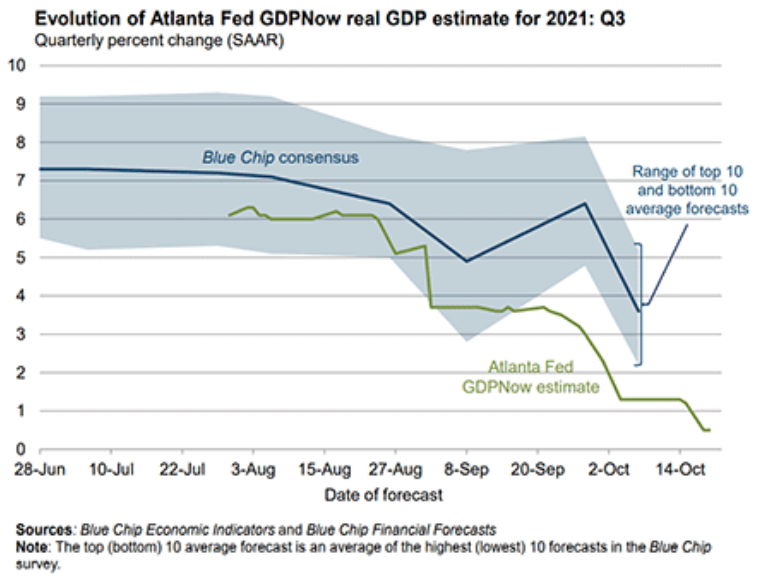
To explain, the blue line above tracks the Blue Chip consensus GDP growth estimate for the third quarter, and the shaded blue area represents the range of economists’ estimates. If you analyze the depth, you can see that economists expect a print in the ~2% to ~5.5% range. In stark contrast, the green line above tracks the Atlanta Fed’s GDPNow estimate – which has sunk like a stone and now implies 0.5% GDP growth in the third quarter.
What’s more, Bank of America also released its latest Global Fund Manager Survey on Oct. 19. And with institutional investors increasing their equity exposure when their economic expectations have turned negative for the first time in 18 months, FOMO is now on full display.
Please see below:
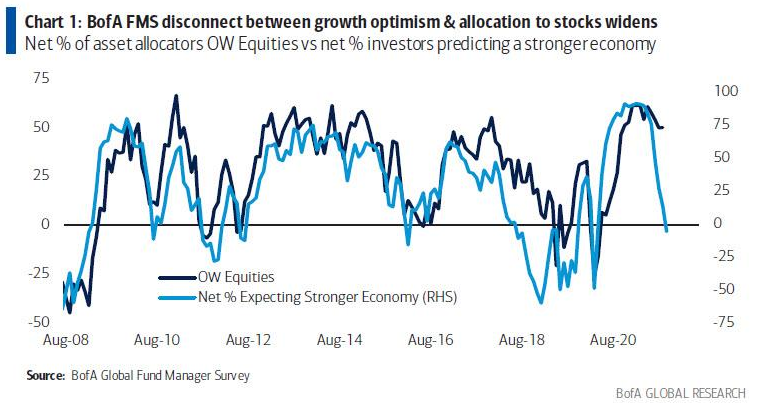
To explain, the dark blue line above tracks the net percentage of respondents that are overweight equities, while the light blue line above tracks the net percentage of respondents that expect stronger economic growth. If you analyze the right side of the chart, you can see that intuitional investors’ equity positioning still far exceeds what’s implied from economic growth prospects. As a result, if the dark blue line moves lower and reconnects with the light blue line, plenty of sell orders will hit the market.
On top of that, with stagflation fears now front and center, institutional investors are hitting the bid even when their better judgment tells them otherwise.
Please see below:
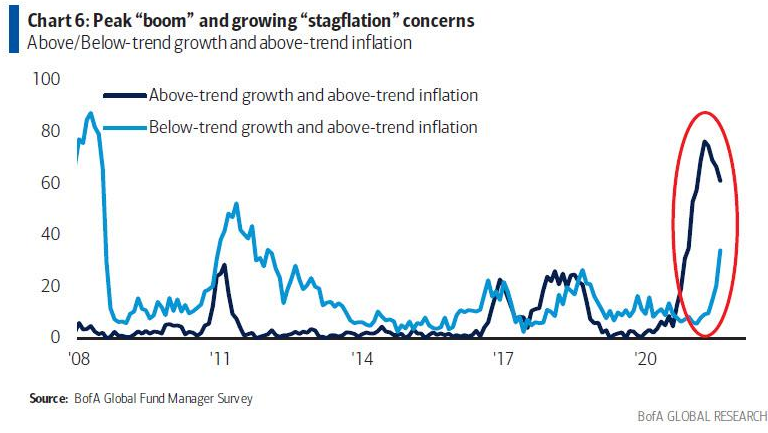
To explain, the dark blue line above tracks the net percentage of respondents that expect above-trend growth and above-trend inflation, while the light blue line above tracks the net percentage of respondents that expect below-trend growth and above-trend inflation. If you analyze the red circle on the right side of the chart, you can see that growth-with-inflation prophecies are losing momentum (the dark blue line), while fears of low growth and persistent inflation are increasing (the light blue line).
Will We See an Inflation Miracle?
Moreover, with the Fed stuck between a rock (high inflation) and a hard place (weak growth), the margin for error has dwindled and one policy mistake could bring down equities’ entire house of cards.
To that point, while I’ve been warning for months that the Fed was (and still is) materially behind the inflation curve, FOMC officials aren’t the only ones displaying inflationary anxiety.
Please see below:
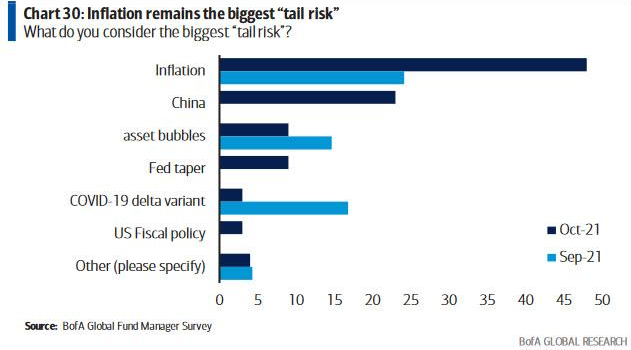
To explain, inflationary concerns have surged in October. And while the spread between institutional investors’ concerns over “Inflation” and the “Fed taper” is quite the oxymoron, persistent inflation makes another hawkish surprise even more likely. Moreover, with the death of QE unlikely to solve the inflationary conundrum on its own, the Fed will likely forecast further tightening in 2022.
To that point, slowly but surely, institutional investors are waking up to this reality. For context, Q3 earnings calls have been riddled with mentions of inflation and many CEOs that dabble in real goods have projected a further acceleration in 2022. As a result, with the “transitory” camp now suffering a death by a thousand cuts, it will likely take a miracle for the Fed’s 2022 inflation forecast to come to fruition.
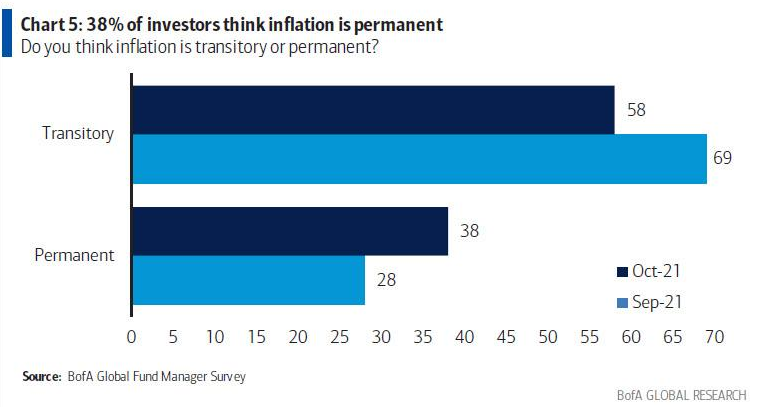
To explain, 69% (28%) of respondents viewed inflation as “transitory” (“permanent”) in September. However, the script has flipped to 58% and 38% in October. As a result, it’s likely only a matter of time before the majority of institutional investors (and the Fed) realize what’s actually happening on the ground.
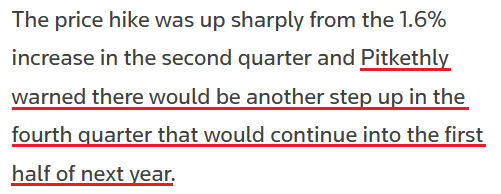
Case in point: Unilever – a consumer goods company with 149,000 employees and 400 brands that operates in more than 190 countries – released its third-quarter earnings on Oct. 21. CFO Graeme Pitkethly said that Q4 price increases should at least rival Q3 and extend into 2022:
 Source: Reuters
Moreover, Unilever CEO Alan Jope told Bloomberg on Oct. 21:
“Peak inflation will be in the first half of 2022, and it will moderate as we move towards the second half…. We continue to responsibly take pricing, and that’s in relation to the very high levels of inflation we’re seeing.”
The S&P 500 Ahead of a Deep Correction
Furthermore, I highlighted on Oct. 21 that rising commodity prices over the last month should filter into the Commodity Producer Price Index (PPI) and headline Consumer Price Index (CPI) in the coming months.
I wrote:
The commodity PPI is a reliable leading indicator of the following month’s headline Consumer CPI. And if the former stays flat for the next three months (which is unlikely) – referencing releases in November 2021, December 2021 and January 2022 – the readings will still imply year-over-year (YoY) percentage increases in the headline CPI in the 4.75% to 5.50% range.
Furthermore, this is an extremely conservative forecast since the commodity PPI has increased month-over-month (MoM) for the last 17 months. Thus, it’s more likely that the headline CPI rises above 6% YoY than it falls below 4% YoY.
To that point, Union Pacific Railroad – a shipping company that operates 8,300 locomotives in 23 U.S. states – released its third-quarter earnings on Oct. 21. And with freight revenue up by 12% and average revenue per car up by 9%, EVP Kenny Rocker said that the results reflected “strong core pricing gains and higher fuel surcharge revenue.”
More importantly, though, with the input surge intensifying “over the last 30 days,” the cost-push inflationary spiral remains alive and well, and it signals something important.
 Source: Union Pacific Railroad/ The Motley Fool
Finally, the reason why inflation is so important in terms of its direct effect on the general stock market and its indirect effect on the PMs is due to the composition of the S&P 500. With information technology and communication services stocks accounting for roughly 39% of the S&P 500’s movement, deflationary assets have been the go-to source for returns since 2009. However, if the “transitory” narrative suffers a painful death, a material unwind could ensure.
Please see below:
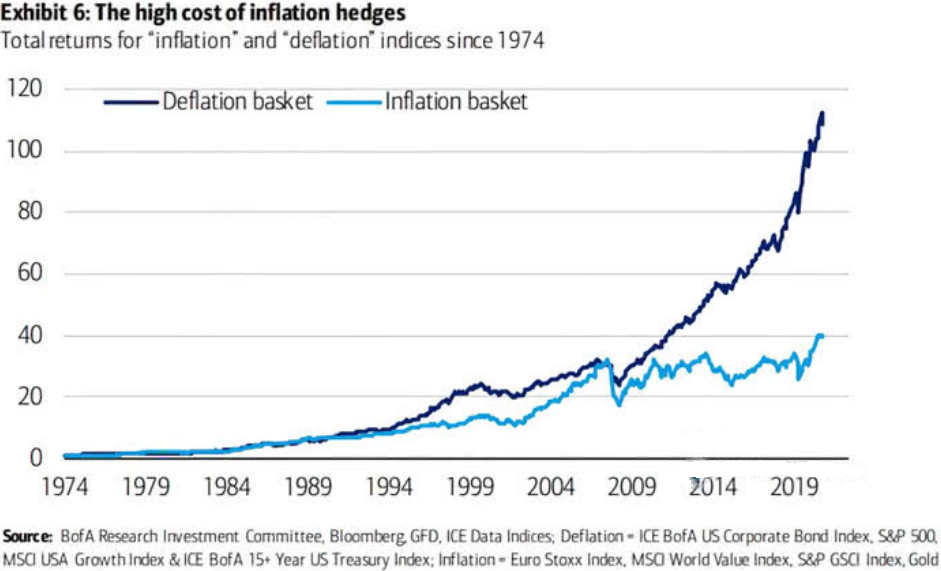
To explain, the “Deflation basket” (the dark blue line) has materially outperformed the “Inflation basket” (the light blue line) since the global financial crisis (GFC). Thus, if surging inflation encourages a reversion to the mean, immense volatility could strike the S&P 500.
The bottom line? With investors prioritizing FOMO over fundamentals, the general stock market’s recent uprising has helped uplift the PMs. However, with the Fed losing its inflation battle and the USD Index poised to benefit from more hawkish momentum over the next few months, a profound correction of the S&P 500 will only enhance the U.S. dollar’s already robust fundamentals. Moreover, with the PMs often moving inversely to the U.S. dollar, their performance should suffer along the way.
In conclusion, the PMs declined on Oct. 21, as the USD Index regained its mojo. Furthermore, the front-end of the U.S. yield curve surged (2-year yield up by 21% rounded), and the U.S. 10-Year Treasury yield closed at its highest level (1.7% rounded) since Apr. 4. Thus, while the PMs borrow confidence from the S&P 500, their fundamentals are actually deteriorating rather quickly.
Overview of the Upcoming Part of the Decline
- It seems to me that the current corrective upswing in gold is over, and the next short-term move lower is about to begin. Since it seems to be another short-term move more than it seems to be a continuation of the bigger decline, I think that junior miners would be likely to (at least initially) decline more than silver.
- It seems that the first stop for gold will be close to its previous 2021 lows, slightly below $1,700. Then it will likely correct a bit, but it’s unclear if I want to exit or reverse the current short position based on that – it depends on the number and the nature of the bullish indications that we get at that time.
- After the above-mentioned correction, we’re likely to see a powerful slide, perhaps close to the 2020 low ($1,450 - $1,500).
- If we see a situation where miners slide in a meaningful and volatile way while silver doesn’t (it just declines moderately), I plan to – once again – switch from short positions in miners to short positions in silver. At this time, it’s too early to say at what price levels this could take place, and if we get this kind of opportunity at all – perhaps with gold close to $1,600.
- I plan to exit all remaining short positions when gold shows substantial strength relative to the USD Index while the latter is still rallying. This might take place with gold close to $1,350 - $1,400. I expect silver to fall the hardest in the final part of the move. This moment (when gold performs very strongly against the rallying USD and miners are strong relative to gold after its substantial decline) is likely to be the best entry point for long-term investments, in my view. This might also happen with gold close to $1,375, but it’s too early to say with certainty at this time. I expect the final bottom to take place near the end of the year, perhaps in mid-December.
- As a confirmation for the above, I will use the (upcoming or perhaps we have already seen it?) top in the general stock market as the starting point for the three-month countdown. The reason is that after the 1929 top, gold miners declined for about three months after the general stock market started to slide. We also saw some confirmations of this theory based on the analogy to 2008. All in all, the precious metals sector is likely to bottom about three months after the general stock market tops.
- The above is based on the information available today, and it might change in the following days/weeks.
You will find my general overview of the outlook for gold on the chart below:
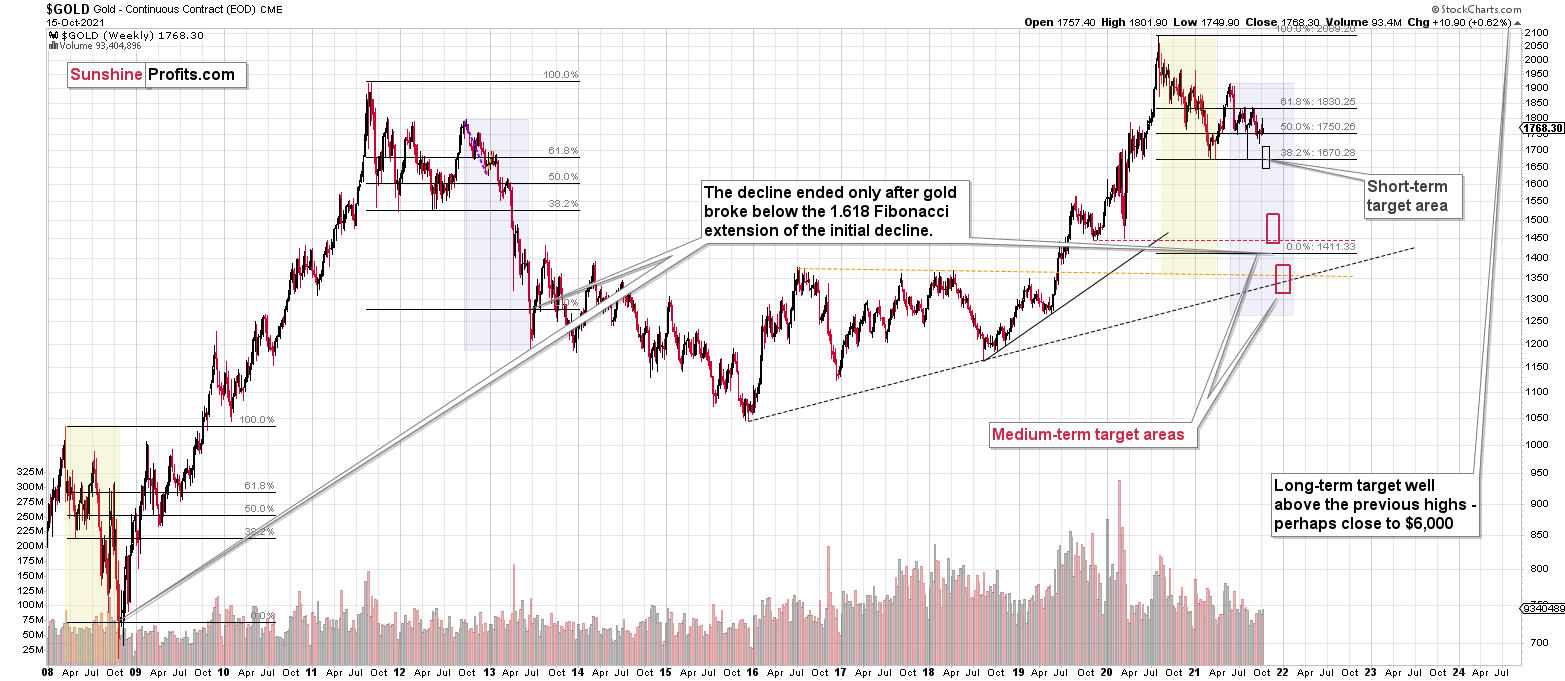
Please note that the above timing details are relatively broad and “for general overview only” – so that you know more or less what I think and how volatile I think the moves are likely to be – on an approximate basis. These time targets are not binding or clear enough for me to think that they should be used for purchasing options, warrants or similar instruments.
Letters to the Editor
Q: Now, with the S&P making new highs today, does that re-set the 3 - 3.5 month time period for gold to reach its low? The Dow & the Nasdaq have not made new highs. Does that mean the 9/2/21 high is still in place?
A: That’s a very good question. Unfortunately, the answer is not crystal clear. If we get an immediate invalidation of the breakout in the S&P 500 (for example today), then I’d say that the previous high still “counts” more. If the breakout in the S&P 500 Index is confirmed, it will be unclear as to what starting date we might use with regard to the topping countdown. If S&P 500 confirms the breakout, and either DJIA or Nasdaq confirm their breakouts as well, then we’ll need to re-adjust the countdown for this specific technique. Let’s keep in mind that it’s just one of the techniques that we’re using, and if other techniques keep pointing to a major bottom in December, it might still take place. Naturally, I’ll keep you – my subscribers – informed.
Summary
To summarize, the outlook for the precious metals sector remains extremely bearish for the next few months. Since it seems that the PMs are starting another short-term move lower more than it seems that they are continuing their bigger decline, I think that junior miners would be likely to (at least initially) decline more than silver.
From the medium-term point of view, the key two long-term factors remain the analogy to 2013 in gold and the broad head and shoulders pattern in the HUI Index. They both suggest much lower prices ahead.
It seems that our profits from the short positions are going to become truly epic in the following months.
After the sell-off (that takes gold to about $1,350 - $1,500), I expect the precious metals to rally significantly. The final part of the decline might take as little as 1-5 weeks, so it's important to stay alert to any changes.
Most importantly, please stay healthy and safe. We made a lot of money last March and this March, and it seems that we’re about to make much more on the upcoming decline, but you have to be healthy to enjoy the results.
As always, we'll keep you - our subscribers - informed.
By the way, we’re currently providing you with the possibility to extend your subscription by a year, two years, or even three years with a special 20% discount. This discount can be applied right away, without the need to wait for your next renewal – if you choose to secure your premium access and complete the payment upfront. The boring time in the PMs is definitely over, and the time to pay close attention to the market is here. Naturally, it’s your capital, and the choice is up to you, but it seems that it might be a good idea to secure more premium access now while saving 20% at the same time. Our support team will be happy to assist you in the above-described upgrade at preferential terms – if you’d like to proceed, please contact us.
To summarize:
Trading capital (supplementary part of the portfolio; our opinion): Full speculative short positions (300% of the full position) in junior mining stocks are justified from the risk to reward point of view with the following binding exit profit-take price levels:
Mining stocks (price levels for the GDXJ ETF): binding profit-take exit price: $35.73; stop-loss: none (the volatility is too big to justify a stop-loss order in case of this particular trade)
Alternatively, if one seeks leverage, we’re providing the binding profit-take levels for the JDST (2x leveraged) and GDXD (3x leveraged – which is not suggested for most traders/investors due to the significant leverage). The binding profit-take level for the JDST: $16.18; stop-loss for the JDST: none (the volatility is too big to justify a SL order in case of this particular trade); binding profit-take level for the GDXD: $32.08; stop-loss for the GDXD: none (the volatility is too big to justify a SL order in case of this particular trade).
For-your-information targets (our opinion; we continue to think that mining stocks are the preferred way of taking advantage of the upcoming price move, but if for whatever reason one wants / has to use silver or gold for this trade, we are providing the details anyway.):
Silver futures downside profit-take exit price: $19.12
SLV profit-take exit price: $17.72
ZSL profit-take exit price: $41.38
Gold futures downside profit-take exit price: $1,683
HGD.TO – alternative (Canadian) inverse 2x leveraged gold stocks ETF – the upside profit-take exit price: $12.48
Long-term capital (core part of the portfolio; our opinion): No positions (in other words: cash
Insurance capital (core part of the portfolio; our opinion): Full position
Whether you already subscribed or not, we encourage you to find out how to make the most of our alerts and read our replies to the most common alert-and-gold-trading-related questions.
Please note that we describe the situation for the day that the alert is posted in the trading section. In other words, if we are writing about a speculative position, it means that it is up-to-date on the day it was posted. We are also featuring the initial target prices to decide whether or not keeping a position on a given day is in tune with your approach (some moves are too small for medium-term traders, and some might appear too big for day-traders).
Additionally, you might want to read why our stop-loss orders are usually relatively far from the current price.
Please note that a full position doesn't mean using all of the capital for a given trade. You will find details on our thoughts on gold portfolio structuring in the Key Insights section on our website.
As a reminder - "initial target price" means exactly that - an "initial" one. It's not a price level at which we suggest closing positions. If this becomes the case (as it did in the previous trade), we will refer to these levels as levels of exit orders (exactly as we've done previously). Stop-loss levels, however, are naturally not "initial", but something that, in our opinion, might be entered as an order.
Since it is impossible to synchronize target prices and stop-loss levels for all the ETFs and ETNs with the main markets that we provide these levels for (gold, silver and mining stocks - the GDX ETF), the stop-loss levels and target prices for other ETNs and ETF (among other: UGL, GLL, AGQ, ZSL, NUGT, DUST, JNUG, JDST) are provided as supplementary, and not as "final". This means that if a stop-loss or a target level is reached for any of the "additional instruments" (GLL for instance), but not for the "main instrument" (gold in this case), we will view positions in both gold and GLL as still open, and the stop-loss for GLL will have to be moved lower. On the other hand, if gold moves to a stop-loss level but GLL doesn't, then we will view both positions (in gold and GLL) as closed. In other words, since it's not possible to be 100% certain that each related instrument moves to a given level when the underlying instrument does, we can't provide levels that would be binding. The levels that we do provide are our best estimate of the levels that will correspond to the levels in the underlying assets, but it will be the underlying assets that one will need to focus on regarding the signs pointing to closing a given position or keeping it open. We might adjust the levels in the "additional instruments" without adjusting the levels in the "main instruments", which will simply mean that we have improved our estimation of these levels, not that we changed our outlook on the markets. We are already working on a tool that would update these levels daily for the most popular ETFs, ETNs and individual mining stocks.
Our preferred ways to invest in and trade gold along with the reasoning can be found in the how to buy gold section. Furthermore, our preferred ETFs and ETNs can be found in our Gold & Silver ETF Ranking.
As a reminder, Gold & Silver Trading Alerts are posted before or on each trading day (we usually post them before the opening bell, but we don't promise doing that each day). If there's anything urgent, we will send you an additional small alert before posting the main one.
Thank you.
Przemyslaw Radomski, CFA
Founder, Editor-in-chief

