

Briefly: in our opinion, full (300% of the regular position size) speculative short positions in mining stocks are justified from the risk/reward point of view at the moment of publishing this Alert.
Taking into consideration the recent quick upswing in gold, investors are asking: “Did gold really top on Jun. 1?” And gold stocks are replying: most likely yes.
The above is the essence of what the charts are currently saying, but let’s have look in more detail.
Look at the Bigger Picture
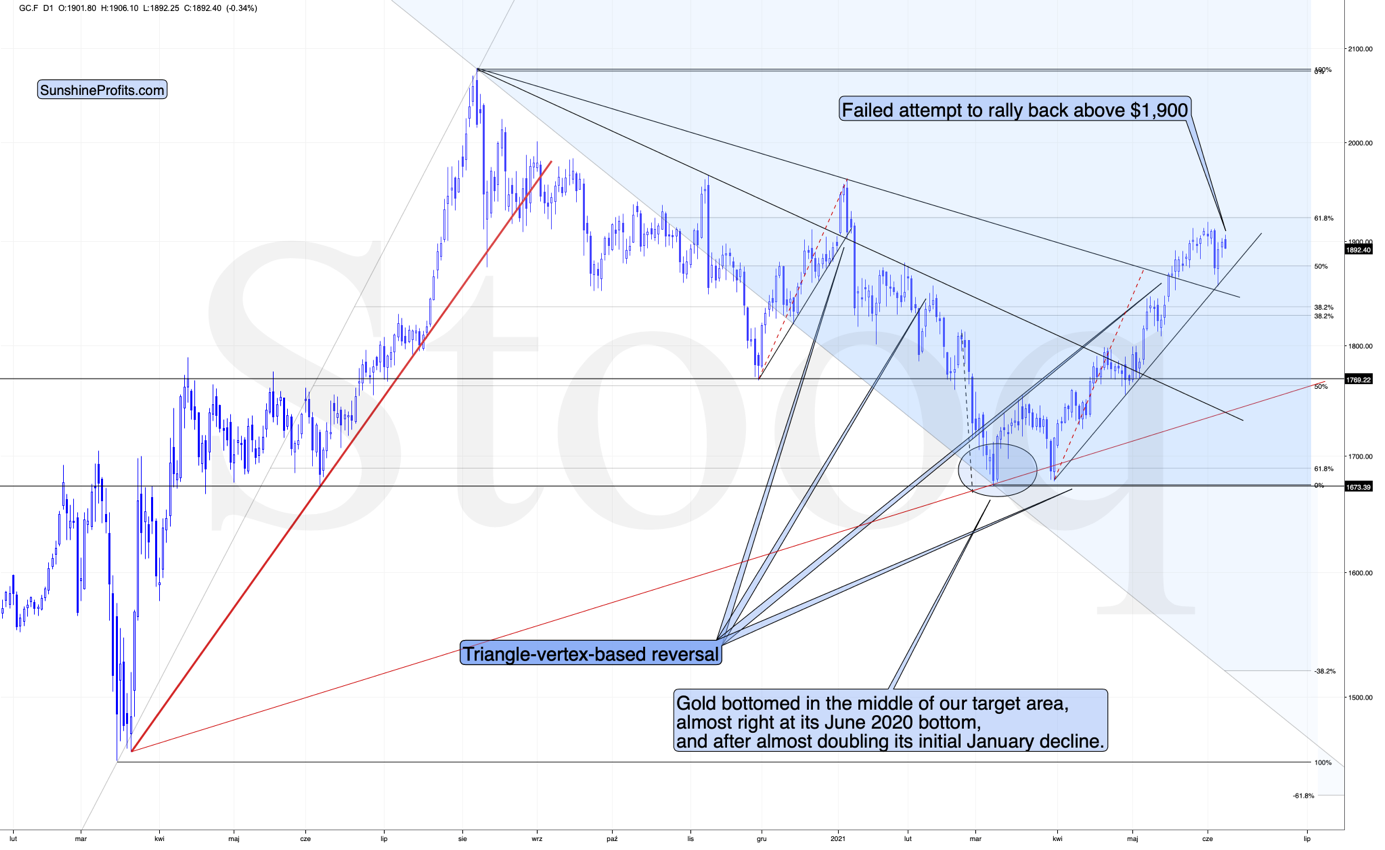
In short, gold recovered right after declining profoundly and reaching its rising support line. At this time – when looking at the above chart alone, and without considering any analogies to 2008 and 2012 – it seems that gold may move either way. Perhaps the next short-term move will be up since the rising short-term support line has held.
But this approach would be similar to saying that there is no fire in the entire forest just because the tree I’m touching right now is of normal temperature. And other key parts of the precious metals sector – gold stocks and silver – are providing us with extra insights, which are making the narrative decisively bearish.
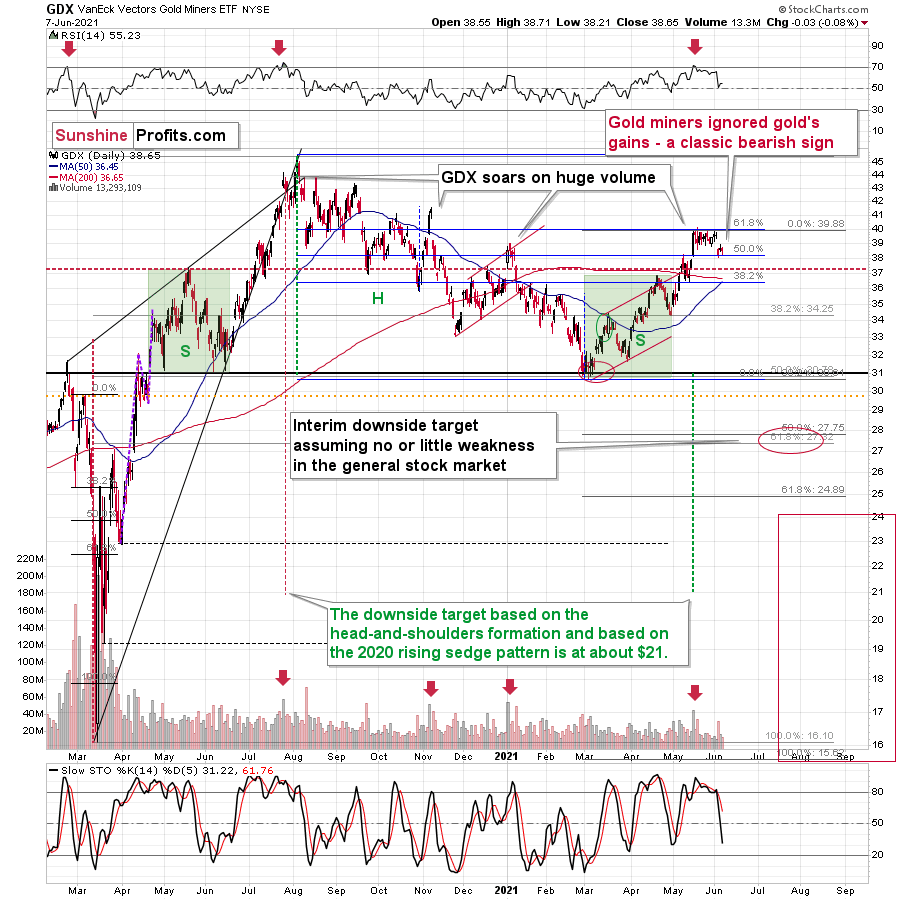
Even without considering the invalidation of the breakout to new highs, the sell signal from the RSI and stochastic indicators, and even without noticing that the GDX corrected to its 61.8% Fibonacci retracement without invalidating it, one can clearly see that gold stocks refused to follow gold higher during the most recent rebound. This is bearish and quite profoundly so.
And silver? Has it maybe indicated something that gold hasn’t?
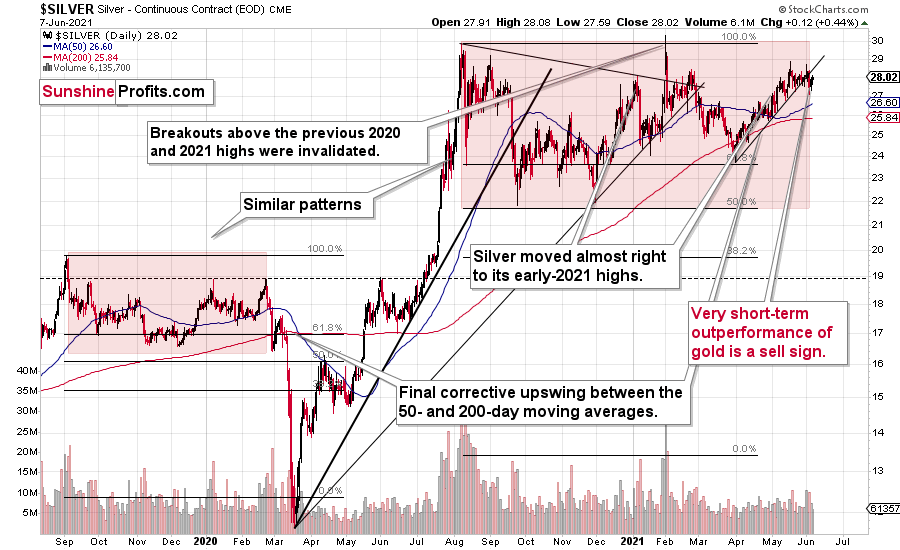
Of course it has. Silver is after a confirmed breakdown below its rising short-term support line, and this breakdown took place right after silver failed – for the fourth time – to break above its early-January high. And, more importantly, it happened shortly after silver outperformed gold on an intraday basis, just like it tends to do right at the tops.
The analogies to 2008 and 2012 in the case of gold are also quite clear:
For more context, I wrote on Jun. 4:
The analogies to how the situation in gold developed in 2008 and 2012, provides us with an extremely bearish price prediction for gold. Many other factors are pointing to these similarities, and two of them are the size of the correction relative to the preceding decline and to the previous rally. In 2012 and 2008, gold corrected to approximately the 61.8% Fibonacci retracement level. Gold was very close to this level this year, and since the history tends to rhyme more than it tends to repeat itself to the letter, it seems that the top might already be in.
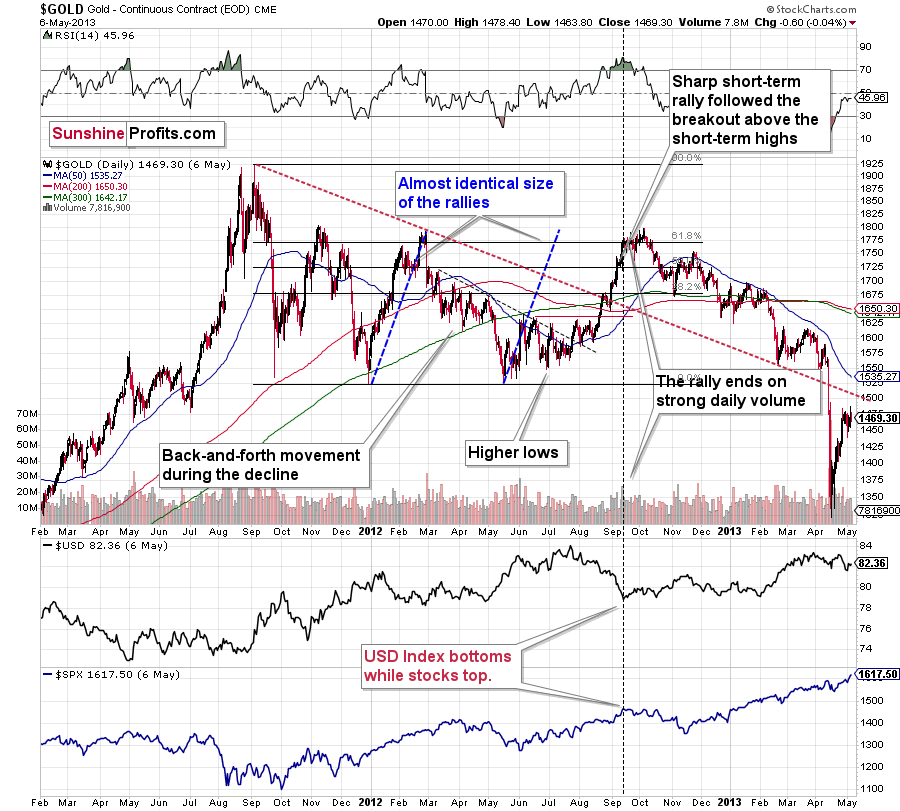
In both years, 2008 and 2012, there were three tops. Furthermore, the rallies that took gold to the second and third top were similar. In 2008, the rally preceding the third top was bigger than the rally preceding the second top. In 2012, they were more or less equal. I marked those rallies with blue lines in the above chart – the current situation is very much in between the above-mentioned situations. Also, the current rally is bigger than the one that ended in early January 2021 but not significantly so.
Remember what happened when gold previously attempted to break above major long-term highs? It was in 2008 and gold was breaking above its 1980 high. Gold wasn’t ready to truly continue its bull market without plunging first. This downswing was truly epic, especially in the case of silver and mining stocks; and now even gold’s price patterns are like what we saw in 2008.
My previous comments on the analogies to 2008 and 2012 remain up-to-date:

Back in 2008, gold corrected to 61.8% Fibonacci retracement, but it stopped rallying approximately when the USD Index started to rally, and the general stock market accelerated its decline.
Taking into consideration that the general stock market has probably just topped, and the USD Index is about to rally, then gold is likely to slide for the final time in the following weeks/months. Both above-mentioned markets support this bearish scenario and so do the self-similar patterns in terms of gold price itself.
What would change my mind with regard to gold itself? Perhaps if it broke above its January 2021 highs and confirmed this breakout. This would be an important technical indication on its own, but it would also be something very different from what happened in 2008 and 2012. If that happened along with strength in mining stocks, it would be very bullish. Still, if the above happened, and miners didn’t react at all or they declined, it would not be bullish despite the gains in the gold price itself.
The March 2021 low formed well below the previous low, but as far as other things are concerned, the current situation is similar to what happened in 2012.
The relatively broad bottom with higher lows is what preceded both final short-term rallies – the current one, and the 2012 one. Their shape as well as the shape of the decline that preceded these broad bottoms is very similar. In both cases, the preceding decline had some back-and-forth trading in its middle, and the final rally picked up pace after breaking above the initial short-term high.
Interestingly, the 2012 rally ended on huge volume, which is exactly what we saw also on May 19 this year. Consequently, forecasting much higher silver or gold prices here doesn’t seem to be justified based on the historical analogies.
The thing I would like to emphasize here is that gold didn’t form the final top at the huge-volume reversal on Sep. 13, 2012. It moved back and forth for a while and moved a bit above that high-volume top, and only then the final top took place (in early October 2012).
The same happened in September and in October 2008. Gold reversed on huge volume in mid-September, and it was approximately the end of the rally. The final top, however, formed after some back-and-forth trading and a move slightly above the previous high.
Consequently, the fact that gold moved a bit above its own high-volume reversal (May 19, 2021) is not an invalidation of the analogy, but rather its continuation.
Moreover, back in 2008 and 2012, gold corrected to its 61.8% Fibonacci retracement before sliding profoundly for the last time. That’s almost exactly what we saw on June 1. Gold was just about $4 away from the 61.8% retracement, which means that it was practically right at it given the long-term point of view.
On top of that, with the Fed’s confidence game won or lost by whether or not inflation proves “transitory,” wouldn’t the central bank appreciate lower gold prices? If you think about it, it would be awfully convenient for the price of gold to decline in order to prove the point of the transitory nature of inflation.
Now, as you know, I’m not a fan of all the conspiracy theories that are out there, and I’m not the first to shout gold manipulation or silver manipulation every time the yellow or while metal goes down, but I also know that being realistic is one of my strengths. With the situation being what it is, and since the communities of top investment bankers and the community of officials interlace, I think that we have yet another reason to expect that the gold price is going to slide in the following weeks/months.
In addition, while gold has reached its dashed rising support line, the implications of its triangle-vertex-based reversal points remain much more significant. To that point, even if the yellow metal rises to the 61.8% Fibonacci level, it doesn’t change the medium-term outlook. For context, gold rallied to the 61.8% Fibonacci level in 2012 before suffering a profound drawdown. The bottom line? While short-term strength is not my base case, if gold happens to bounce, it’s likely the last “hurrah!” before the yellow metal succumbs to the bearish reality.
Moreover, do you know what else happened in 2008 and 2012 when gold topped? Gold stocks had been underperforming gold, and they had actually started their decline sooner. That’s exactly what we are seeing right now, and that’s what the most recent lack of strength in gold stocks confirms.
The history is rhyming, and the next huge move in gold is not likely to be to the upside; we should rather prepare for a slide.
Having said that, let’s take a look at the markets from a more fundamental angle.
Don't Tell Anyone
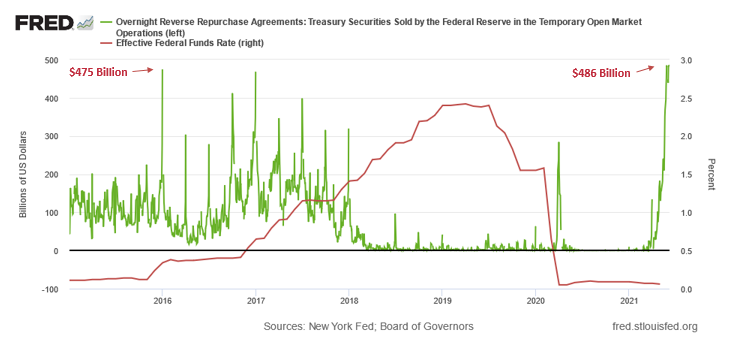
For weeks, I’ve been warning that the U.S. Federal Reserve’s (FED) reverse-repo nightmare signals that a major policy shift will likely occur in the coming months. And with the reverse repurchase agreements hitting a new all-time high on Jun. 7, the taper talk is slowly moving from warm to hot.
Please see below:
To explain the significance, I wrote previously:
A reverse repurchase agreement (repo) occurs when an institution offloads cash to the FED in exchange for a Treasury security (on an overnight or short-term basis). And with U.S. financial institutions currently flooded with excess liquidity, they’re shipping cash to the FED at an alarming rate.
The green line above tracks the daily reverse repo transactions executed by the FED, while the red line above tracks the U.S. federal funds rate. Moreover, notice what happened the last time reverse repos moved above 400 billion? If you focus your attention on the red line, you can see that after the $400 billion level was breached in December 2015, the FED’s rate-hike cycle began. Thus, with current inflation dwarfing 2015 levels and U.S. banks practically throwing cash at the FED, is this time really different?
Even more revealing, U.S. government officials are now subtly warning investors of what’s to come. Case in point: U.S. Treasury Secretary Janet Yellen said on May 4 that interest rates would likely have to rise.
Please see below:
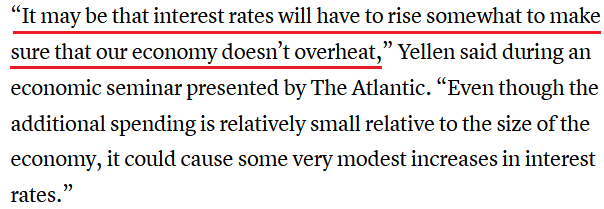 Source: CNBC
However, after the U.S. stock market turned into a sea of red, Yellen walked back her comments and told the Wall Street Journal (WSJ) – on the very same day – that “I don’t think there’s going to be an inflationary problem, but if there is, the Fed can be counted on to address it.”
And as the merry-go-round turns, the U.S. Treasury Secretary told Bloomberg on Jun. 6 that “If we ended up with a slightly higher interest rate environment, it would actually be a plus for society’s point of view and the Fed’s point of view.”
A “plus?” Really? If it wasn’t clear before, it should be clear now that U.S. officials are slowly bracing investors for the inevitable taper. To that point, I reiterated on several occasions that the FED, and other branches of the U.S. government that seek to influence the financial markets, are playing a confidence game. And as long as investors believe in their omniscience, they will behave accordingly. However, with the narrative officially shifting from inflation being “transitory” to higher inflation and higher interest rates being “a plus” for society, the up-is-down marketing campaign is likely the final nail in QE’s coffin.
Please see below:
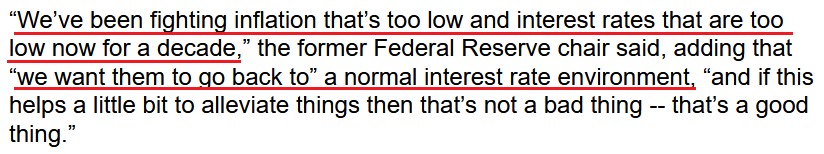 Source: Bloomberg/Janet Yellen
As another point of reference, I warned on May 26 that FED Vice Chairman Richard Clarida already revealed the central bank’s hand.
I wrote:
Notice how a sudden change in tone has morphed into increasingly hawkish rhetoric?
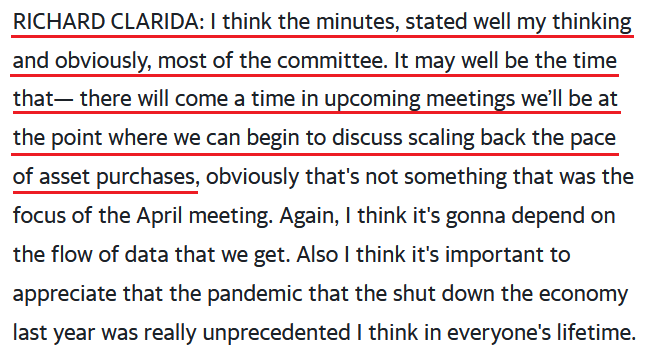 Source: Yahoo! Finance
Moreover, did you notice the unintentional slip? “It may well be the time.” While he paused and caught himself by clarifying “there will come a time,” he essentially let the cat out of the bag.
If that wasn’t enough, when CNBC jumps on the bandwagon, the minority becomes the consensus. And with Monday’s (Jun. 7) headline speaking volumes, taper talk has officially gone mainstream.
 Source: CNBC
The Number of Concerned Voices Increases
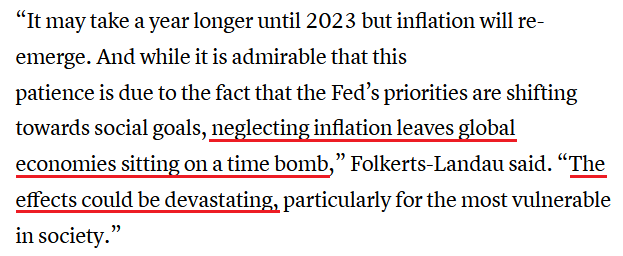
Adding to the FED’s ills, Deutsche Bank has sounded the alarm on inflation. For context, we don’t believe that 1970’s-style inflation is in the cards because the FED can solve the problem by reducing its asset purchases and raising interest rates. However, if the FED refuses to accept these difficult but necessary solutions (which we find extremely unlikely), then all bets are off.
“The consequence of delay will be greater disruption of economic and financial activity than would otherwise be the case when the Fed does finally act,” Deutsche Bank’s chief economist, David Folkerts-Landau, and others wrote. “In turn, this could create a significant recession and set off a chain of financial distress around the world, particularly in emerging markets.”
In addition, the bank’s strategists added:
 Source: CNBC
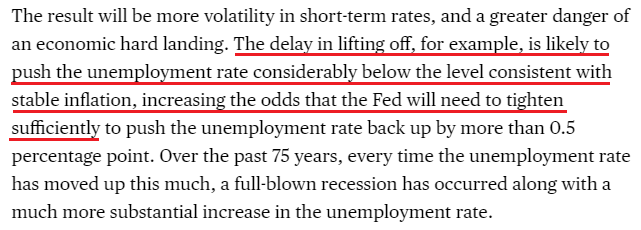
Also, warning of potential upheaval, former New York FED President William Dudley titled his Jun. 7 Bloomberg Opinion piece: “The Fed Is Risking a Full-Blown Recession.”
He wrote:
“The U.S. Federal Reserve’s new approach to managing inflation, unveiled last summer, makes a lot of sense…. But, unfortunately, the way the Fed is putting this long-term monetary policy framework into practice is likely to result in more volatile interest rates and more risk of recession.”
He added:
 Source: Bloomberg
For context, I warned on Jun. 3 that U.S. nonfarm payrolls optimism would likely end in disappointment. With enhanced unemployment benefits still in effect until mid-to-late June or early July (across ~25 states) – and nationwide until Sep. 6 (expected) – U.S. citizens are in no rush to reenter the workforce. However, once the benefits cliff is reached, U.S. nonfarm payrolls should move sharply higher in August (reflecting July’s data) and September (reflecting August’s data).
Please see below:
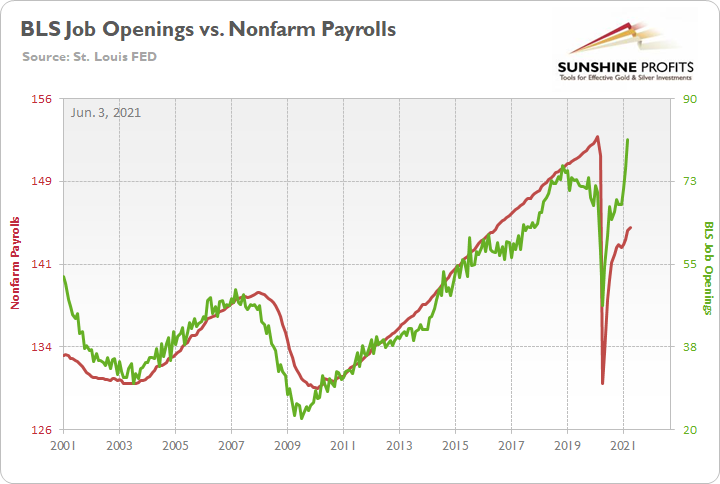
To explain, the red line above tracks U.S. nonfarm payrolls, while the green line above tracks the U.S. job openings tallied by the U.S. Bureau of Labor Statistics (BLS). If you analyze the relationship, you can see that the latter is often a strong predictor of the former. Moreover, while some cite COVID-19, unfair pay and lack of childcare options (all valid concerns) as reasons for high U.S. unemployment, the gap on the right side of the chart signals that when the U.S. government pays individuals more than their employers, the incentive to find work completely evaporates.
Adding his voice to the FED’s chorus of boos, Roger Bootle, founder of Capital Economics and the author of “The Death of Inflation: Surviving and Thriving in the Zero Era.,” initially declared inflation dead in the mid-1990s. However, with the British economist telling Bloomberg on Jun. 2 that “the danger of deflation has passed and the risks have definitely tilted in the other direction,” the FED is facing resistance like never before.
Please see below:
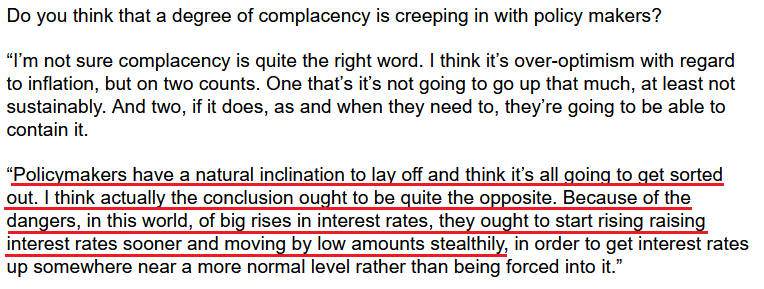 Source: Bloomberg
The Perfect Inflation Storm
In addition, I’ve been highlighting for months that the inflationary pressures are a function of cost-push inflation and not demand-pull inflation.
To explain the difference, I wrote on Apr. 27:
It’s important to remember that two different paths can lead to the same destination. On one side of the road, you have demand-pull inflation: this occurs when unemployment is low, prosperity is high, wages are rising and corporate profits follow suit. On the other side of the road, cost-push inflation occurs when demand is soft, but rising input costs lead to price hikes by corporate executives. Think about it: when faced with a dilemma of accepting lower profit margins or raising output prices, which path do you think they’ll choose?
And confirming my expectations, rampant speculation across the commodities market has resulted in raw materials enjoying their best performance on record.
Please see below:
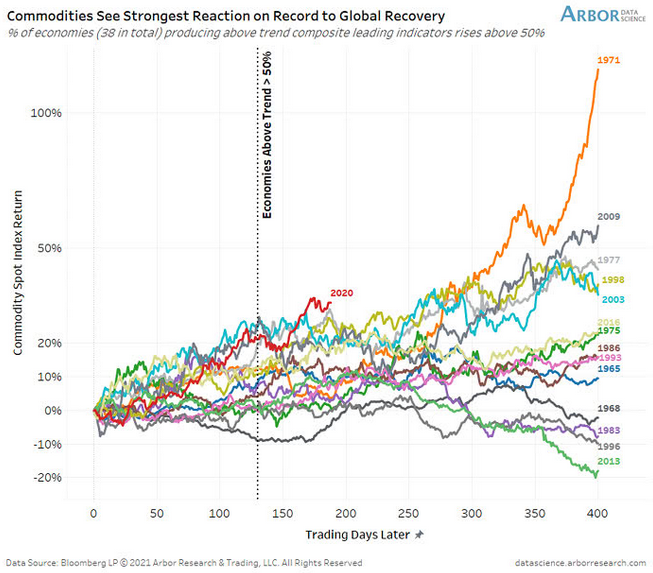
To explain, the various lines above track the performance of commodities during global recoveries. If you focus your attention on the red line in the middle (2020), you can see that the current surge is outpacing all other historical analogues. Moreover, with the speculative frenzy driven by excessive monetary easing, if FED officials don’t tighten financial conditions, speculators won’t do it for them (just look at meme stocks like AMC).
On the flip side, with personal savings still abnormally high, pent-up demand bubbling due to vaccination progress and Democrats and Republicans hammering out another ~$1 trillion infrastructure package, demand-pull inflation could help create a perfect storm.
Case in point: with the service sector suffering the brunt of COVID-19’s wrath, manufacturing and raw materials have been responsible for the inflationary surge. However, with the former now making a comeback, average hourly earnings (released on Jun. 4) for production and nonsupervisory employees within the leisure and hospitality industries have completely skyrocketed. For context, professionals within these industries include (but are not limited to) warehouse workers, drivers, beauticians, restaurant workers, nurses, social workers, lawyers and accountants.
Please see below:
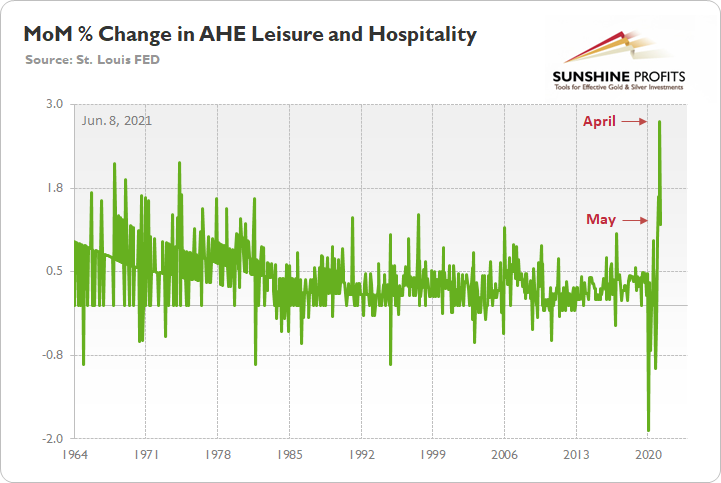
To explain, the green line above tracks the month-over-month (MoM) percentage change in the average hourly earnings for employees within the above-mentioned industries (remember, MoM ensures no base effect). More importantly, though, if you analyze the right side of the chart, you can see that April’s print was an all-time high and that May’s print was the highest since 1997.
The PMs Are Walking a Tightrope
As further evidence, The Conference Board released its Employment Trends Index (ETI) on Jun. 7. For context, the ETI is compiled using eight leading employment indicators and often marks turning points in the U.S. labor market.
Please see below:
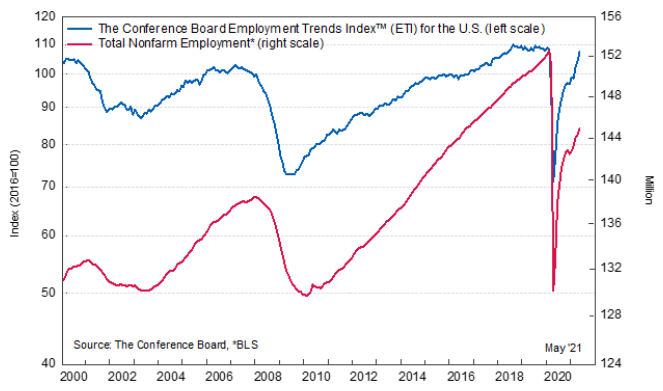
Moreover, Gad Levanon, the Head of The Conference Board Labor Markets Institute, revealed that wage inflation is surging and that “marked acceleration” in the ETI supports our thesis that U.S. nonfarm payrolls will likely spike in August and September.
Please see below:
 Source: The Conference Board
Finally, with the U.S. 10-Year Treasury yield and the USD Index waiting for the FED’s decision, the PMs are walking a tightrope that will likely end with an epic fall. For context, the European Central Bank (ECB) holds its next policy meeting on Jun. 10, the FED holds its next policy meeting on Jun. 15/16 and the Consumer Price Index (CPI) is also scheduled for release on Jun. 10. And while uncertainty has sedated global 10-year yields – with volatility at its lowest level since 1995 (depicted by the three-month high-low spread of 10.5 basis points at the bottom right of the chart below) – it will only take one crack to break the entire dam.

In conclusion, the ground is slowly shifting beneath the PMs’ feet, and the fundamentals signal a material reversal in the coming months. As strength in the labor market further supports the U.S. 10-Year Treasury yield and the USD Index, the end of enhanced unemployment benefits should be a significant upside catalyst. And with U.S. citizens confronted with the dilemma of getting a job or forgoing income, which option do you think they’ll choose? More importantly, though, with rising U.S. nonfarm payrolls likely to coincide with a major shift in FED policy, not only is liquidity already being drained from the system (reverse repos), but the dry season has only just begun. The bottom line? With record imbalances across the U.S. Treasury market poised to reverse in the coming months, the PMs’ optimism will likely reverse right along with them. At least for several months.
Overview of the Upcoming Part of the Decline
- It seems likely to me that the current corrective upswing is very close to being over, given gold’s similarity to what happened in 2012, USD’s similarity to 2016 and the situation in the general stock market.
- After miners slide once again in a meaningful and volatile way, but silver doesn’t (and it just declines moderately), I plan to switch from short positions in miners to short positions in silver (this could take another 1-2 weeks to materialize). I plan to exit those short positions when gold shows substantial strength relative to the USD Index, while the latter is still rallying. This might take place with gold close to $1,450 - $1,500 and the entire decline (from above $1,700 to about $1,475) would be likely to take place within 1-12 weeks, and I would expect silver to fall hardest in the final part of the move. This moment (when gold performs very strongly against the rallying USD and miners are strong relative to gold – after gold has already declined substantially) is likely to be the best entry point for long-term investments, in my view. This might happen with gold close to $1,475, but it’s too early to say with certainty at this time. In other words, the entire decline could take between 1 and 12 weeks, with silver declines occurring particularly fast in the final 1-2 weeks.
- If gold declines even below $1,500 (say, to ~$1350 or so), then it could take another 10 weeks or so for it to bottom, but this is not what I view as a very likely outcome.
- As a confirmation for the above, I will use the (upcoming or perhaps we have already seen it?) top in the general stock market as the starting point for the three-month countdown. The reason is that after the 1929 top, gold miners declined for about three months after the general stock market started to slide. We also saw some confirmations of this theory based on the analogy to 2008. All in all, the precious metals sector would be likely to bottom about three months after the general stock market tops. If the general stock market puts the final top in the first half of May (which seems quite likely given NASDAQ’s top in late April), then we might expect the precious metals sector to bottom sometime in August.
- The above is based on the information available today, and it might change in the following days/weeks.
Please note that the above timing details are relatively broad and “for general overview only” – so that you know more or less what I think and how volatile I think the moves are likely to be – on an approximate basis. These time targets are not binding or clear enough for me to think that they should be used for purchasing options, warrants or similar instruments.
Summary
To summarize, it seems likely to me that the corrective upswing is over, given gold’s similarity to what happened in 2012 and 2018 and its turnaround at the double triangle-vertex-based reversal point, USD’s similarity to 2016, action in the silver, and gold miners, and the situation in the general stock market.
After the sell-off (that takes gold to about $1,350 - $1,500), we expect the precious metals to rally significantly. The final part of the decline might take as little as 1-5 weeks, so it's important to stay alert to any changes.
Most importantly, please stay healthy and safe. We made a lot of money last March and this March, and it seems that we’re about to make much more on the upcoming decline, but you have to be healthy to enjoy the results.
On a different note, over a month ago, I wrote that as a bonus gift, we’ll provide you with a month of free access to Rafael Zorabedian’s (our new Stock Trading Strategist) Stock Trading Alerts. And we actually overdelivered as you had access to those premium comments up to yesterday. I trust that you enjoyed them because they generated quite sizable returns for just one month of service.
During this time, Rafael’s call on the GRID resulted in about 5% of unleveraged profits, Rafael’s call on the ERTH resulted in about 11% of unleveraged profits and Rafael’s call on the QTUM resulted in about 6% of unleveraged profits. You will find more details in yesterday’s article from Rafael. The quick promotion for Rafael’s Stock Trading Alerts that allows you to subscribe for $9 for the first 2 weeks of service, is still active. If you enjoyed the results of Rafael’s work, this seems like a great option – if you continue to enjoy it, then great, profit from it. If not, you can simply cancel before the renewal. It seems to me that the former is much more likely, though. Please use the following link to continue using Rafael’s premium Stock Trading Alerts at these preferred terms ($9 for the first 2 weeks):
https://www.sunshineprofits.com/subscriptions/available-to-buy-products/
As always, we'll keep you - our subscribers - informed.
To summarize:
Trading capital (supplementary part of the portfolio; our opinion): Full speculative short positions (300% of the full position) in mining stocks are justified from the risk to reward point of view with the following binding exit profit-take price levels:
Mining stocks (price levels for the GDXJ ETF): binding profit-take exit price: $24.12; stop-loss: none (the volatility is too big to justify a stop-loss order in case of this particular trade)
Alternatively, if one seeks leverage, we’re providing the binding profit-take levels for the JDST (2x leveraged) and GDXD (3x leveraged – which is not suggested for most traders/investors due to the significant leverage). The binding profit-take level for the JDST: $39.87; stop-loss for the JDST: none (the volatility is too big to justify a SL order in case of this particular trade); binding profit-take level for the GDXD: $94.87; stop-loss for the GDXD: none (the volatility is too big to justify a SL order in case of this particular trade).
For-your-information targets (our opinion; we continue to think that mining stocks are the preferred way of taking advantage of the upcoming price move, but if for whatever reason one wants / has to use silver or gold for this trade, we are providing the details anyway.):
Silver futures upside profit-take exit price: unclear at this time - initially, it might be a good idea to exit, when gold moves to $1,512.
Gold futures upside profit-take exit price: $1,512.
Long-term capital (core part of the portfolio; our opinion): No positions (in other words: cash
Insurance capital (core part of the portfolio; our opinion): Full position
Whether you already subscribed or not, we encourage you to find out how to make the most of our alerts and read our replies to the most common alert-and-gold-trading-related-questions.
Please note that we describe the situation for the day that the alert is posted in the trading section. In other words, if we are writing about a speculative position, it means that it is up-to-date on the day it was posted. We are also featuring the initial target prices to decide whether keeping a position on a given day is in tune with your approach (some moves are too small for medium-term traders, and some might appear too big for day-traders).
Additionally, you might want to read why our stop-loss orders are usually relatively far from the current price.
Please note that a full position doesn't mean using all of the capital for a given trade. You will find details on our thoughts on gold portfolio structuring in the Key Insights section on our website.
As a reminder - "initial target price" means exactly that - an "initial" one. It's not a price level at which we suggest closing positions. If this becomes the case (like it did in the previous trade), we will refer to these levels as levels of exit orders (exactly as we've done previously). Stop-loss levels, however, are naturally not "initial", but something that, in our opinion, might be entered as an order.
Since it is impossible to synchronize target prices and stop-loss levels for all the ETFs and ETNs with the main markets that we provide these levels for (gold, silver and mining stocks - the GDX ETF), the stop-loss levels and target prices for other ETNs and ETF (among other: UGL, GLL, AGQ, ZSL, NUGT, DUST, JNUG, JDST) are provided as supplementary, and not as "final". This means that if a stop-loss or a target level is reached for any of the "additional instruments" (GLL for instance), but not for the "main instrument" (gold in this case), we will view positions in both gold and GLL as still open and the stop-loss for GLL would have to be moved lower. On the other hand, if gold moves to a stop-loss level but GLL doesn't, then we will view both positions (in gold and GLL) as closed. In other words, since it's not possible to be 100% certain that each related instrument moves to a given level when the underlying instrument does, we can't provide levels that would be binding. The levels that we do provide are our best estimate of the levels that will correspond to the levels in the underlying assets, but it will be the underlying assets that one will need to focus on regarding the signs pointing to closing a given position or keeping it open. We might adjust the levels in the "additional instruments" without adjusting the levels in the "main instruments", which will simply mean that we have improved our estimation of these levels, not that we changed our outlook on the markets. We are already working on a tool that would update these levels daily for the most popular ETFs, ETNs and individual mining stocks.
Our preferred ways to invest in and to trade gold along with the reasoning can be found in the how to buy gold section. Furthermore, our preferred ETFs and ETNs can be found in our Gold & Silver ETF Ranking.
As a reminder, Gold & Silver Trading Alerts are posted before or on each trading day (we usually post them before the opening bell, but we don't promise doing that each day). If there's anything urgent, we will send you an additional small alert before posting the main one.
Thank you.
Przemyslaw Radomski, CFA
Founder, Editor-in-chief

