

Briefly: in our opinion, full (200% of the regular size of the position) speculative short positions in gold, silver and mining stocks are justified from the risk/reward perspective at the moment of publishing this alert. We are moving the targets lower and we are turning them into binding profit-take prices.
And so it happened. After a breakdown that might have appeared accidental as it was triggered mostly by one company’s decline, we saw a weekly close below the key 61.8% Fibonacci retracement level in the HUI Index. There was no analogous breakdown to new lows in gold and silver, but what happened in these markets on a relative basis was even more significant.
Let’s move right into the charts, starting with the confirmation of the breakdown in the HUI Index (charts courtesy of http://stockcharts.com).
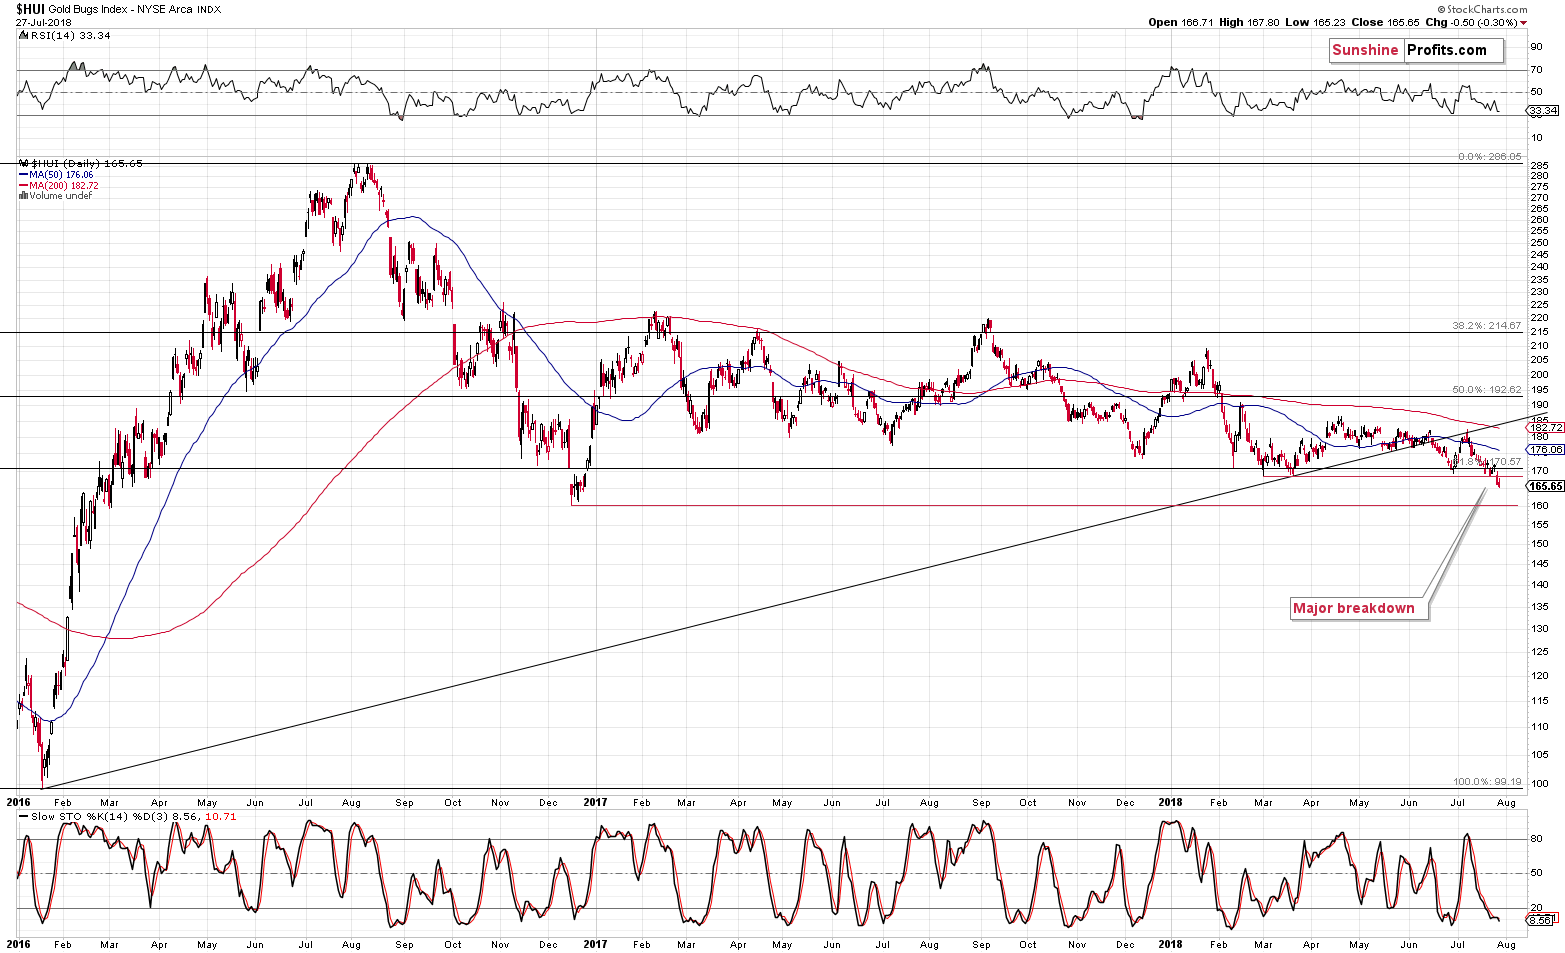
Theoretically, it takes three consecutive trading days to confirm a breakdown, but since weekly closing prices are generally more important than the daily ones, we can say that the move was practically confirmed. This is especially the case since gold actually provided a reason for gold stocks to rally by moving higher in the middle of Friday’s session. Gold miners didn’t perform well even despite that. This tells us that the breakdown was no accident – it shows true weakness and emphasizes that the way in which the precious metals market wants to move in the following weeks is down.
Speaking of the gold stocks’ underperformance, let’s take a look at the relative chart.
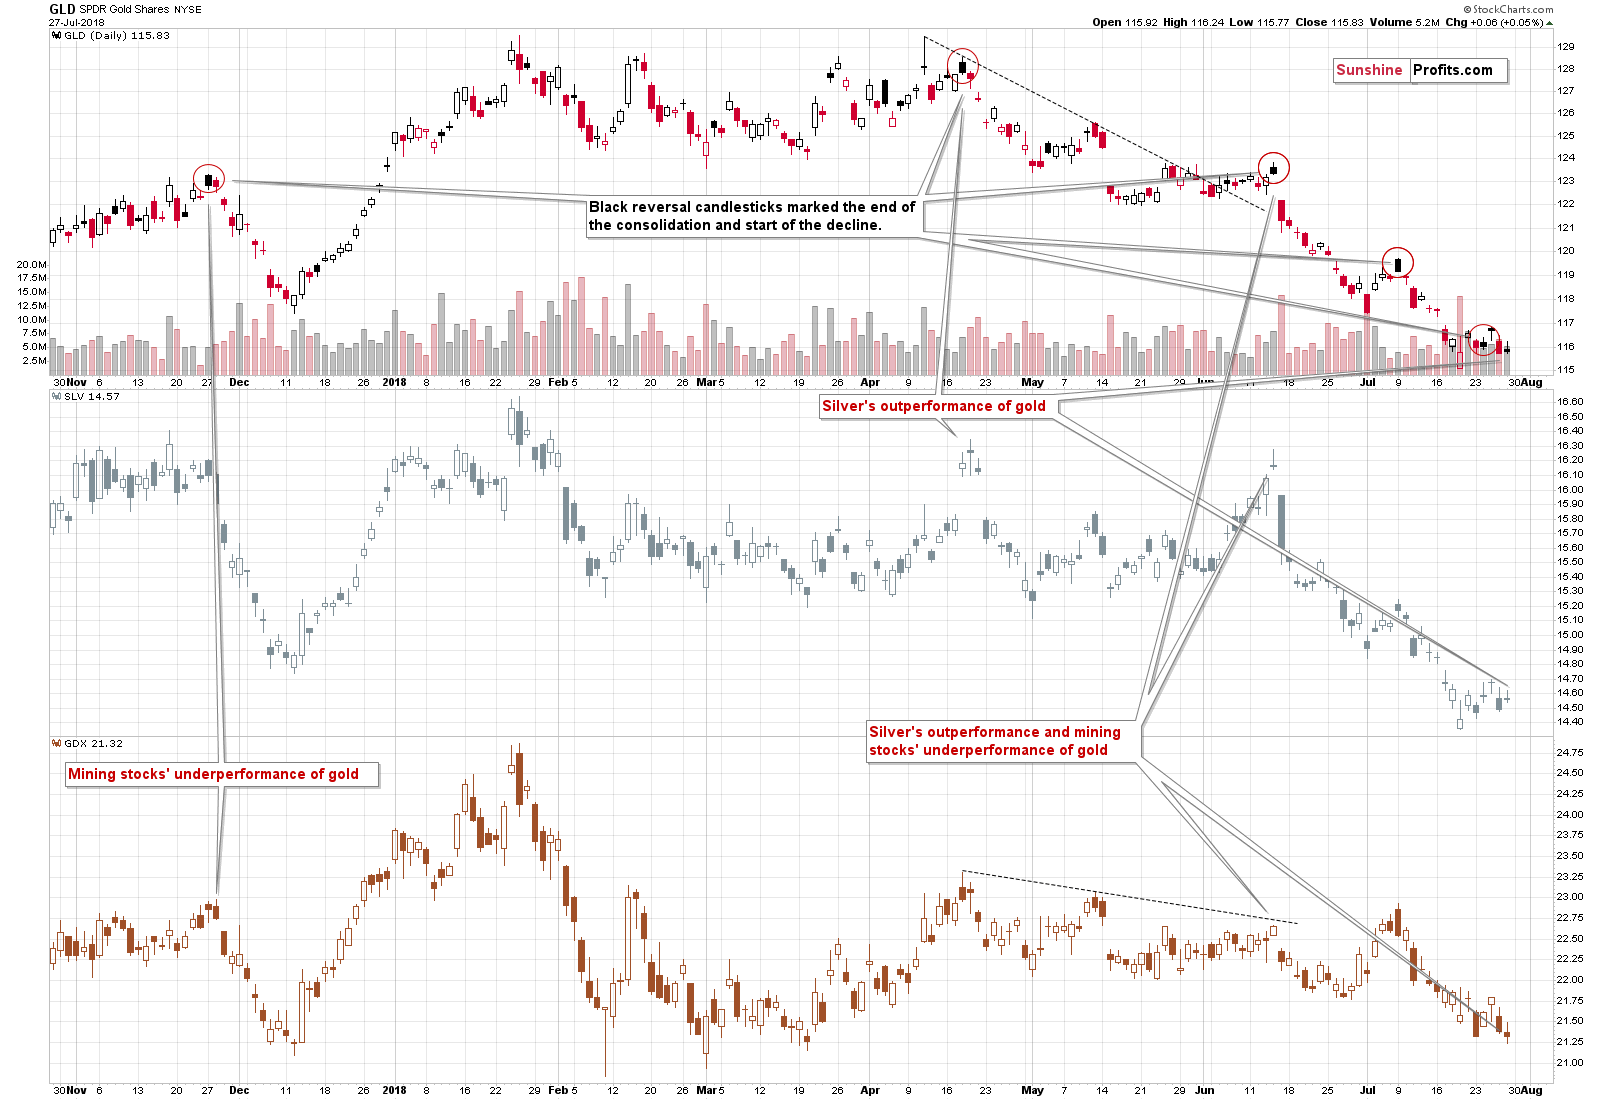
Gold stocks underperformed and silver outperformed gold. This is a classic pre-slide combination that we’ve seen multiple times in the recent and distant past. We marked some of the similar cases on the above chart. The Friday’s price moves were not huge by themselves; but comparing one rally to the other makes the differences significant. GLD moved slightly higher (0.05%), while SLV moved higher more visibly (0.55%) and GDX didn’t rally at all. It declined by 0.33%.
This is simply a bearish combination for the short term – the marked analogies confirm it.
Having said that, we would like to discuss the issue of the current seasonality.
Gold’s Summer Seasonal Patterns
We’re in the middle of the summer and precious metals are after a decline. It’s natural to attribute this to the regular gold summer doldrums phenomenon – the time during the year when not much happens to the price of gold (or it declines) as traders and investors go on vacation. And it is indeed the case sometimes (often enough for the “summer doldrum” phrase to be quite popular), but let’s keep in mind one important thing about it. It’s just a fancy name for seasonality. Giving it an additional name doesn’t make it more important.
The key thing about seasonality (based on our extensive research) is that it’s particularly useful when there is no strong trend or any other strong indications. In other words, seasonality is a gentle force that sets the overall tone for the trading patterns, but is unlikely to overcome other substantial market forces. For instance, seasonality can be compared to average waves on a medium-sized lake and a strong up- or downtrend can be compared to a big wave generated by a speeding motorboat.
For instance, based on the last 30 years or so, gold has – on average – not done anything during April. It was the most boring month of the entire year. And yet, in 2013, we saw a $200+ decline in gold in just a few days – and it happened in April. Why didn’t seasonals prevent this? Because that’s not how they work.
Let’s take a look at the gold stocks’ and gold’s seasonality.
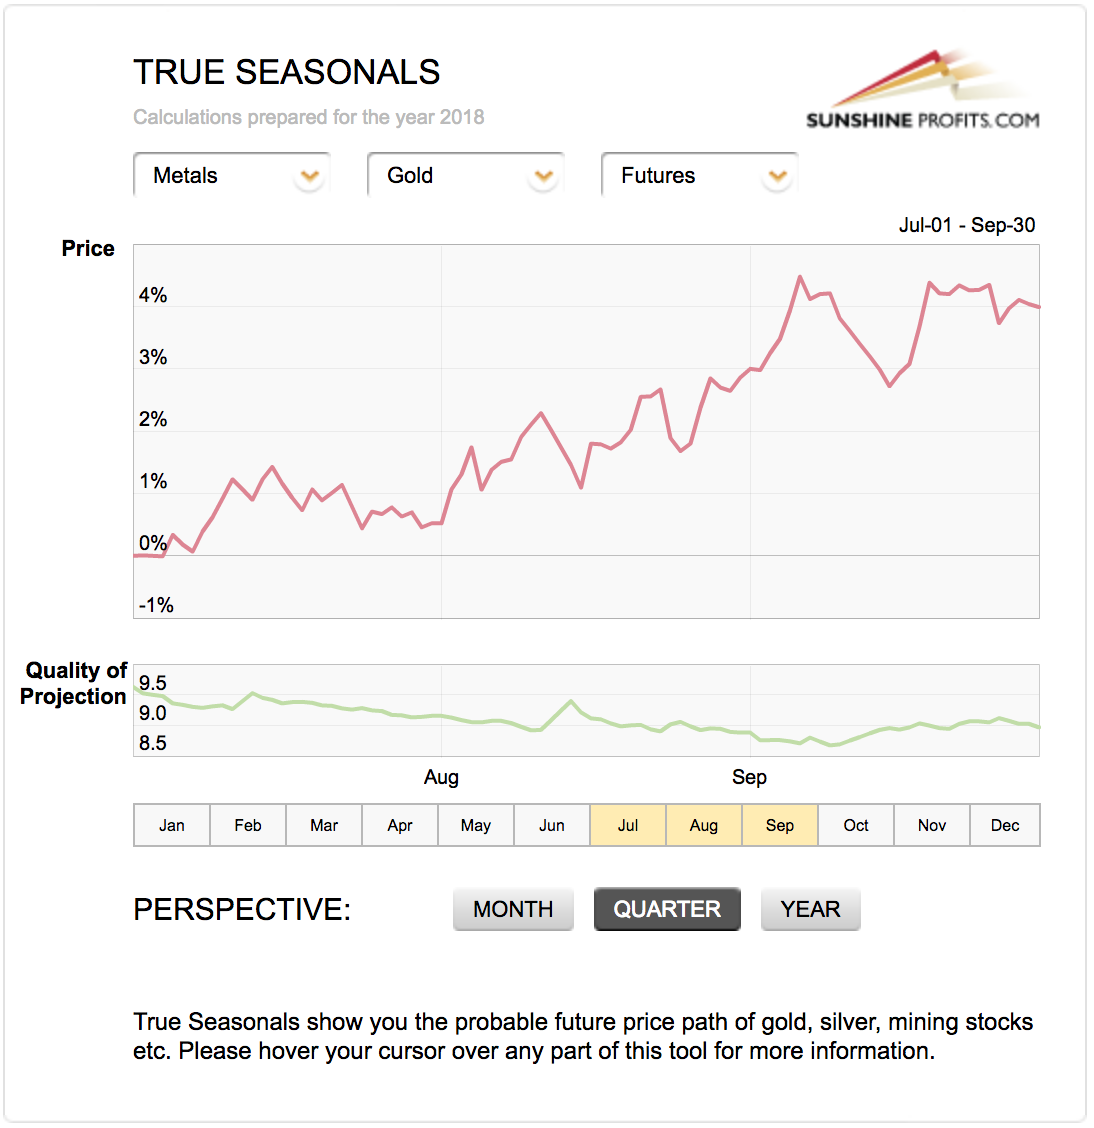
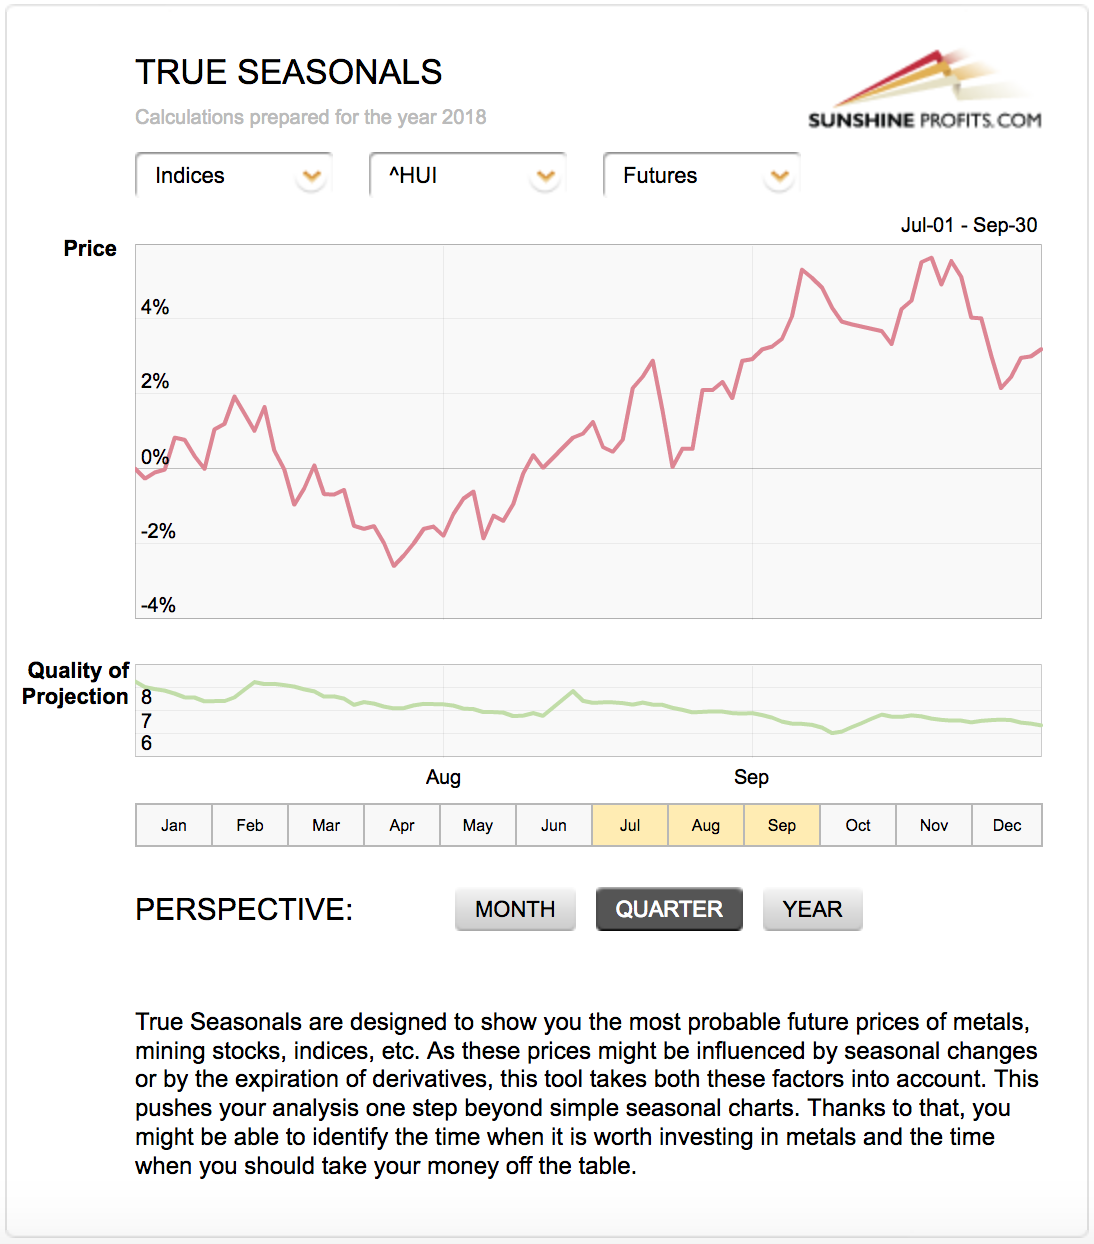
Based on the last several years and including the effect of expiring derivatives, we get a picture in which gold was supposed to do nothing (with an upward bias) and in which gold stocks were supposed to move higher in the first half of July and then to decline for the rest of the month.
Gold miners did exactly that and gold didn’t follow its own pattern, but more or less followed the gold miners’ pattern. The True Seasonality pattern worked to the extent to which it was in tune with other factors and didn’t work when it wasn’t. The overall trend was lower, so both followed it, it didn’t matter that gold’s True Seasonality pointed to overall higher prices.
The gold stocks’ seasonality may seem like the thing that one should focus on, but it’s not that simple. For instance, seasonality would have one believe that the HUI index would rally in February this year, especially in its early part. The HUI declined by about 25 index points and the most volatile part of the move took place in the early part of the month. Seasonality and its upgraded form – True Seasonality – are useful tools (particularly for confirming other signals), but are no crystal balls, especially when other strong factors are in place. We are in such a situation right now, so betting on a rally in gold in the coming weeks, just because the yellow metal is currently in the summer doldrums, is not really justified.
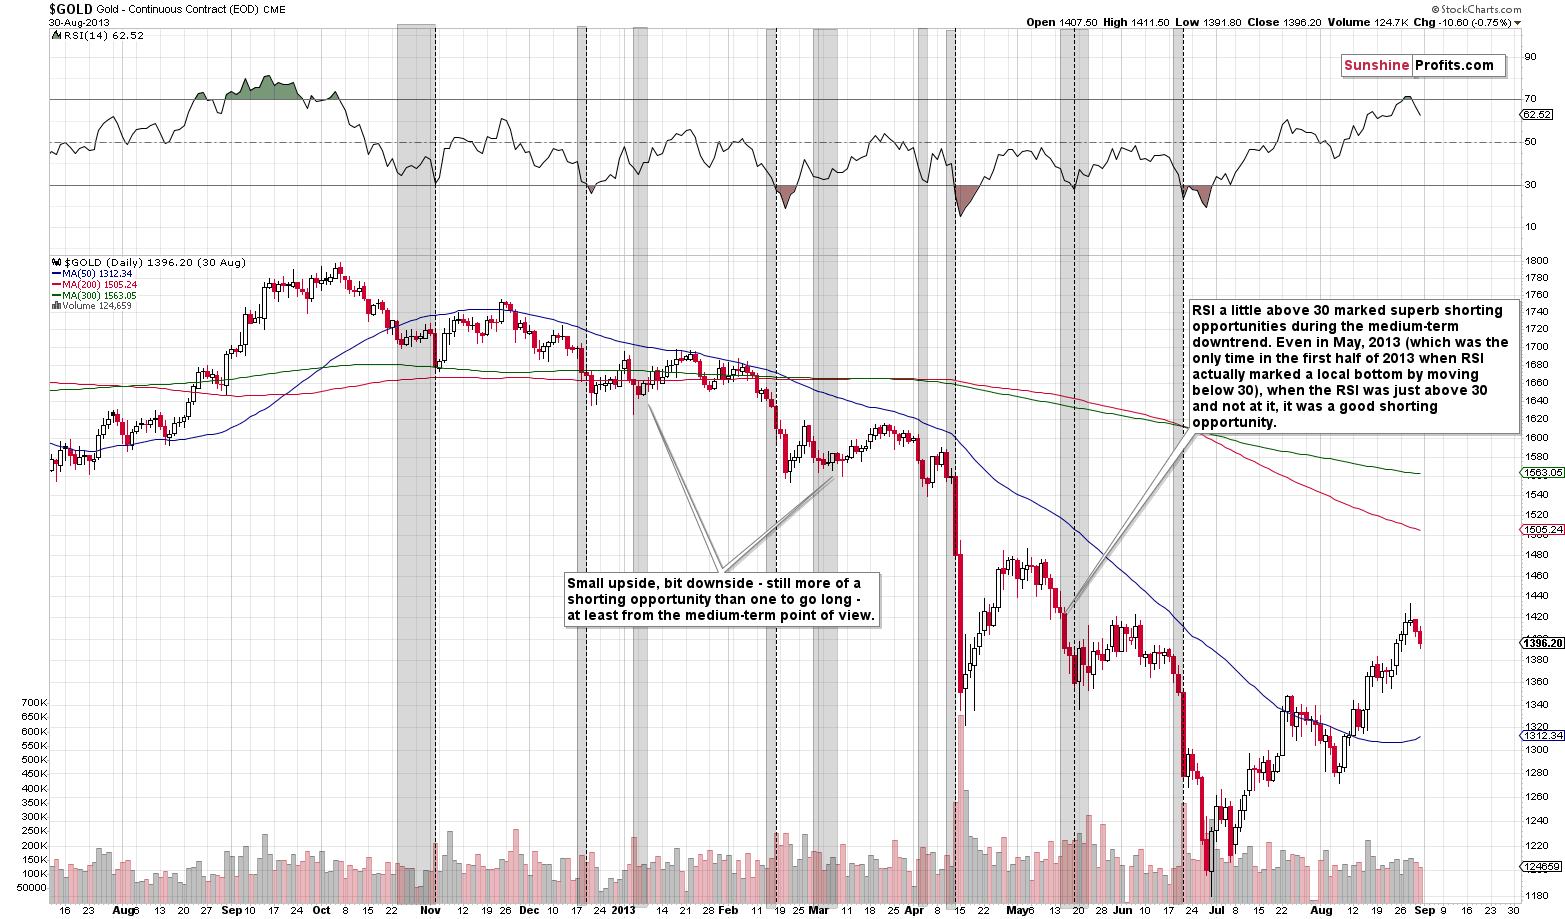
We were also asked to comment on the fact that gold positions indicated by the CoT reports pointed to a bullish outcome in the following weeks. We will not go into the details today, because we already discussed it thoroughly last Wednesday. The long-story-short version is that the data shows that the CoT numbers are reliable only during major upswings and during sideways trading patterns. They are not reliable – and the same goes for the RSI indicator – during big medium-term downswings and in the case of any epic moves. Well, in case of the RSI, we can always use the version based on weekly or monthly prices instead of daily ones, but in the case of the CoT numbers, we don’t have as much versatility. Moreover, when trying to predict major moves (or at least when one doesn’t want to be hurt by them), it’s necessary to look at the market from a broad perspective, not only from the medium- and short-term ones and the current signal that we have from the CoT is of a short-term nature (more details are available in the mentioned July 25th analysis).
Consequently, if there are good reasons to believe that the precious metals market is in a major decline or in a very big move in general (and there are many of reasons for both right now), it doesn’t seem prudent to attribute too much significance to the CoT report’s readings.
Platinum’s Breakdown Update
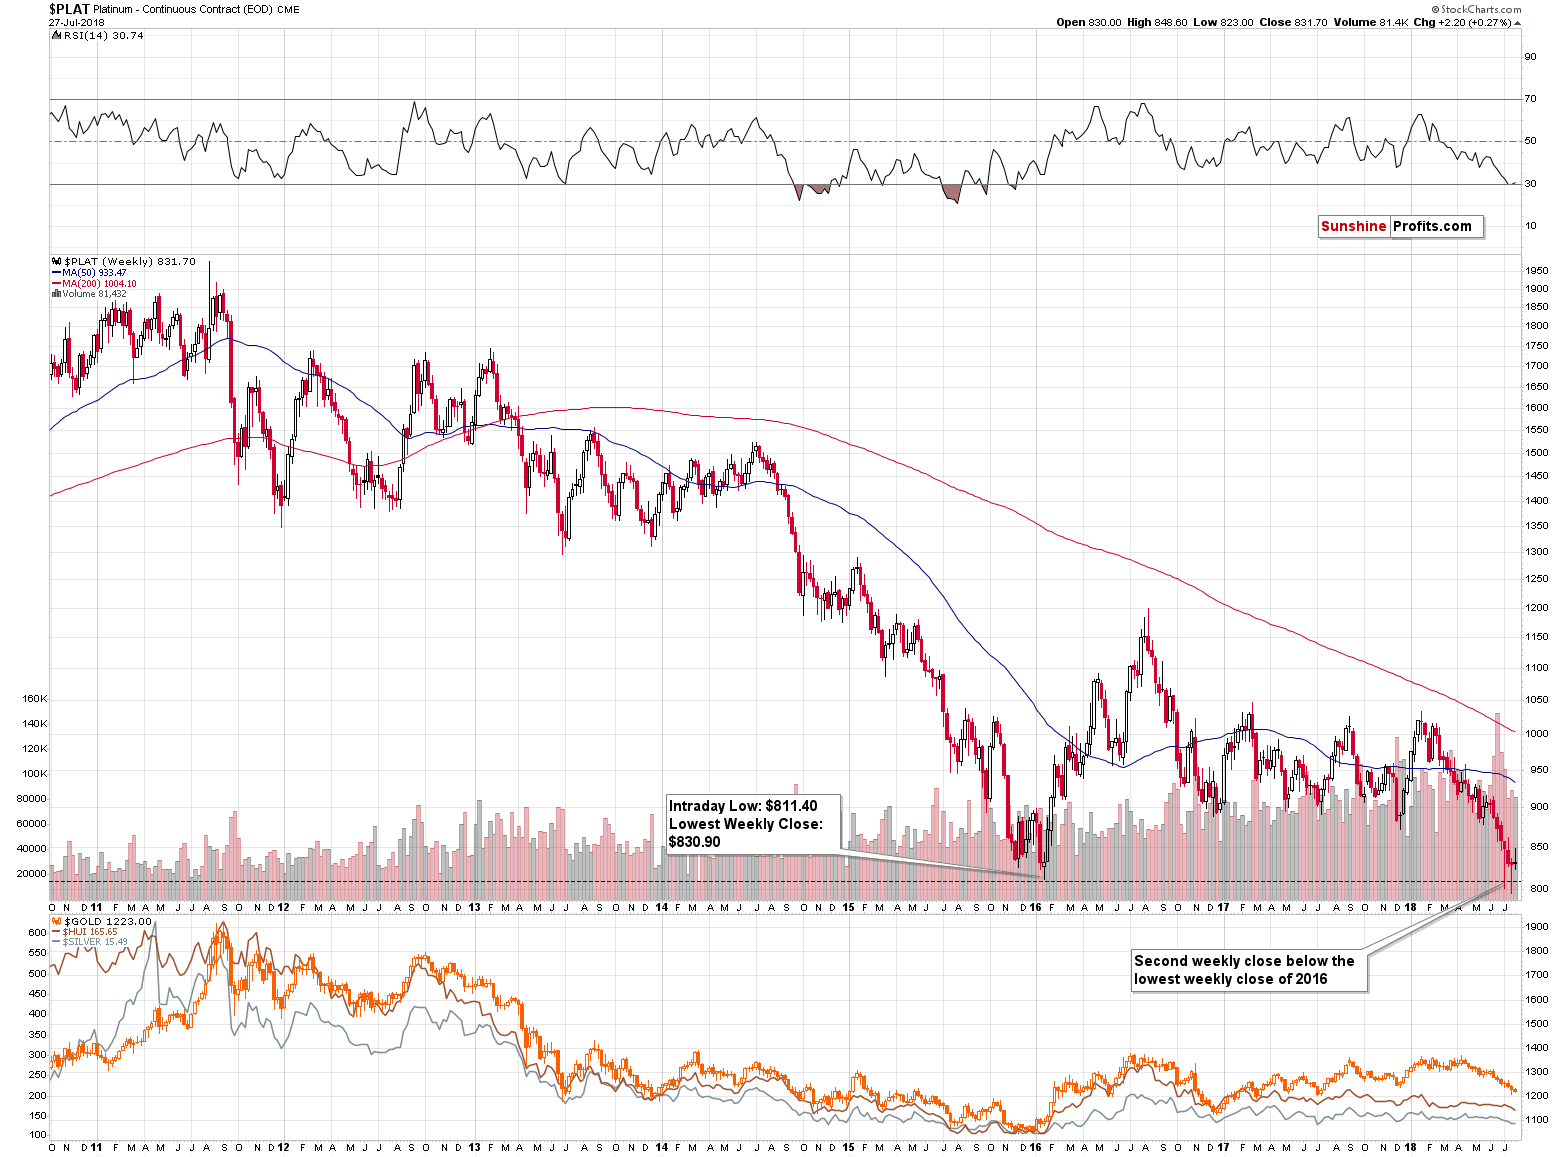
In the previous two weeks we saw platinum close below the lowest closing price of 2016 and we wrote that the breakdown below them was almost confirmed. The previous week ended a bit above the 2016 low, so technically the breakdown was invalidated. But, we don’t really view it as invalidated. We don’t view it as confirmed either. The reason is that instead of a powerful rally, we saw a “rally” by just $2.20, which is next to nothing. Last week’s closing price and it’s position relative to the critical support seems more unclear than anything else. Consequently, we view this as a “jury is still out” situation.
This week is likely to provide us with a decisive move in either direction and the implications are likely to indicate the direction in which platinum will move in the next few weeks, likely taking the rest of the PM sector with it. At the moment of writing these words, the price of platinum is down by $2, while gold is basically flat and silver is up by $0.03. There is a very tiny bearish indication and we should wait for a more significant one before saying that the implications of the above chart are strongly bullish or bearish. At this time, we continue to view them as bearish based on the previous 2 weeks, but not strongly bearish.
Trading Strategy Adjustment
Back in 2013, gold declined from about $1,560 to about $1,320 (intraday) or $1,350 (closing prices). That was a $210 - $240 decline that took just a few days. Given the combination of multiple bearish factors that we have here and the long-term breakdowns that we discussed in the previous Alerts, we should take into account that something similar could take place. It doesn’t have to be as volatile, or as deep, but the key thing is that it’s quite possible. After all, the current decline is quite similar to what happened in 2013.
If gold declined by $210 - $240 back in 2013, then the decline from the current price levels should be smaller, because gold starts from a lower price. After all, it will be percentage moves that have a similar impact on investors, not moves in absolute terms (by the way, that’s the reason why we’re using a logarithmic scale for precious metals charts). So, in 2013 gold declined by 13.46% - 15.38%. Applying this to the current price (approximately $1,220), we get the following prices as targets: $1,032 - $1,056. The area is not precise, but we have a major support level in this range – the 2015 bottom.
Consequently, while it’s not inevitable, it’s certainly possible that gold would decline to its 2015 lows very quickly and it might be difficult to react in a fast manner when that happens (it could take place during overnight trading). The 2013 decline took investors by surprise. We don’t want you to be surprised – we want you to be prepared and profitable. That’s why we are moving our target prices for the current decline to the 2015 / 2016 bottoms for gold and mining stock prices and we are turning them into exit orders. This means that if the price touches them, this order should be executed automatically by the trading platform (being effectively a profit-take order). As far as silver is concerned, we are moving the targets even below the 2015 bottom, because of the rising trend in the gold to silver ratio.
If we’re wrong about the above, nothing really changes – we’re on the lookout for bullish signs regardless of the above possibility and we can exit the current short position or switch to a long one at prices that are much higher than the 2015 bottoms (perhaps with gold close to $1,130 – the December 2016 bottom). But, thanks to having the distant profit-take orders in place, we’ll be ready to take advantage of huge overnight / intraday action that might take place in the following weeks (or days).
Summary
Summing up, the outlook for the precious metals sector is extremely bearish and based on the gold stock’s breakdown and Friday’s relative performance of gold, silver and mining stocks, it seems that we will not have to wait too long before the next big downswing starts.
The extra-large short positions in gold, silver, and mining stocks are definitely justified from the risk to reward point of view. It’s likely that the profits on the short position that we opened only several days ago will increase much more before this trade is over, even if they correct temporarily first.
The market is providing us with hints, but only a few investors are willing to listen. This is an opportunity of a decade (to profit on the upcoming slide and then to buy aggressively close to the final bottom) but most investors are either uninterested in the precious metals market at all (who can blame them after a several-year-long sideways trading pattern?) or are insisting on viewing everything as bullish for the precious metals market regardless of what the facts are. But not you. You’re focusing on the facts and are prepared for the big moves before they happen.
There is a chance that we’ll see a very big and sharp move sometime during the following weeks and we find it prudent to include this possibility in our trading strategy. Therefore, we are moving our target prices lower and we are turning them into exit (profit-take) prices. This means that if these prices are touched, the positions should be automatically (!) closed. So, it’s a moment where one already places the order in their trading system with a distant entry price. If the trading system allows that, the order type that we find best here is market-if-touched.
To be precise:
If gold touches its target price, it means closing the entire short position in gold, silver and mining stocks (including ETFs and ETNs).
If silver touches its target price, it means closing the entire short position in gold, silver and mining stocks (including ETFs and ETNs).
If GDX touches its target price, it means closing the position in GDX and in the mining stock ETFs and ETNs; but does not mean closing the gold and silver positions.
If any ETF or ETN touches its target price, but gold, silver and GDX don’t touch their targets (none of them does), then it doesn’t automatically translate into any trading action. These targets are not binding as the prices of ETNs and ETFs can move not only based on the moves in the underlying assets (that’s also why one shouldn’t apply technical analysis to them).
The above change does not mean that we are committed to keeping the short positions until these distant price levels are reached. We will be looking for good interim chances to exit or reverse the short positions to further boost profits – we simply want to have the “protection” against missing out on a huge intraday/overnight plunge if it happens.
As always, we will keep you – our subscribers – informed.
To summarize:
Trading capital (supplementary part of the portfolio; our opinion): Full short positions (200% of the full position) in gold, silver and mining stocks are justified from the risk/reward perspective with the following stop-loss orders and exit profit-take price levels:
- Gold: profit-take exit price: $1,062; stop-loss: $1,272; initial target price for the DGLD ETN: $82.96; stop-loss for the DGLD ETN $46.38
- Silver: profit-take exit price: $12.72; stop-loss: $16.46; initial target price for the DSLV ETN: $46.97; stop-loss for the DSLV ETN $24.07
- Mining stocks (price levels for the GDX ETF): profit-take exit price: $13.12; stop-loss: $23.64; initial target price for the DUST ETF: $80.97; stop-loss for the DUST ETF $20.87
In case one wants to bet on junior mining stocks’ prices (we do not suggest doing so – we think senior mining stocks are more predictable in the case of short-term trades – if one wants to do it anyway, we provide the details), here are the stop-loss details and initial target prices:
- GDXJ ETF: profit-take exit price: $17.52; stop-loss: $34.82
- JDST ETF: initial target price: $154.97 stop-loss: $42.78
Long-term capital (core part of the portfolio; our opinion): No positions (in other words: cash)
Insurance capital (core part of the portfolio; our opinion): Full position
Important Details for New Subscribers
Whether you already subscribed or not, we encourage you to find out how to make the most of our alerts and read our replies to the most common alert-and-gold-trading-related-questions.
Please note that the in the trading section we describe the situation for the day that the alert is posted. In other words, it we are writing about a speculative position, it means that it is up-to-date on the day it was posted. We are also featuring the initial target prices, so that you can decide whether keeping a position on a given day is something that is in tune with your approach (some moves are too small for medium-term traders and some might appear too big for day-traders).
Plus, you might want to read why our stop-loss orders are usually relatively far from the current price.
Please note that a full position doesn’t mean using all of the capital for a given trade. You will find details on our thoughts on gold portfolio structuring in the Key Insights section on our website.
As a reminder – “initial target price” means exactly that – an “initial” one, it’s not a price level at which we suggest closing positions. If this becomes the case (like it did in the previous trade) we will refer to these levels as levels of exit orders (exactly as we’ve done previously). Stop-loss levels, however, are naturally not “initial”, but something that, in our opinion, might be entered as an order.
Since it is impossible to synchronize target prices and stop-loss levels for all the ETFs and ETNs with the main markets that we provide these levels for (gold, silver and mining stocks – the GDX ETF), the stop-loss levels and target prices for other ETNs and ETF (among other: UGLD, DGLD, USLV, DSLV, NUGT, DUST, JNUG, JDST) are provided as supplementary, and not as “final”. This means that if a stop-loss or a target level is reached for any of the “additional instruments” (DGLD for instance), but not for the “main instrument” (gold in this case), we will view positions in both gold and DGLD as still open and the stop-loss for DGLD would have to be moved lower. On the other hand, if gold moves to a stop-loss level but DGLD doesn’t, then we will view both positions (in gold and DGLD) as closed. In other words, since it’s not possible to be 100% certain that each related instrument moves to a given level when the underlying instrument does, we can’t provide levels that would be binding. The levels that we do provide are our best estimate of the levels that will correspond to the levels in the underlying assets, but it will be the underlying assets that one will need to focus on regarding the signs pointing to closing a given position or keeping it open. We might adjust the levels in the “additional instruments” without adjusting the levels in the “main instruments”, which will simply mean that we have improved our estimation of these levels, not that we changed our outlook on the markets. We are already working on a tool that would update these levels on a daily basis for the most popular ETFs, ETNs and individual mining stocks.
Our preferred ways to invest in and to trade gold along with the reasoning can be found in the how to buy gold section. Additionally, our preferred ETFs and ETNs can be found in our Gold & Silver ETF Ranking.
As a reminder, Gold & Silver Trading Alerts are posted before or on each trading day (we usually post them before the opening bell, but we don't promise doing that each day). If there's anything urgent, we will send you an additional small alert before posting the main one.
=====
Latest Free Trading Alerts:
Recent days were good for oil bulls. Thanks to their action, the price of the commodity came back to around $70 and one of the daily indicators even generated a buy signal. Did the outlook turn to bullish? In our opinion, it didn’t. Furthermore, it seems that a fresh July low is still ahead of us. Why? The answer is quite simple - an analogy to the past.
Conflicting Views on Crude Oil
=====
Hand-picked precious-metals-related links:
PRECIOUS-Gold eases on firm dollar ahead of central bank meetings
Ronni Stöferle on Why Gold Still Matters
Fate of South African Gold Rests on Giant, Loss-Making Mine
=====
In other news:
World stocks dip before central bank test; Japan bonds down
Stocks Slip as Earnings Roll In, Metals Retreat: Markets Wrap
Trump threatens U.S. government shutdown over border wall
Big week for currency markets as central banks meet
Mark Carney Is Preparing for Brexit and the Next Crisis
The World’s Fastest-Growing Economy Looks Like It’s Got Momentum
Mnuchin: Trump 'absolutely respects' Fed's independence
The Winklevoss twins' bitcoin ETF was rejected
Oil prices edge higher but trade row caps gains
=====
Thank you.
Sincerely,
Przemyslaw Radomski, CFA
Founder, Editor-in-chief, Gold & Silver Fund Manager
Gold & Silver Trading Alerts
Forex Trading Alerts
Oil Investment Updates
Oil Trading Alerts

