

Briefly: in our opinion, full (250% of the regular size of the position) speculative short position in gold, silver, and mining stocks is justified from the risk/reward perspective at the moment of publishing this Alert.
Gold’s pace of decline has moderated in recent days, leading some to ask the question what we can expect next. Is a local bottom at hand? Be they subtle or not, what clues to look for? We don’t want you to miss anything important. Thorough examination of the outlook follows. That’s the basis for undertaking any right investment decisions. Without fanfare and ado, let’s dive in.
The last few Alerts discussed mostly long-term-oriented issues, so in today’s analysis we decided to focus on more short-term developments. In most cases, the biggest price moves tend to generate the biggest gains. To be honest, the initial results for the intraday system that we are about to introduce (in addition to what we provide right now; not instead thereof) seem to disprove the above rule in this particular case, but it remains valid in general. We don’t want to disclose the details, because they are so good that you wouldn’t believe them anyway. I – PR – would have not believed them, if I didn’t witness the entire process myself. Moving back to the point – the big moves tend to be the most profitable ones, but it will not matter much if one gets out of the market based on some short-term volatility. Knowing when to expect the short-term moves to occur, makes one more likely to stay the course, or – if that is what one prefers – to adjust their trading position to account for the short-term moves. We generally don’t think that it’s a good idea given the number of medium-term sell signals, but everyone has the right to make their own decisions regarding their capital.
Let’s start with the most up-to-date charts that we have – the intraday ones.
Gold and Silver: The Short-term View
Gold and silver moved to new lows yesterday, but quickly rallied back up. In case of gold, we didn’t see a move to any major support level, but in case of silver, it was a failed attempt to break below the $15 level. That’s a very round number, and such numbers tend to provide meaningful support and resistance levels. Did we just see a quick invalidation of a breakdown that would lead the PMs higher? Perhaps. Let’s look at the daily charts from a longer perspective.
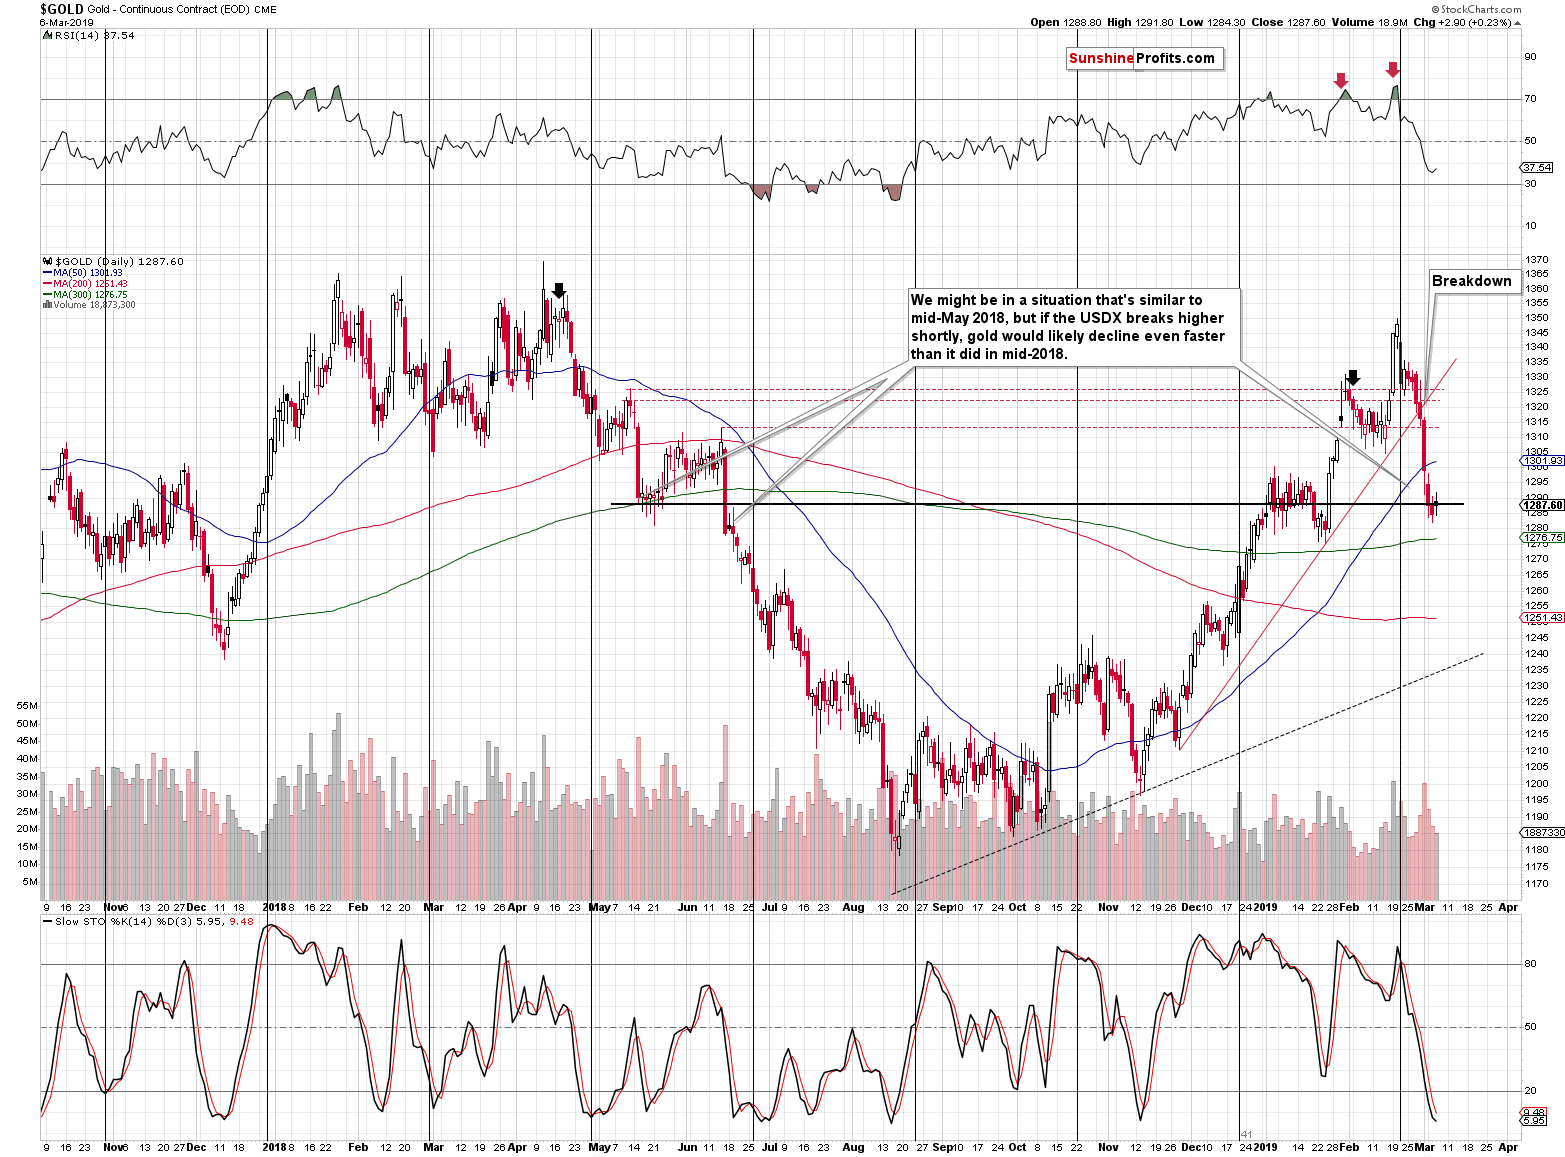
Gold continues to trade close to the May 2018 lows and right between the January lows and highs. In our Tuesday’s analysis, we wrote the following about the yellow metal:
At the moment of writing these words, gold is trading close to yesterday’s intraday lows, but this doesn’t change much as far as short-term implications are concerned. Gold broke below the rising support line in a sharp manner and it stopped close to the May 2018 lows and between the early January 2019 highs and late January 2019 lows. Since the move was sharp, a day or a few days of pause or a brief corrective upswing would not be out of the question, but they are not inevitable.
Last year, gold declined from somewhat similar price levels and it paused in May. It corrected to about $1,310 and resumed the decline about a month later. The important thing is that it then erased more than the entire corrective upswing in just one day.
Before saying that it’s better not to wait a month for decline’s continuation, please note the following:
- The current situation may be similar to the initial downswing in June 2018, not the one that we saw in May 2018.
- In 2018, the decline followed a relatively calm period where gold moved back and forth for a few months and now gold is right after a relatively volatile upswing. This suggests more volatility on the downside as well.
- In May 2018, the USD Index was already after a major short-term upswing, while right now it seems that such an upswing is only beginning.
Consequently, it seems that adjusting the trading position based on the possibility of seeing a brief upswing is not justified from the risk to reward point of view.
The above remains up-to-date. If today’s pre-market move is a start of a counter-trend upswing, it’s not likely to be a significant one. It could also be the case that the corrective upswing was barely noticeable and that it’s already over – just like the one in mid-June 2018 that was followed by the decline’s continuation.
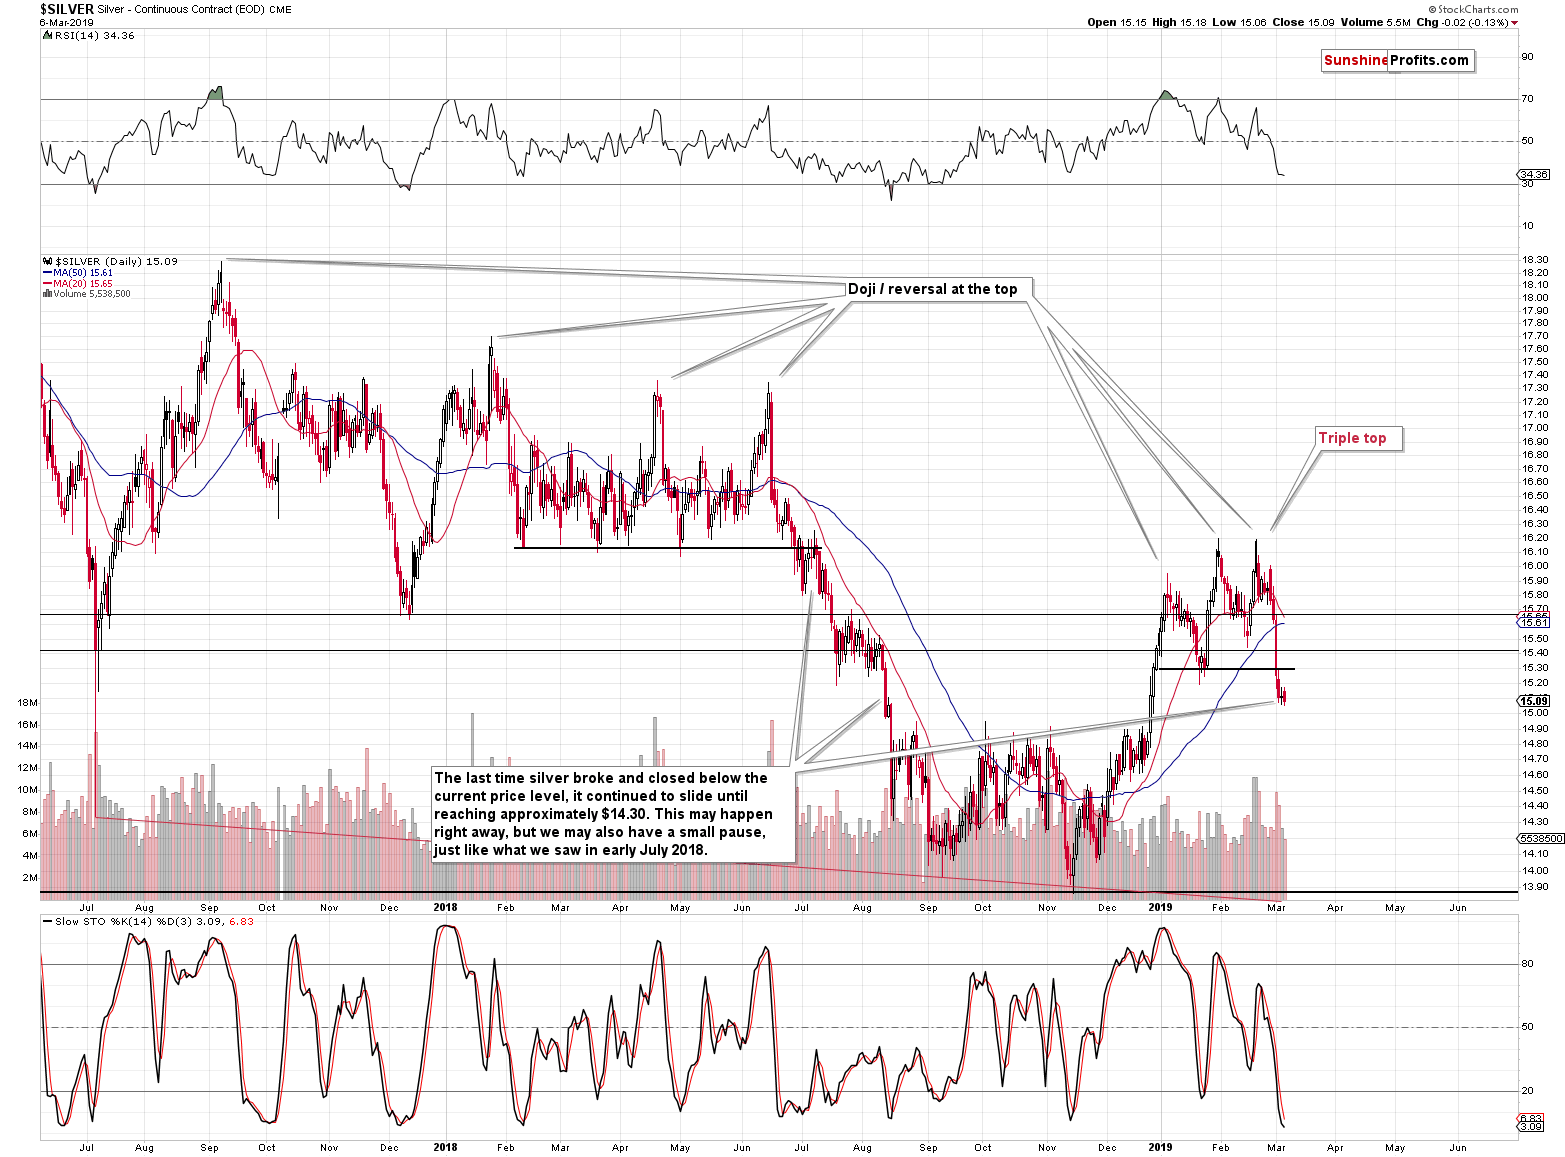
On the silver chart we see that the breakdown below the previous lows was already confirmed in terms of the closing prices. Namely, silver closed below the previous 2019 lows for three consecutive days. This means that the white metal is ready to decline once again. This doesn’t rule out the possibility of silver moving first back to the previously broken support levels. Consequently, our Tuesday’s comments remain up-to-date:
Silver is already after a major short-term breakdown, which suggests more weakness on the horizon. We saw something similar in late June 2018 and back then silver simply moved back to the previous lows and verified them as resistance. There were some moves above them in intraday terms, but none in terms of the daily closing prices (ok, silver close precisely 1 cent above the previous high in 2018, but that doesn’t really count). This means that if we see a corrective upswing here, then it’s not likely to be anything more than a $0.20 - $0.30 move higher.
Silver is likely to be very volatile during its downswing, so it seems much better to just wait out the possible bounce instead of risking missing the big slide.
On Tuesday, we also mentioned the possibility of seeing temporarily higher gold and silver prices because of very short-term strength in the mining stocks.
Gold Stocks Update
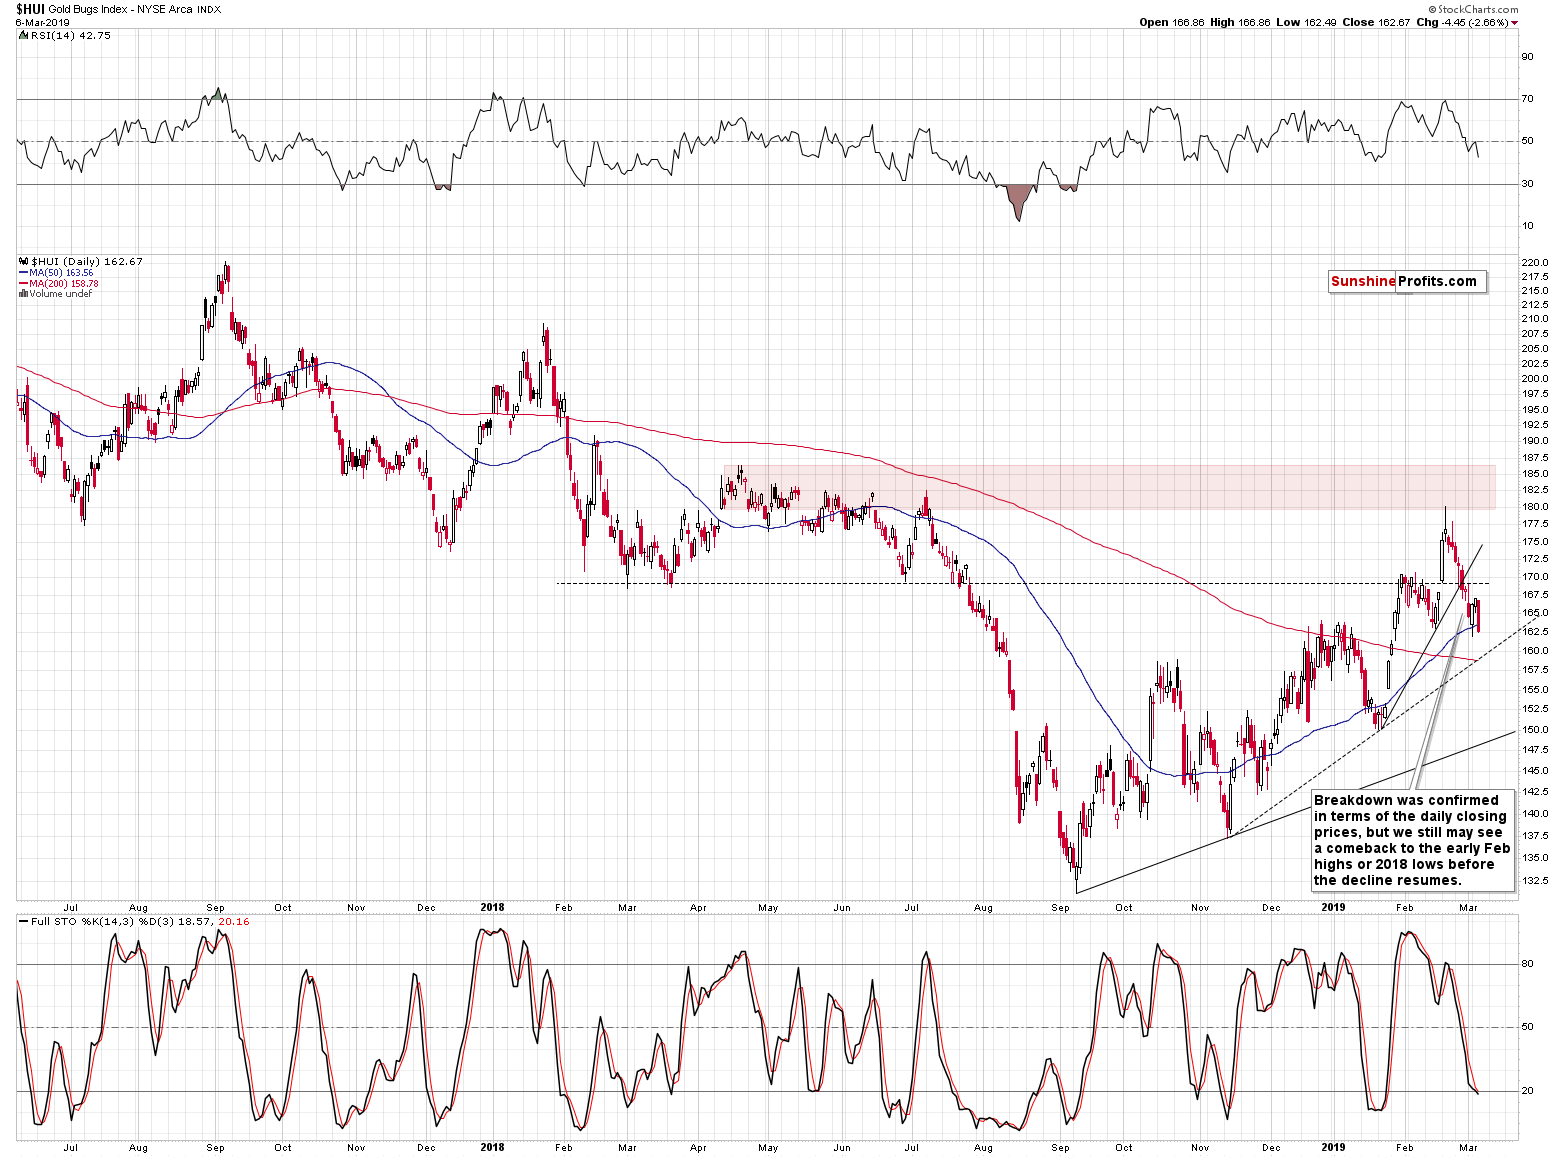
Gold stocks had invalidated the initial breakdown below the February lows and the 50-day moving average and had closed the session higher despite a move lower in gold. That had been a bullish sign. However, since that time, gold stocks moved back up and declined once again, this time underperforming gold. Yesterday’s close was the lowest close that we saw since beginning of February as the HUI Index closed below both: the recent lows and the 50-day moving average.
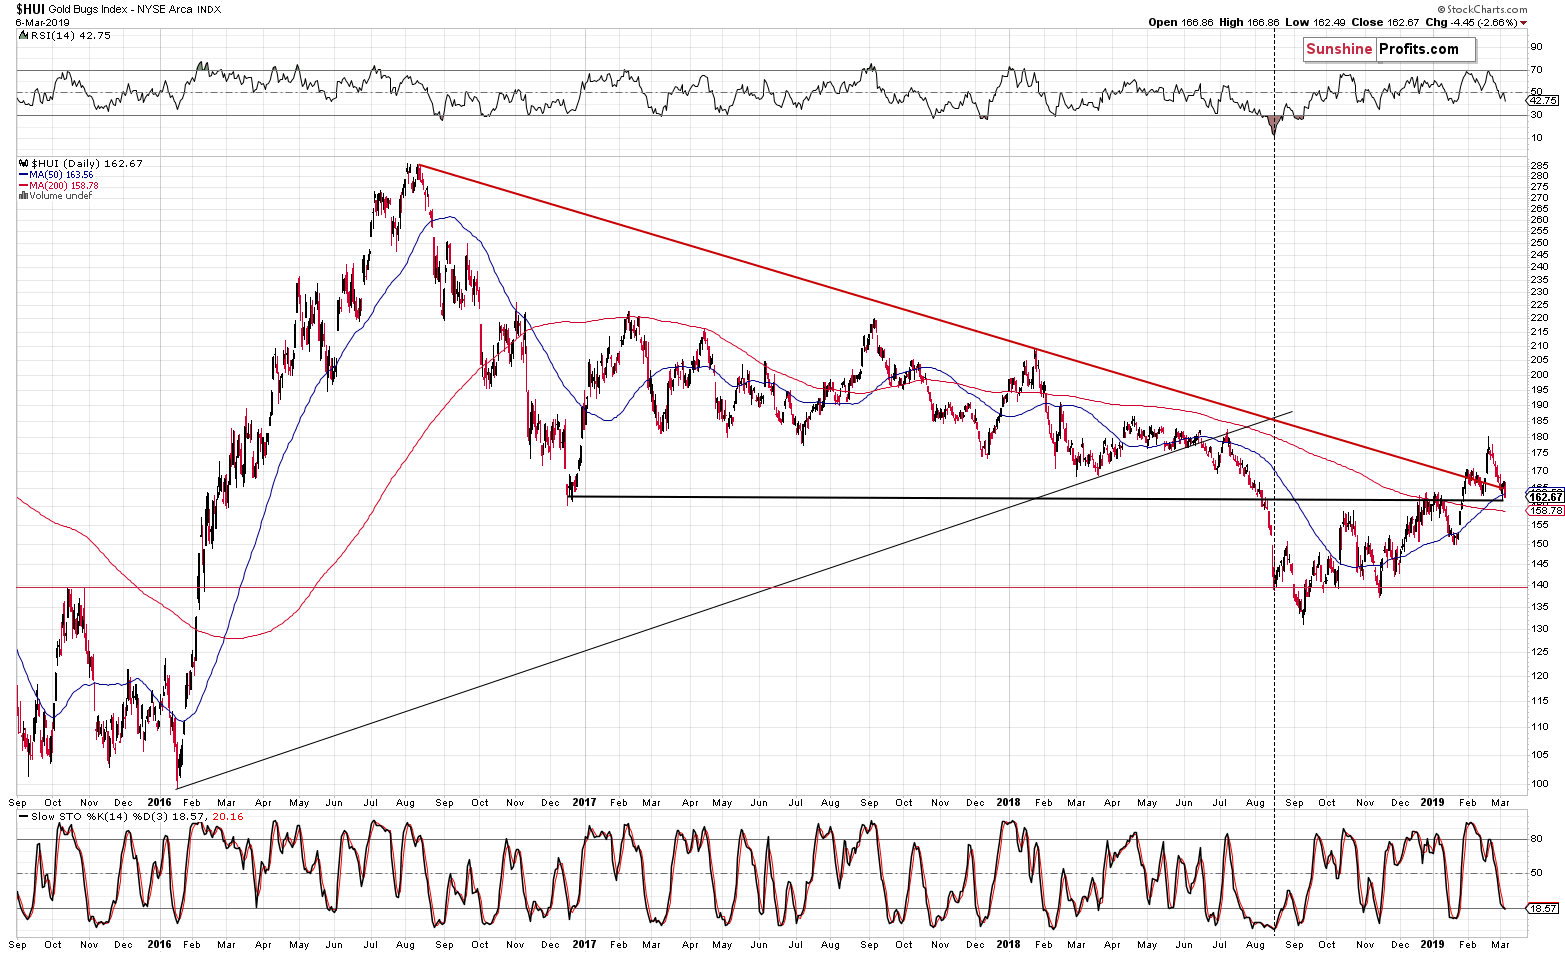
The HUI also closed below the declining medium-term support/resistance line, which appears to be a major development. But…
Despite all the extremely bearish signs for the following months, we are still skeptical about the very short-term price moves. You see, we saw almost exactly the same thing recently. In mid-January, gold miners closed a bit above the 50-day moving average after a volatile decline. Then they paused for 2 days and then declined below the 50-day MA. That seemed to be a beginning of another move lower, but it actually turned out to be a local bottom. That was also the time when we saw a small move lower below the declining red support/resistance line that we see on the above chart.
Consequently, while the medium term is clearly and extremely bearish, the next several days could still see higher prices. We don’t expect any major move up – definitely not above the recent highs – but a comeback to the early February highs in the miners might still be in the cards.
As we explained previously, a lot – with regard to the short-term – depends on the situation in the forex market.
The Omnipotent USD Index
Our Tuesday’s comments on the USD Index remain up-to-date:
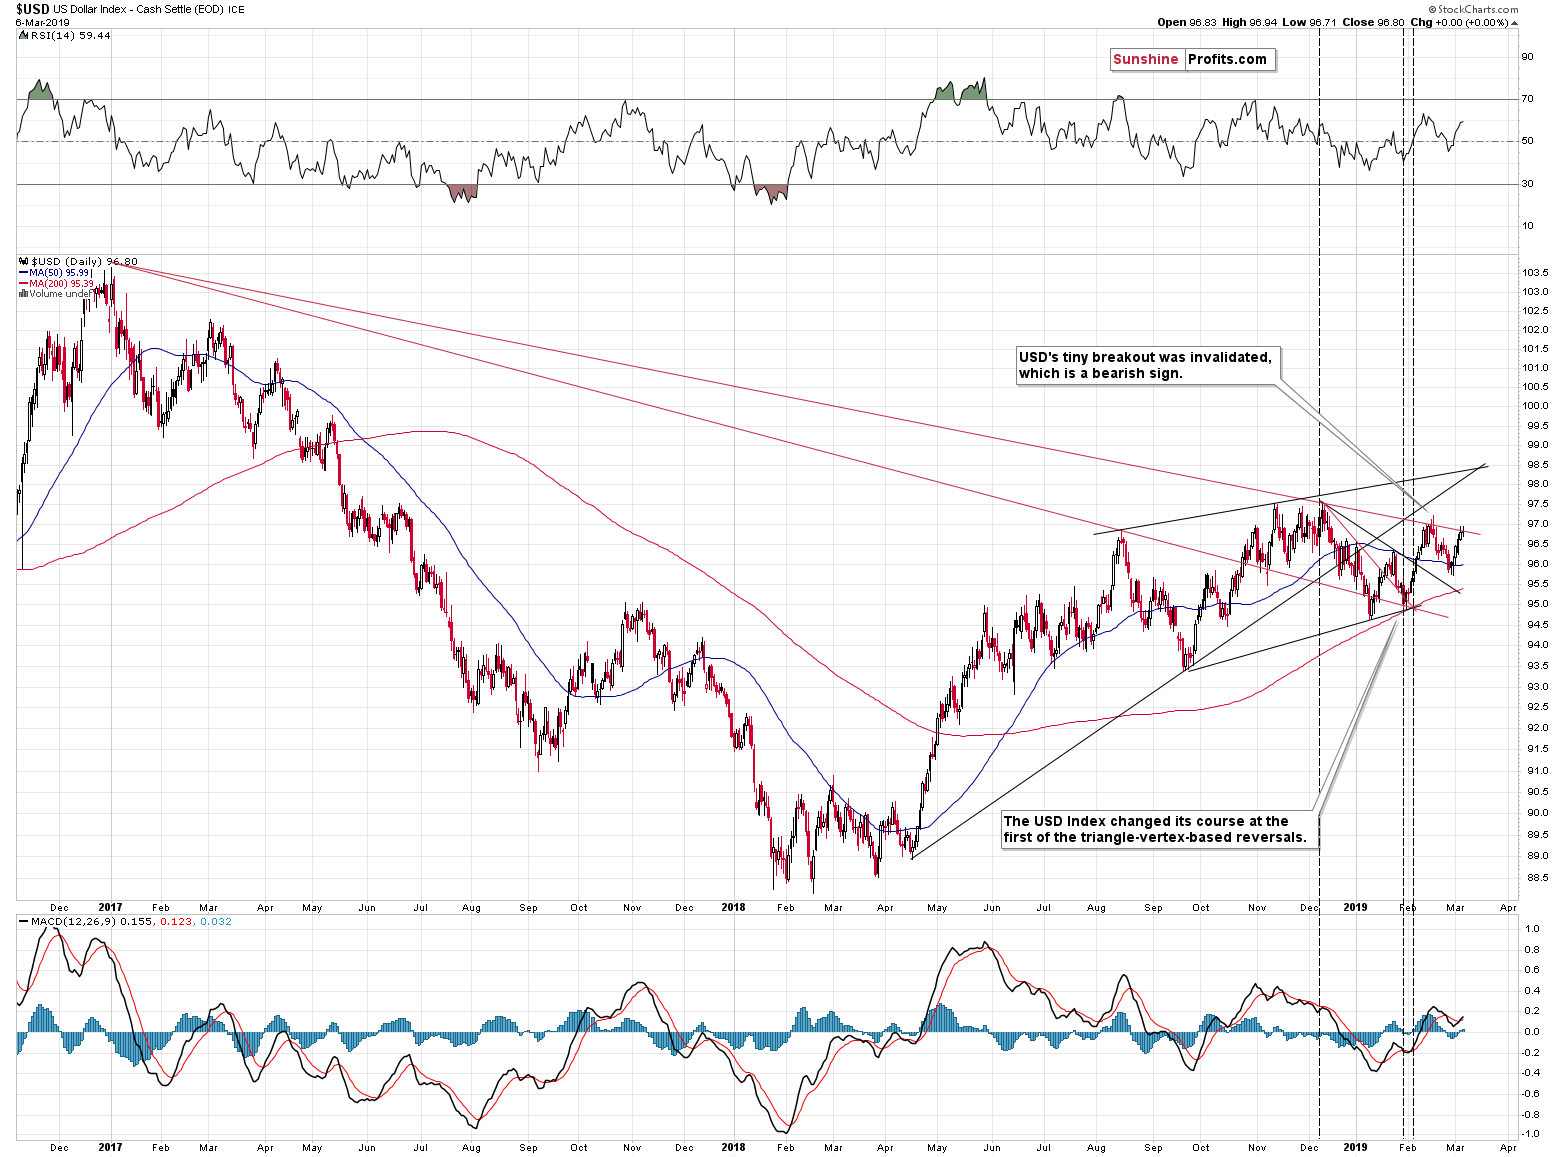
The US currency is moving higher, but it hasn’t broken above the previous highs or the declining red resistance line just yet. If the USD Index breaks above the latter, the precious metals sector might decline right away. However, once the USDX breaks above the 2018 highs in a decisive way, the precious metals market will almost certainly plunge. We described it on numerous occasions, but it seems it’s worth repeating that PMs often react more to both the breakouts and breakdowns in the USDX than to the moves themselves.
The medium-term outlook for the USD Index remains bullish and since it’s been moving in an upward sloping consolidation for many months, it seems that it’s about time for the USD to finally break out of it and continue its upward path. If the USD Index breaks out shortly, the PMs will likely slide before too long. If it doesn’t, we’ll likely see gold, silver and mining stocks taking an ordinary pause, or their moderately-paced decline.
Summary
Summing up, it’s almost certain that the next big move lower has already begun and that the 2013-like slide is in its early stage. Based on the updated version of the 2013-now link, the implications are even more bearish than we had initially assumed. The downside target for gold remains intact ($890), but it seems that the price moves in silver and mining stocks will take them even lower than we had originally thought. A move below $9 in silver, and a move to or below 80 in case of the HUI Index (perhaps much lower on a very temporary basis) are not out of the question.
In other words, the precious metals market is likely to erase everything that it had gained in the last several days, weeks, and months, and then decline much more before THE bottom is in.
Even if the USD Index fails to rally here and consolidates some more, we don’t expect any significant strength in the precious metals sector. We may see some brief relief, but anything more than short-term hints at strength is very unlikely.
As always, we’ll keep you – our subscribers – informed.
To summarize:
Trading capital (supplementary part of the portfolio; our opinion): Full short position (250% of the full position) in gold, silver, and mining stocks is justified from the risk/reward perspective with the following stop-loss orders and exit profit-take price levels:
- Gold: profit-take exit price: $1,062; stop-loss: $1,357; initial target price for the DGLD ETN: $82.96; stop-loss for the DGLD ETN $39.87
- Silver: profit-take exit price: $12.32; stop-loss: $16.44; initial target price for the DSLV ETN: $47.67; stop-loss for the DSLV ETN $23.68
- Mining stocks (price levels for the GDX ETF): profit-take exit price: $13.12; stop-loss: $24.17; initial target price for the DUST ETF: $76.87; stop-loss for the DUST ETF $15.47
Note: the above is a specific preparation for a possible sudden price drop, it does not reflect the most likely outcome. You will find a more detailed explanation in our August 1st Alert. In case one wants to bet on junior mining stocks’ prices (we do not suggest doing so – we think senior mining stocks are more predictable in the case of short-term trades – if one wants to do it anyway, we provide the details), here are the stop-loss details and target prices:
- GDXJ ETF: profit-take exit price: $17.52; stop-loss: $35.67
- JDST ETF: initial target price: $143.87 stop-loss: $30.97
Long-term capital (core part of the portfolio; our opinion): No positions (in other words: cash)
Insurance capital (core part of the portfolio; our opinion): Full position
Important Details for New Subscribers
Whether you already subscribed or not, we encourage you to find out how to make the most of our alerts and read our replies to the most common alert-and-gold-trading-related-questions.
Please note that the in the trading section we describe the situation for the day that the alert is posted. In other words, it we are writing about a speculative position, it means that it is up-to-date on the day it was posted. We are also featuring the initial target prices, so that you can decide whether keeping a position on a given day is something that is in tune with your approach (some moves are too small for medium-term traders and some might appear too big for day-traders).
Plus, you might want to read why our stop-loss orders are usually relatively far from the current price.
Please note that a full position doesn’t mean using all of the capital for a given trade. You will find details on our thoughts on gold portfolio structuring in the Key Insights section on our website.
As a reminder – “initial target price” means exactly that – an “initial” one, it’s not a price level at which we suggest closing positions. If this becomes the case (like it did in the previous trade) we will refer to these levels as levels of exit orders (exactly as we’ve done previously). Stop-loss levels, however, are naturally not “initial”, but something that, in our opinion, might be entered as an order.
Since it is impossible to synchronize target prices and stop-loss levels for all the ETFs and ETNs with the main markets that we provide these levels for (gold, silver and mining stocks – the GDX ETF), the stop-loss levels and target prices for other ETNs and ETF (among other: UGLD, DGLD, USLV, DSLV, NUGT, DUST, JNUG, JDST) are provided as supplementary, and not as “final”. This means that if a stop-loss or a target level is reached for any of the “additional instruments” (DGLD for instance), but not for the “main instrument” (gold in this case), we will view positions in both gold and DGLD as still open and the stop-loss for DGLD would have to be moved lower. On the other hand, if gold moves to a stop-loss level but DGLD doesn’t, then we will view both positions (in gold and DGLD) as closed. In other words, since it’s not possible to be 100% certain that each related instrument moves to a given level when the underlying instrument does, we can’t provide levels that would be binding. The levels that we do provide are our best estimate of the levels that will correspond to the levels in the underlying assets, but it will be the underlying assets that one will need to focus on regarding the signs pointing to closing a given position or keeping it open. We might adjust the levels in the “additional instruments” without adjusting the levels in the “main instruments”, which will simply mean that we have improved our estimation of these levels, not that we changed our outlook on the markets. We are already working on a tool that would update these levels on a daily basis for the most popular ETFs, ETNs and individual mining stocks.
Our preferred ways to invest in and to trade gold along with the reasoning can be found in the how to buy gold section. Additionally, our preferred ETFs and ETNs can be found in our Gold & Silver ETF Ranking.
As a reminder, Gold & Silver Trading Alerts are posted before or on each trading day (we usually post them before the opening bell, but we don't promise doing that each day). If there's anything urgent, we will send you an additional small alert before posting the main one.
=====
Latest Free Trading Alerts:
As the old saying goes, politics is a show business for ugly people. Fair enough, but what does it have to do with gold? Let’s jump right in and find out!
Gold and the Political Theater: Is The Tail Wagging the Dog?
Wednesday's trading session was bearish, as stocks retraced their Tuesday's advance. However, the market remained at its recent local lows. So is this a topping pattern or just a pause before another leg up?
Downward Reversal? Stocks Still Relatively Close to Their Recent Highs
=====
Thank you.
Sincerely,
Przemyslaw Radomski, CFA
Editor-in-chief, Gold & Silver Fund Manager

