

Briefly: in our opinion, full (250% of the regular size of the position) speculative short position in gold, silver, and mining stocks is justified from the risk/reward perspective at the moment of publishing this Alert.
Yesterday’s extensive gold, silver, and mining stock analysis provided insight into the critical background for the moves that we are about to see. But there’s so much more that’s taking place right now! Gold price in yen and gold to silver ratio provide profound signals while the mining stocks seem to be… bottoming. They just reversed after declining in a sharp manner even though gold and silver moved lower. Why would they do it despite all the bearish signs? Are we about to see another wave higher before the big plunge takes place?
In short, if we do, then the move is unlikely to be anything to call home about. The long-term analysis that we outlined yesterday along with the long-term confirmations that we are about to present now, makes the outlook extremely bearish and any potential delay or small upswing doesn’t change the overall implications.
Let’s move to the more important factors, starting with gold’s long-term chart. We already featured a long-term chart of gold yesterday, but today’s chart is a bit different, as it emphasizes the recent breakouts and their invalidations along with the vertex-based reversal.
A Fresh View of Gold
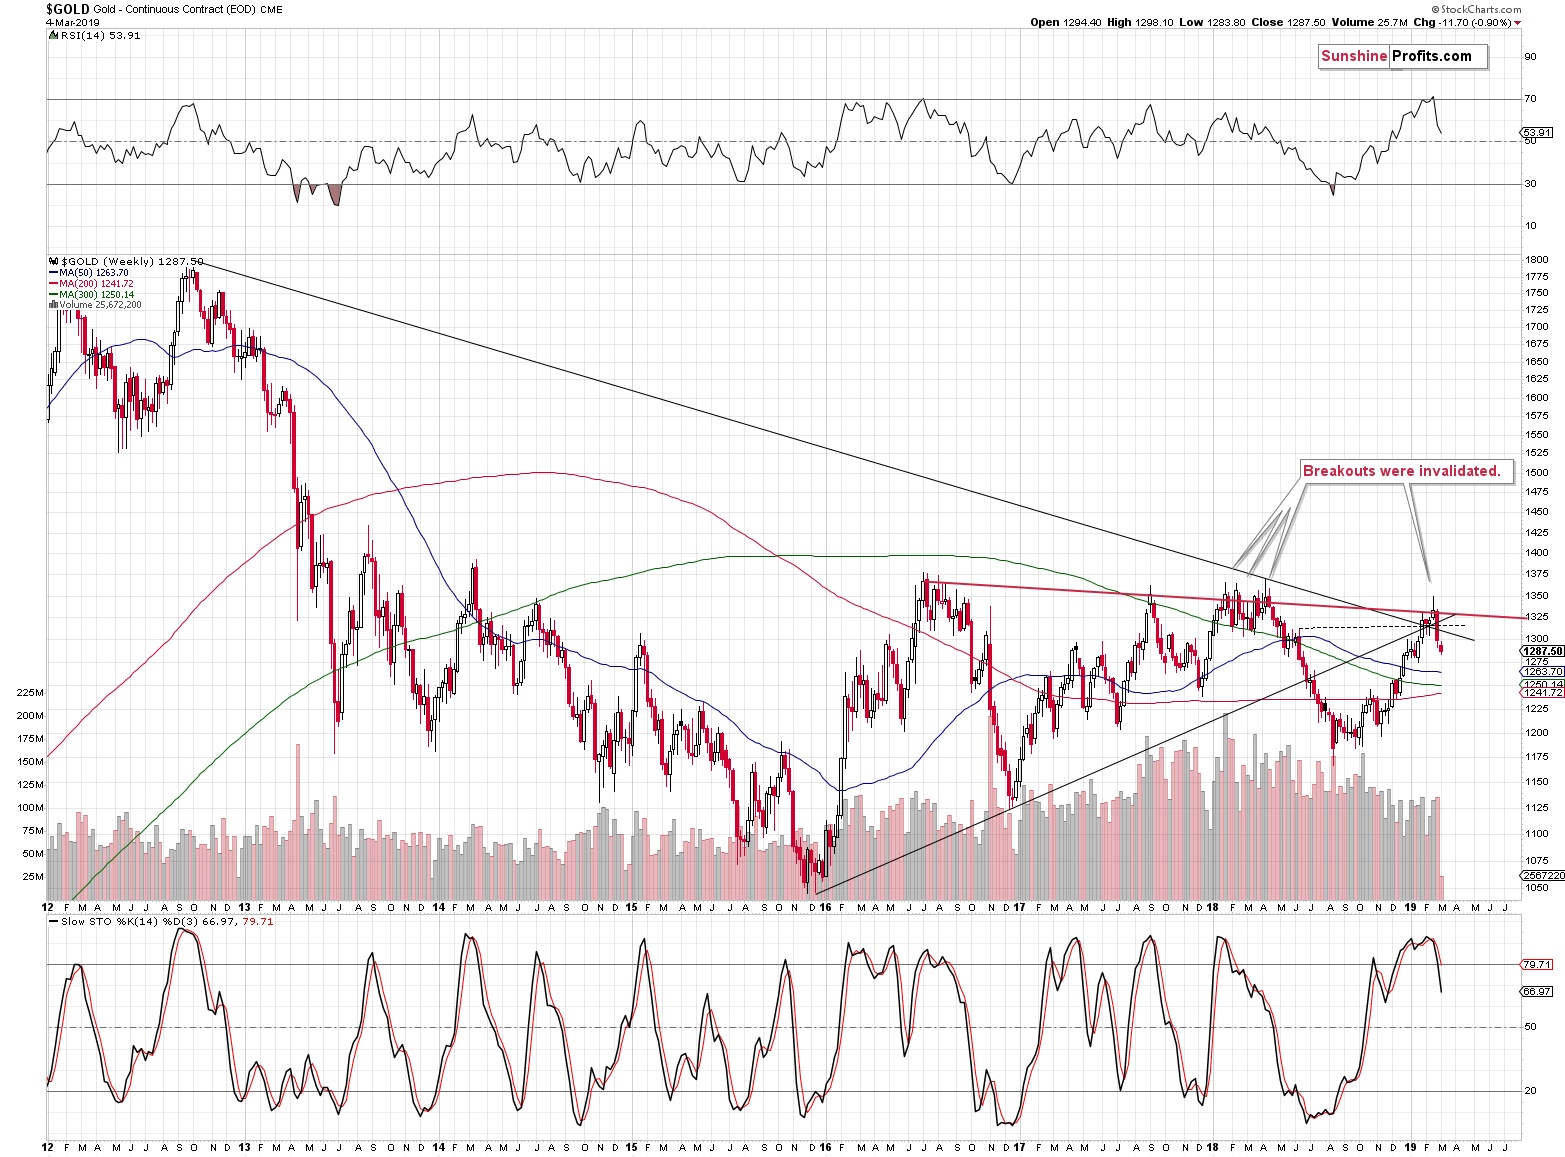
The price of gold moved above both black resistance lines and it topped approximately 1 week after the vertex of the triangle these lines created. This is still very close to the vertex given how long-term-oriented both lines are. Consequently, we might say that this technique pointing to reversals worked once again. This time, it was not extremely precise, but it did a quite good job nonetheless. This may seem like a past factor and that’s partially correct, but it also has some deeper implications at this time. The long-term vertex-based reversal makes it likely that the recent reversal was a very important one, not just something that will be followed be even higher prices shortly. It’s much more likely that the reversal marked the top for the following months.
The same goes for the breakout and the subsequent invalidation. Gold closed the previous week below both resistance lines, thus invalidating the earlier breakouts. What is important is that gold has indeed continue to move lower this week. It was the case yesterday and gold is also down in today’s pre-market trading. The invalidation was not accidental, and the implications are definitely bearish.
Gold and the Japanese Yen
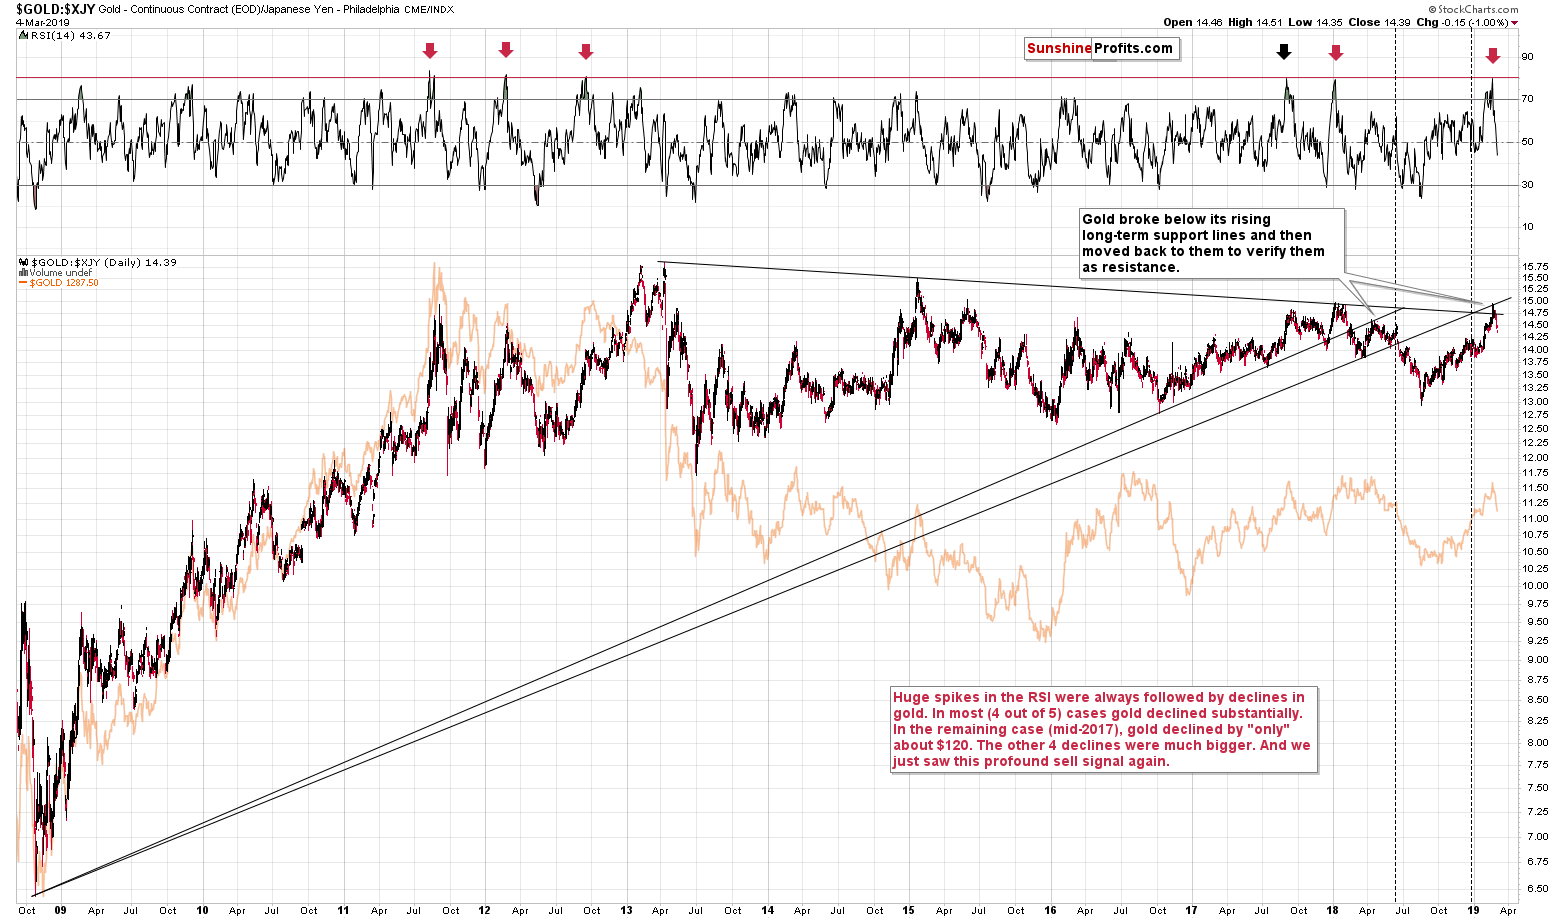
Looking at gold from the Japanese point of view (in terms of the Japanese yen), we see not only an invalidation of a long-term breakout, but also something more. The invalidation itself is already a profoundly bearish factor, but the thing that makes it even more bearish is the recent action in the RSI indicator.
The RSI was just at about 80 and then moved lower. There were only 5 similar cases in the past decade. In one of them, gold declined by “only” about $120 (mid-2017). In all 4 remaining cases, gold declined much more. If you have read our yesterday’s analysis, you know that the current situation is similar to the way in which the huge gold decline of 2012-2013 started. The above chart points to yet another similarity between 2013 and now.
Interestingly, out of all the 5 cases when RSI moved to about 80, it started its rally from below 25 only in 2 cases: in 2012 and now. And we know what happened to gold next.
The implications are very bearish.
What about the gold to silver ratio?
Gold to Silver Ratio: The True Resistance Level’s Implications
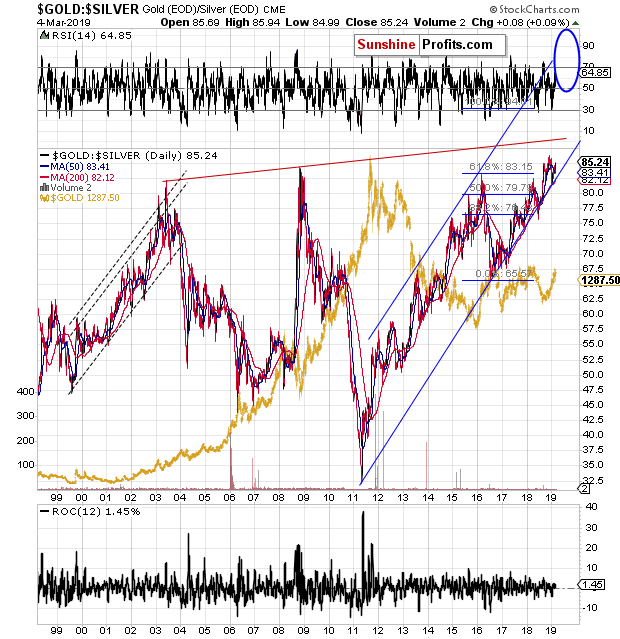
It’s on the rise. Just that. And as much as that.
It’s now clear that the very recent brief downswing in the ratio was just a technical correction to the lower border of the rising trend channel and a verification of the breakout above the 2003, 2008, and 2016 highs. This breakout means that the big move in the precious metals sector is already underway. And it means a move lower, because in the past decade the ratio has been moving in the opposite way to the direction in which the prices of precious metals moved. In other words, on average, silver rallied more, but it also declined faster. The implications are very bearish for the following months. As a reminder, the true long-term resistance of the ratio is at about 100 level. Most analysts ignore this simple fact, likely because they don’t check the more distant history.
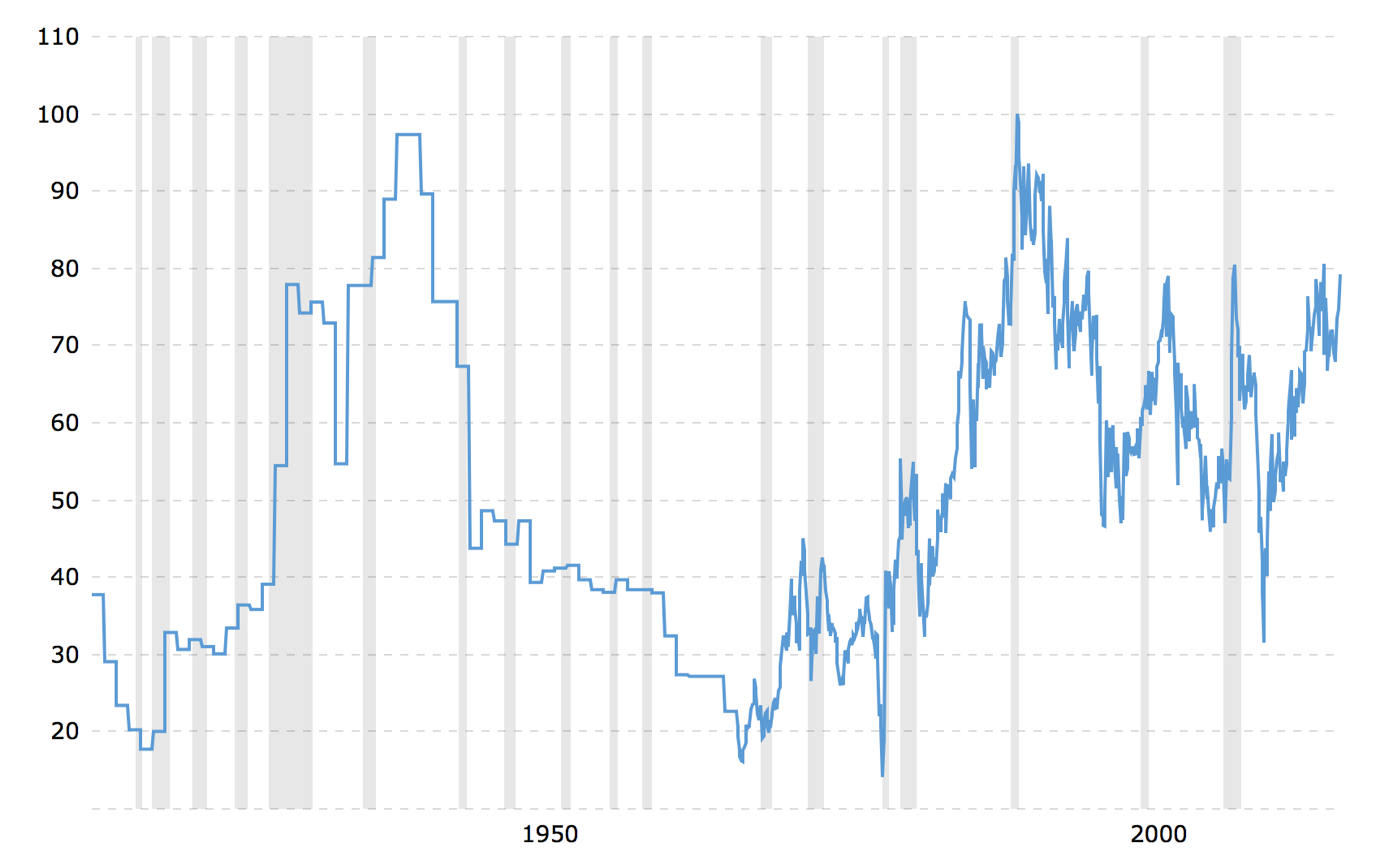
The above chart doesn’t include the most recent upswing in the ratio – we are already after a breakout above the previous recent highs and the next strong resistance is clearly at about 100 level. The round numbers tend to be more meaningful as resistance and support levels as they get people’s attention once they are approached or broken. And it’s really hard to come up with a number that’s any rounder than 100. The implications for the precious metals market are bearish for the following months.
Having said that, let’s take a look at the less important, but still quite interesting – short-term – charts.
Short-term Update on Gold, Silver and Miners
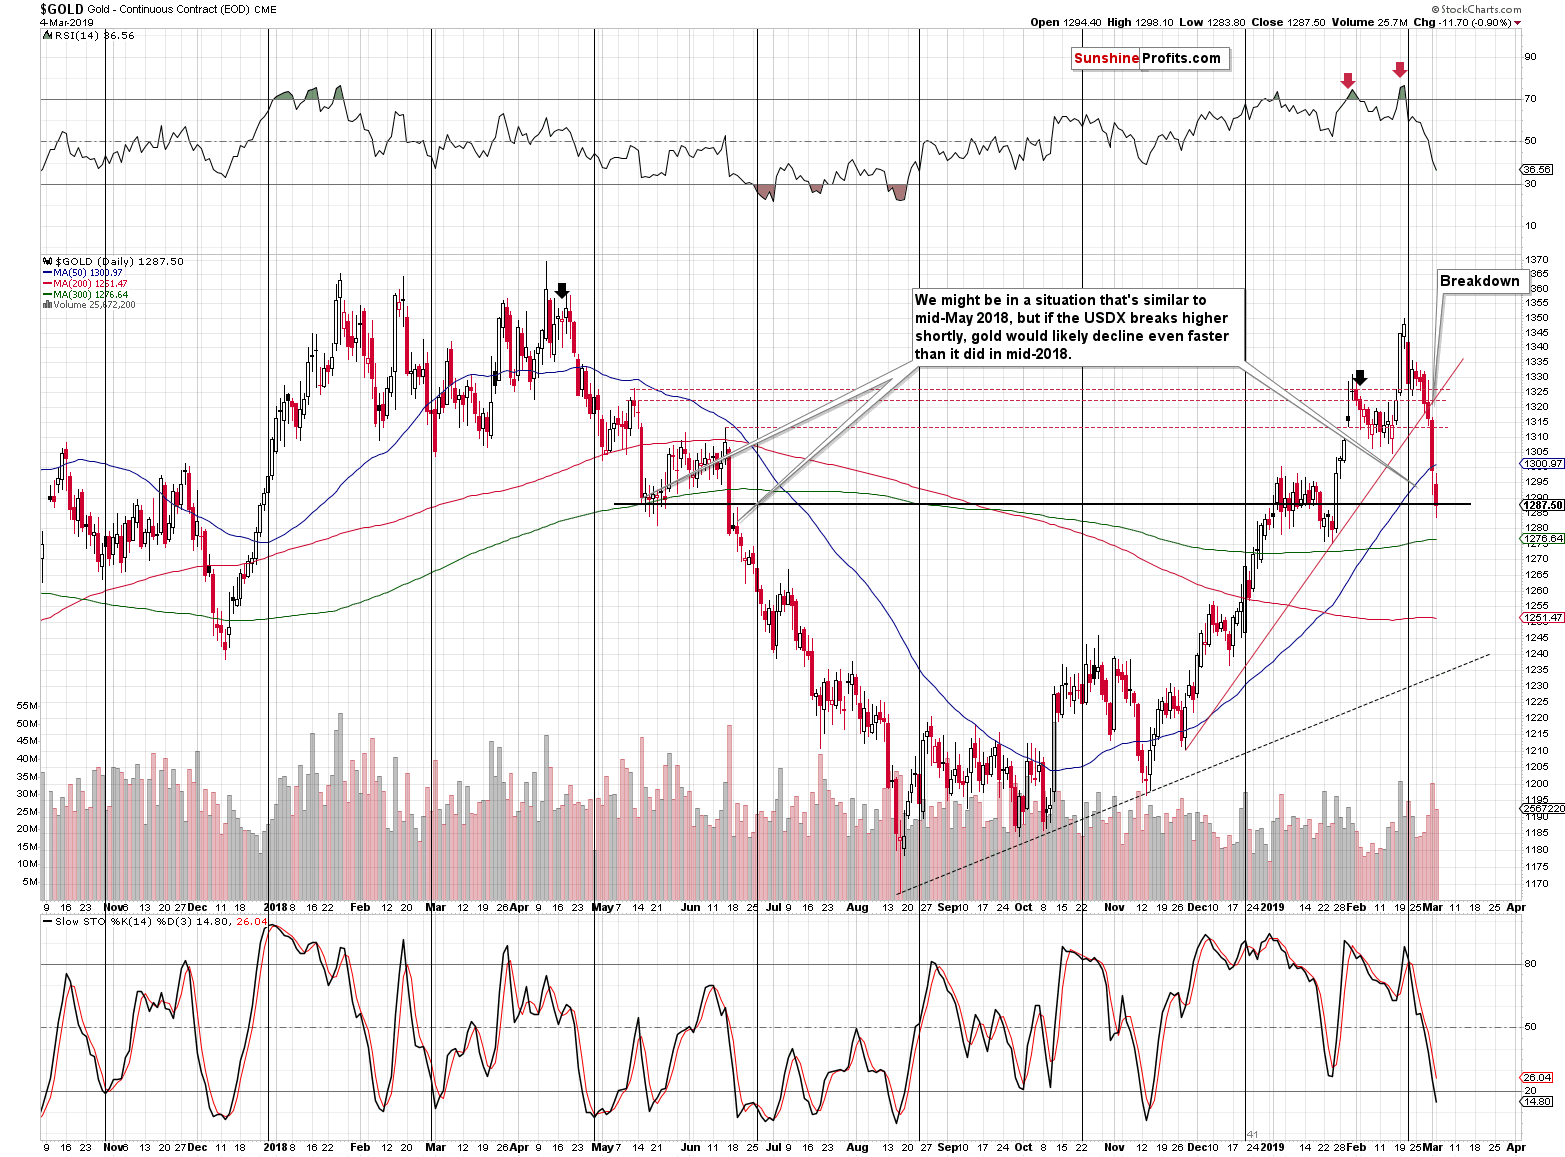
At the moment of writing these words, gold is trading close to yesterday’s intraday lows, but this doesn’t change much as far as short-term implications are concerned. Gold broke below the rising support line in a sharp manner and it stopped close to the May 2018 lows and between the early January 2019 highs and late January 2019 lows. Since the move was sharp, a day or a few days of pause or a brief corrective upswing would not be out of the question, but they are not inevitable.
Last year, gold declined from somewhat similar price levels and it paused in May. It corrected to about $1,310 and resumed the decline about a month later. The important thing is that it then erased more than the entire corrective upswing in just one day.
Before saying that it’s better not to wait a month for decline’s continuation, please note the following:
- The current situation may be similar to the initial downswing in June 2018, not the one that we saw in May 2018.
- In 2018, the decline followed a relatively calm period where gold moved back and forth for a few months and now gold is right after a relatively volatile upswing. This suggests more volatility on the downside as well.
- In May 2018, the USD Index was already after a major short-term upswing, while right now it seems that such an upswing is only beginning.
Consequently, it seems that adjusting the trading position based on the possibility of seeing a brief upswing is not justified from the risk to reward point of view.
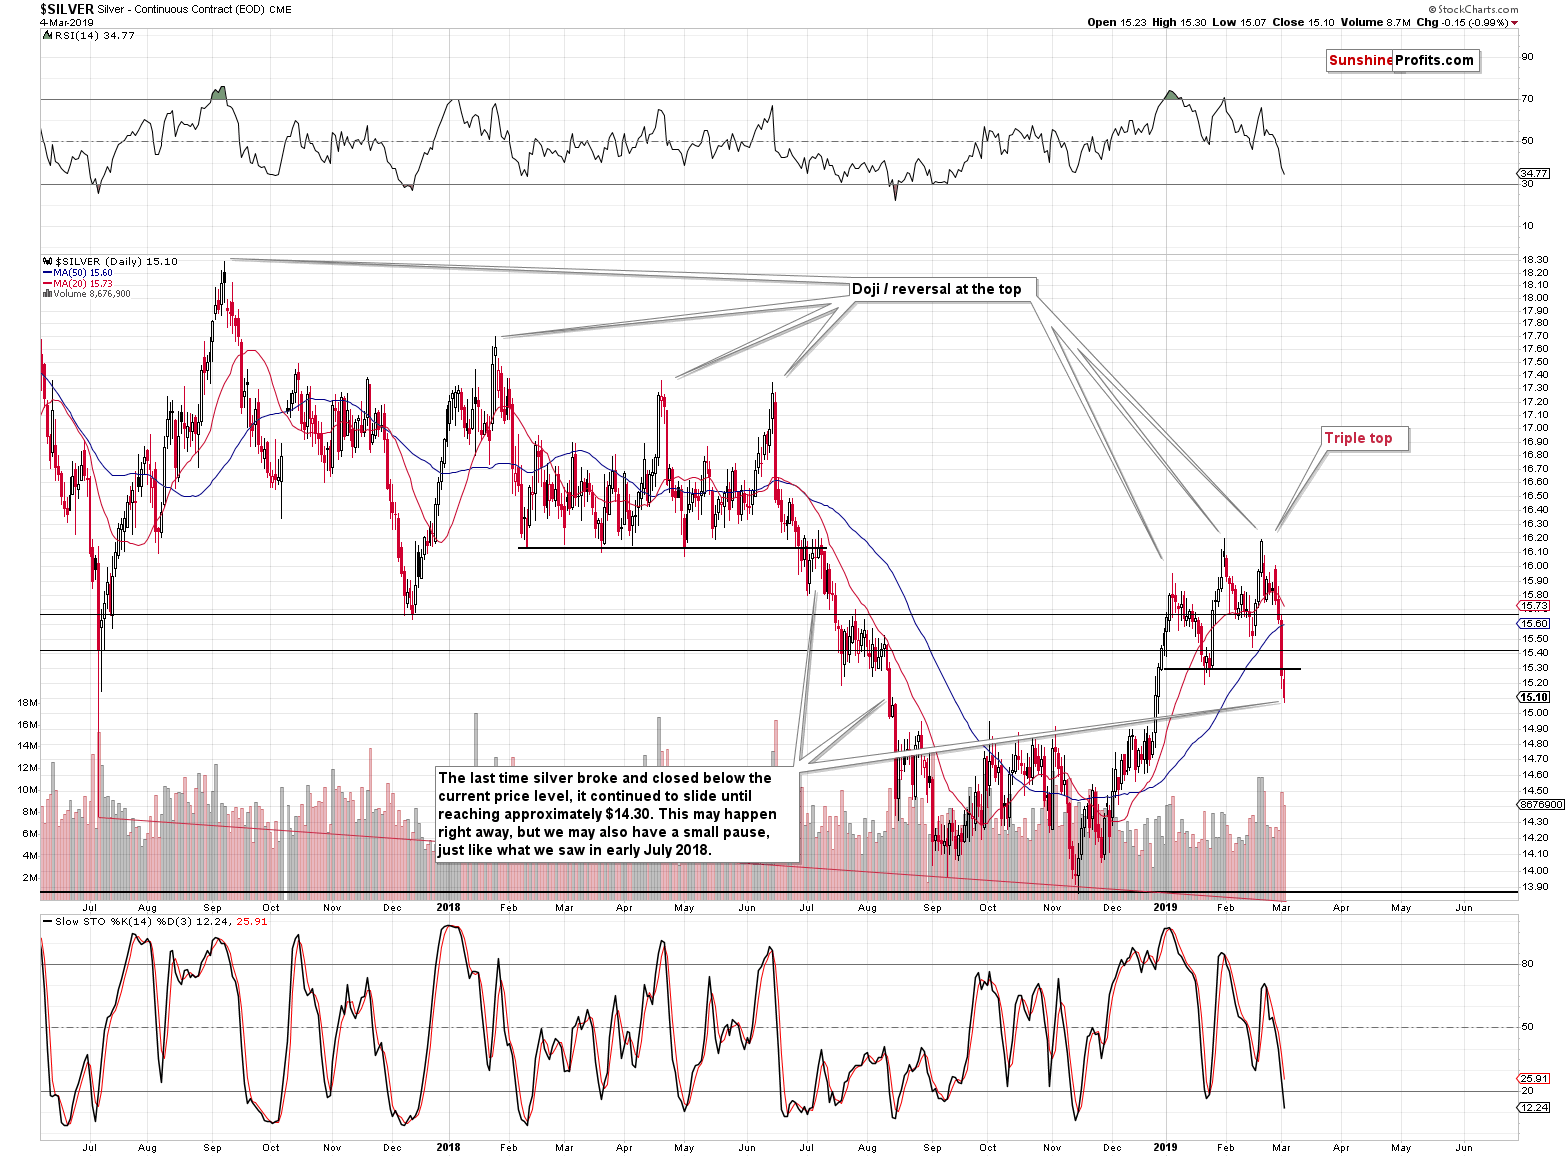
Silver is already after a major short-term breakdown, which suggests more weakness on the horizon. We saw something similar in late June 2018 and back then silver simply moved back to the previous lows and verified them as resistance. There were some moves above them in intraday terms, but none in terms of the daily closing prices (ok, silver close precisely 1 cent above the previous high in 2018, but that doesn’t really count). This means that if we see a corrective upswing here, then it’s not likely to be anything more than a $0.20 - $0.30 move higher.
Silver is likely to be very volatile during its downswing, so it seems much better to just wait out the possible bounce instead of risking missing the big slide.
Why would such a corrective upswing even be in the cards?
Because of yesterday’s quite bullish reversal in the mining stocks.
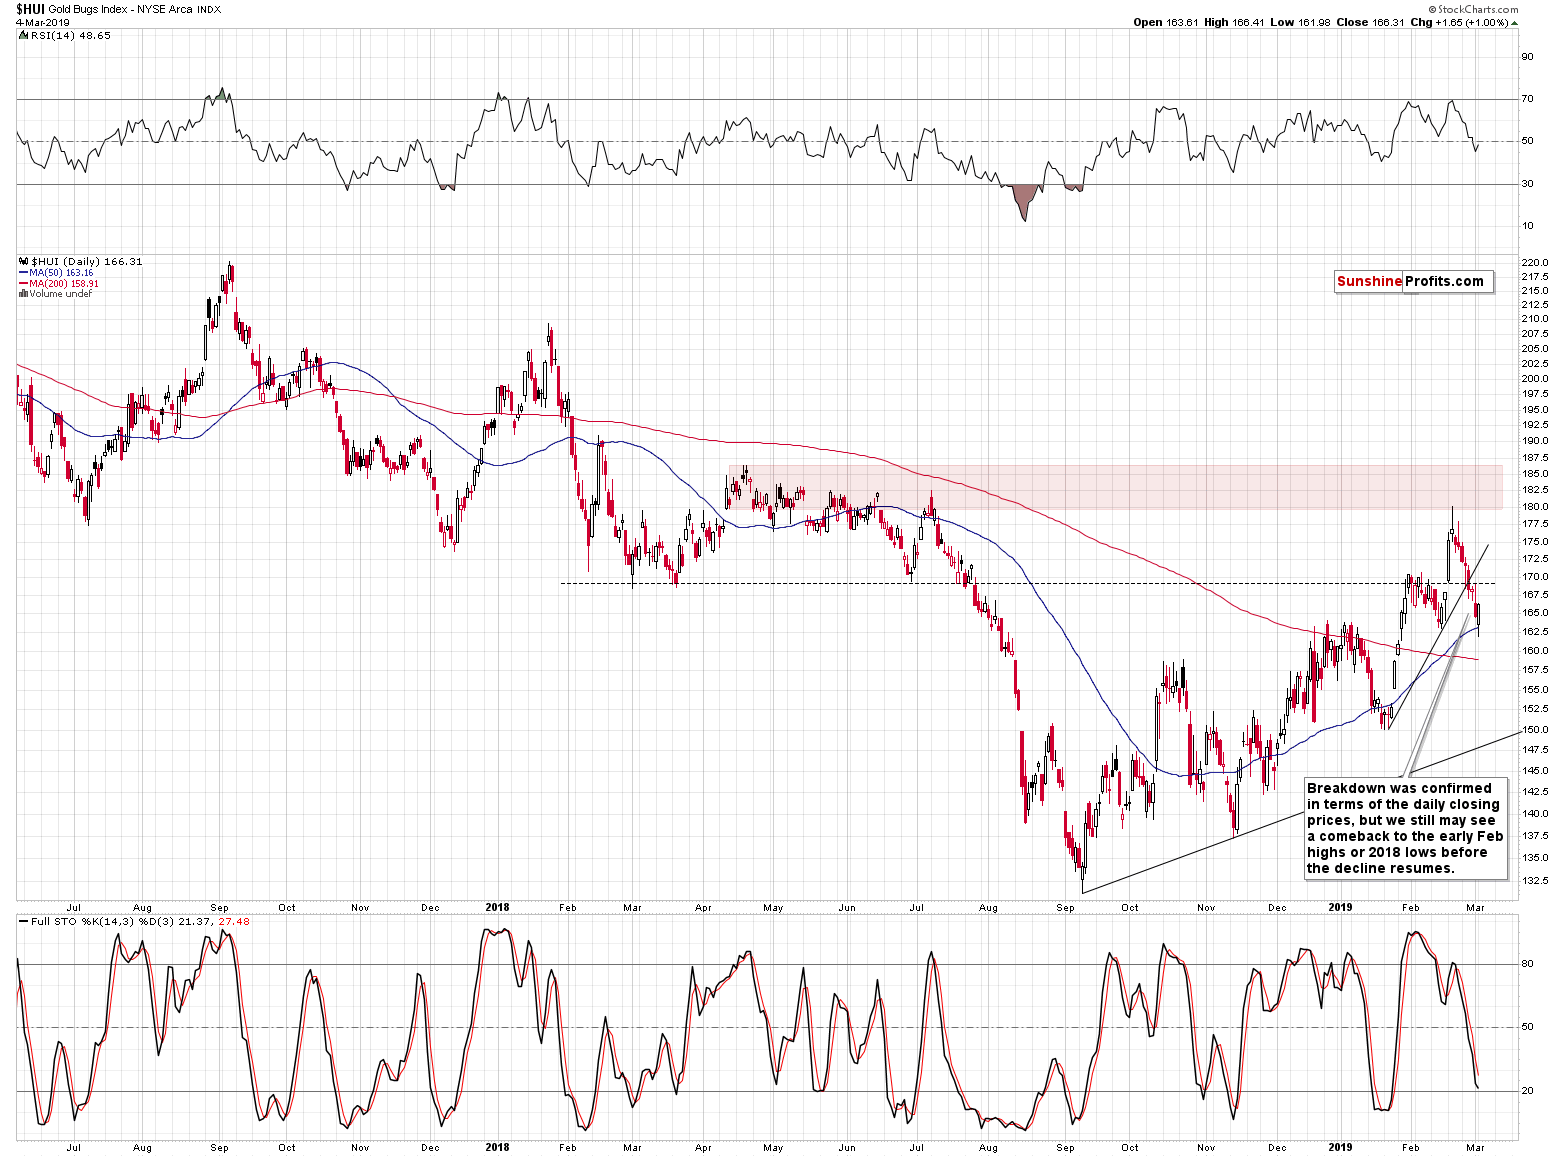
Gold miners invalidated their breakdown below the February lows, and they managed to do so despite a move lower in the underlying metal. This is a clearly bullish sign for the short term. Why would gold miners show this level of strength here? Are they really showing true strength or was there something else at play that helped them?
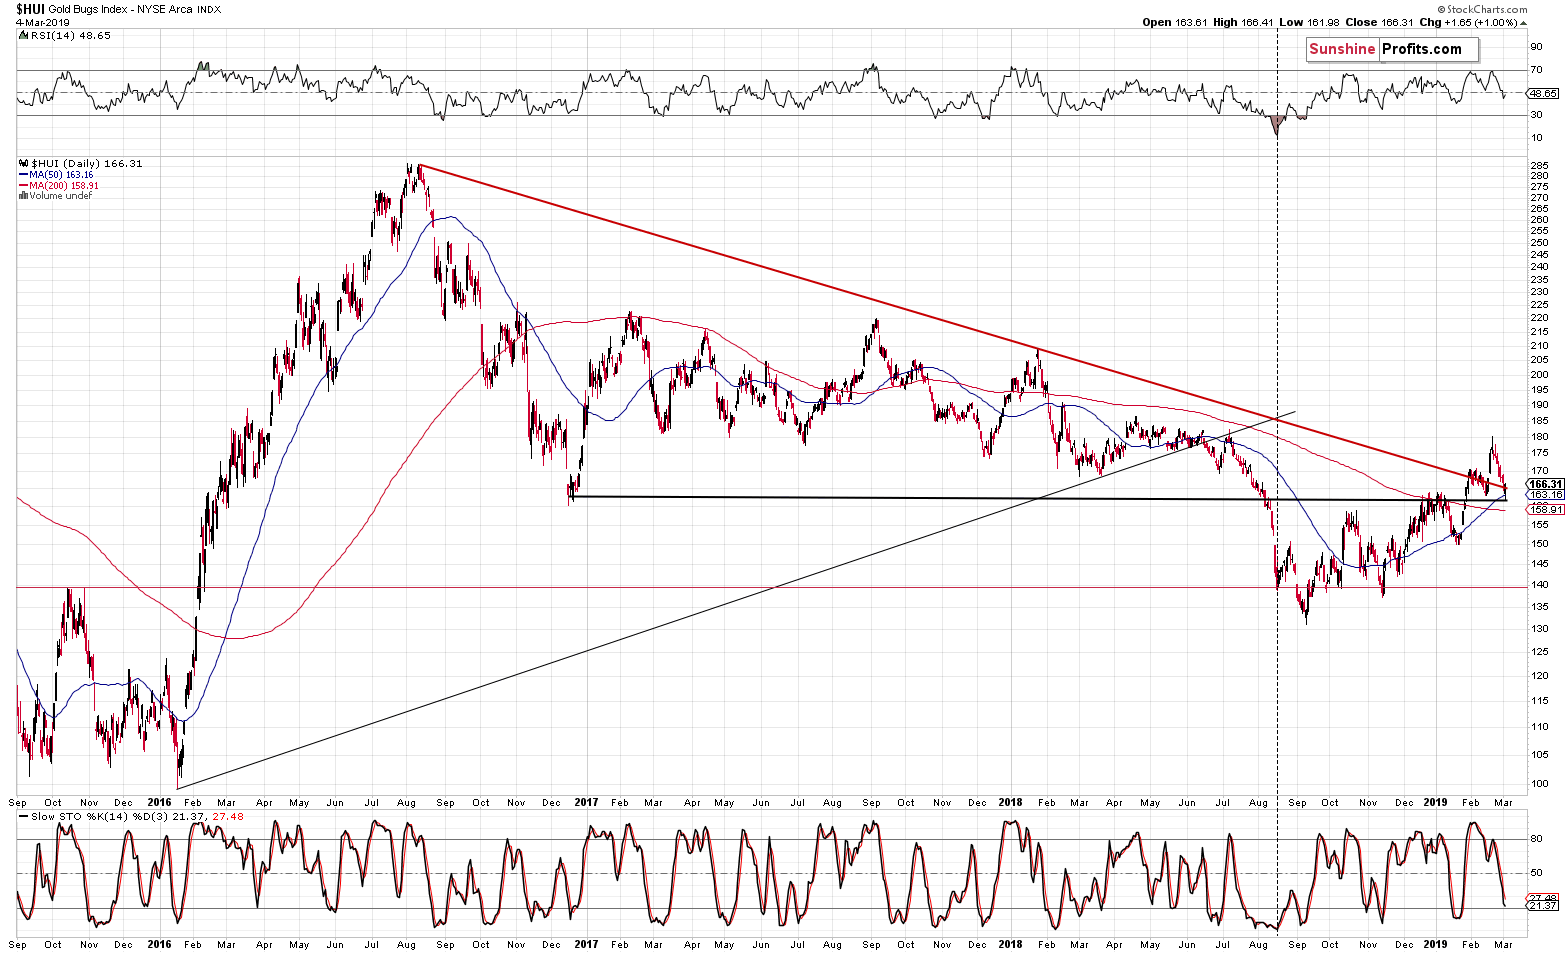
There was. Miners just moved back to their declining medium-term support line, which they had broken last month. At the same time, the HUI moved to the late 2016 low in intraday terms, not to mention the late 2018 and early 2019 highs. In other words, there is a strong combination of support levels just below the current mining stock prices.
Does this make temporary strength in the miners likely? Yes.
Does this mean that they won’t decline in a profound way if gold and silver slide? Absolutely not.
Without a good reason (be it fundamental or based on long-term technical factors), the technical support may trigger a quick short-term bounce, but nothing more is likely. This could mean a move back to the 170 level (early February highs) and then a move lower, during which the miners would break below the above-mentioned combination of support levels and then slide lower in a volatile manner, just like they did in August 2018 after breaking below the current levels.
The correction may take a bit longer or it may be barely noticeable, and both are acceptable with regard to long-term factors that will still remain extremely bearish in both cases. So what’s likely to decide whether the correction takes a bit longer or not?
The US dollar.
The King Dollar
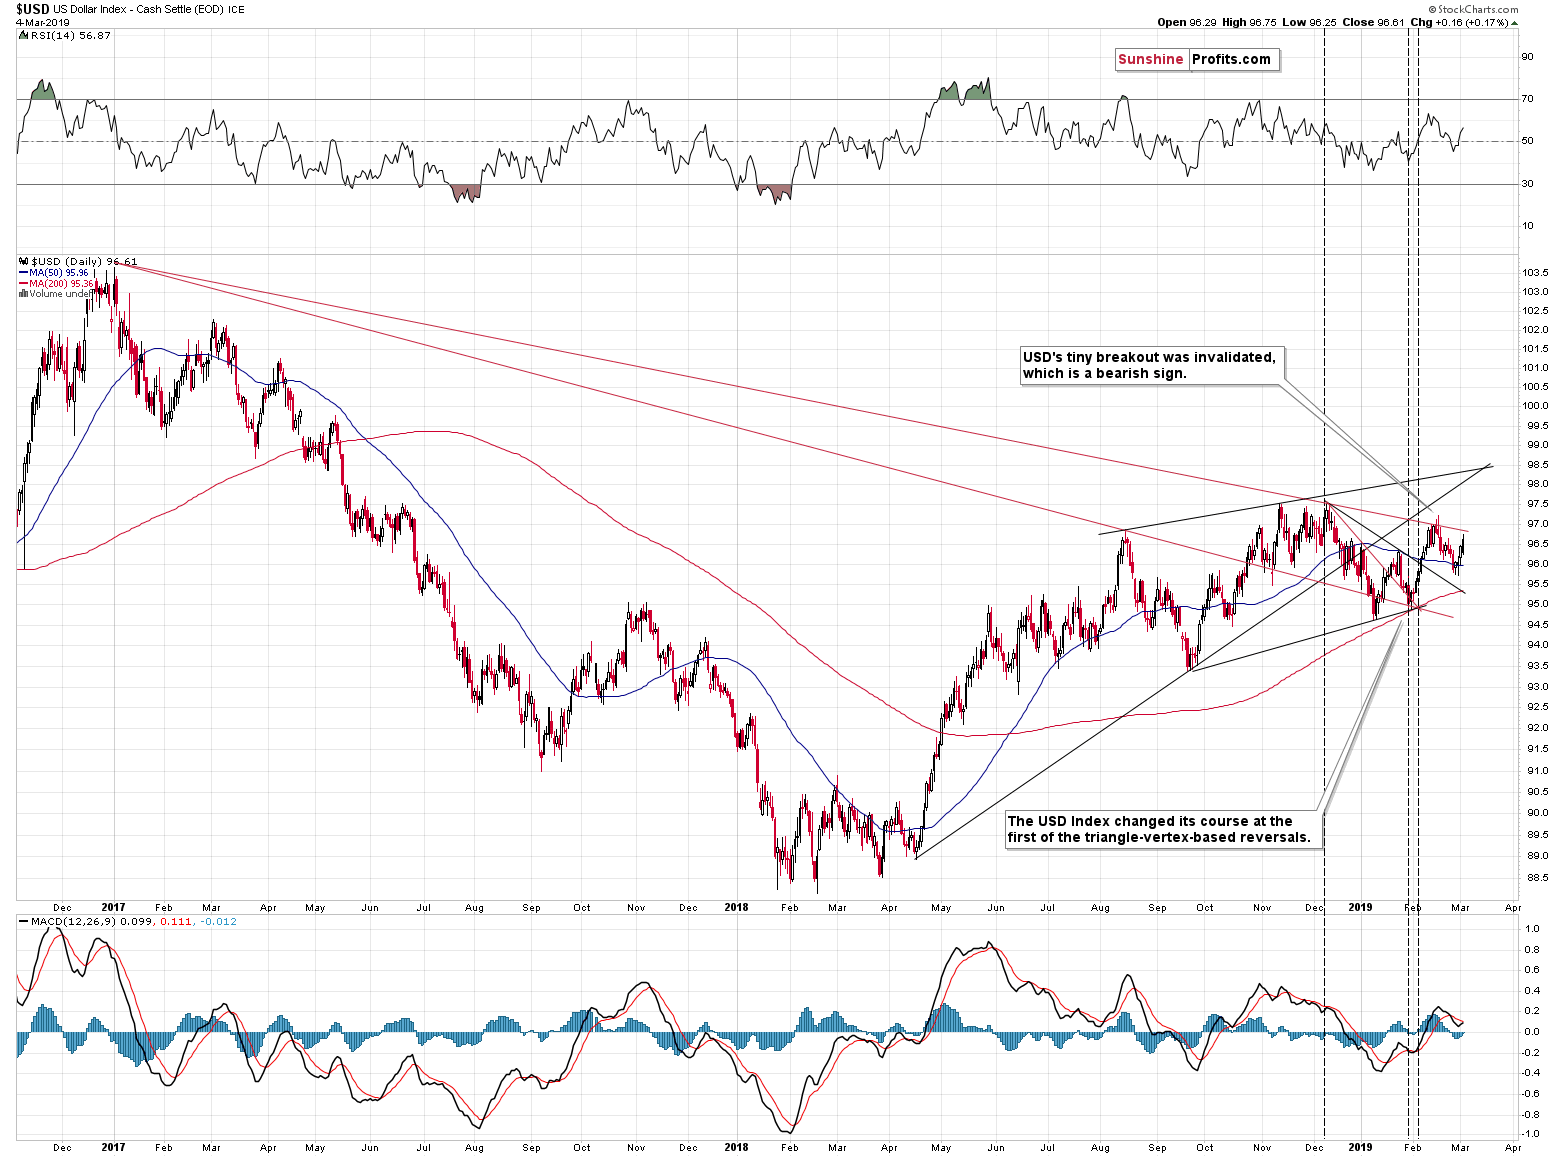
The US currency is moving higher, but it hasn’t broken above the previous highs or the declining red resistance line just yet. If the USD Index breaks above the latter, the precious metals sector might decline right away. However, once the USDX breaks above the 2018 highs in a decisive way, the precious metals market will almost certainly plunge. We described it on numerous occasions, but it seems it worth repeating that PMs often react more to both the breakouts and breakdowns in the USDX than to the moves themselves.
The medium-term outlook for the USD Index remains bullish and since it’s been moving in an upward sloping consolidation for many months, it seems that it’s about time for the USD to finally break out of it and continue its upward path. If the USD Index breaks out shortly, the PMs will likely slide before too long. If it doesn’t, we’ll likely see gold, silver and mining stocks taking an ordinary pause, or their moderately-paced decline.
Summary
Summing up, it’s almost certain that the next big move lower has already begun and that the 2013-like slide is in its early stage. Based on the updated version of the 2013-now link, the implications are even more bearish than we had initially assumed. The downside target for gold remains intact ($890), but it seems that the price moves in silver and mining stocks will take them even lower than we had originally thought. A move below $9 in silver, and a move to or below 80 in case of the HUI Index (perhaps much lower on a very temporary basis) are not out of the question.
In other words, the precious metals market is likely to erase everything that it had gained in the last several days, weeks, and months, and then decline much more before THE bottom is in.
As always, we’ll keep you – our subscribers – informed.
To summarize:
Trading capital (supplementary part of the portfolio; our opinion): Full short position (250% of the full position) in gold, silver, and mining stocks is justified from the risk/reward perspective with the following stop-loss orders and exit profit-take price levels:
- Gold: profit-take exit price: $1,062; stop-loss: $1,357; initial target price for the DGLD ETN: $82.96; stop-loss for the DGLD ETN $39.87
- Silver: profit-take exit price: $12.32; stop-loss: $16.44; initial target price for the DSLV ETN: $47.67; stop-loss for the DSLV ETN $23.68
- Mining stocks (price levels for the GDX ETF): profit-take exit price: $13.12; stop-loss: $24.17; initial target price for the DUST ETF: $76.87; stop-loss for the DUST ETF $15.47
Note: the above is a specific preparation for a possible sudden price drop, it does not reflect the most likely outcome. You will find a more detailed explanation in our August 1st Alert. In case one wants to bet on junior mining stocks’ prices (we do not suggest doing so – we think senior mining stocks are more predictable in the case of short-term trades – if one wants to do it anyway, we provide the details), here are the stop-loss details and target prices:
- GDXJ ETF: profit-take exit price: $17.52; stop-loss: $35.67
- JDST ETF: initial target price: $143.87 stop-loss: $30.97
Long-term capital (core part of the portfolio; our opinion): No positions (in other words: cash)
Insurance capital (core part of the portfolio; our opinion): Full position
Important Details for New Subscribers
Whether you already subscribed or not, we encourage you to find out how to make the most of our alerts and read our replies to the most common alert-and-gold-trading-related-questions.
Please note that the in the trading section we describe the situation for the day that the alert is posted. In other words, it we are writing about a speculative position, it means that it is up-to-date on the day it was posted. We are also featuring the initial target prices, so that you can decide whether keeping a position on a given day is something that is in tune with your approach (some moves are too small for medium-term traders and some might appear too big for day-traders).
Plus, you might want to read why our stop-loss orders are usually relatively far from the current price.
Please note that a full position doesn’t mean using all of the capital for a given trade. You will find details on our thoughts on gold portfolio structuring in the Key Insights section on our website.
As a reminder – “initial target price” means exactly that – an “initial” one, it’s not a price level at which we suggest closing positions. If this becomes the case (like it did in the previous trade) we will refer to these levels as levels of exit orders (exactly as we’ve done previously). Stop-loss levels, however, are naturally not “initial”, but something that, in our opinion, might be entered as an order.
Since it is impossible to synchronize target prices and stop-loss levels for all the ETFs and ETNs with the main markets that we provide these levels for (gold, silver and mining stocks – the GDX ETF), the stop-loss levels and target prices for other ETNs and ETF (among other: UGLD, DGLD, USLV, DSLV, NUGT, DUST, JNUG, JDST) are provided as supplementary, and not as “final”. This means that if a stop-loss or a target level is reached for any of the “additional instruments” (DGLD for instance), but not for the “main instrument” (gold in this case), we will view positions in both gold and DGLD as still open and the stop-loss for DGLD would have to be moved lower. On the other hand, if gold moves to a stop-loss level but DGLD doesn’t, then we will view both positions (in gold and DGLD) as closed. In other words, since it’s not possible to be 100% certain that each related instrument moves to a given level when the underlying instrument does, we can’t provide levels that would be binding. The levels that we do provide are our best estimate of the levels that will correspond to the levels in the underlying assets, but it will be the underlying assets that one will need to focus on regarding the signs pointing to closing a given position or keeping it open. We might adjust the levels in the “additional instruments” without adjusting the levels in the “main instruments”, which will simply mean that we have improved our estimation of these levels, not that we changed our outlook on the markets. We are already working on a tool that would update these levels on a daily basis for the most popular ETFs, ETNs and individual mining stocks.
Our preferred ways to invest in and to trade gold along with the reasoning can be found in the how to buy gold section. Additionally, our preferred ETFs and ETNs can be found in our Gold & Silver ETF Ranking.
As a reminder, Gold & Silver Trading Alerts are posted before or on each trading day (we usually post them before the opening bell, but we don't promise doing that each day). If there's anything urgent, we will send you an additional small alert before posting the main one.
=====
Latest Free Trading Alerts:
Powell’s testimony before the Congress is behind us. The ECB meeting is ahead of us. Will Draghi support the gold prices after recent declines?
Gold Falls Below $1,300 After Powell’s Testimony: What To Expect From The ECB Meeting?
=====
Thank you.
Sincerely,
Przemyslaw Radomski, CFA
Editor-in-chief, Gold & Silver Fund Manager

