

Briefly: in our opinion, full (250% of the regular size of the position) speculative short position in silver is justified from the risk/reward perspective at the moment of publishing this Alert.
Friday’s session provided us with some clues that made us reevaluate our actions. Some elements of the picture changed and some did not. The picture cleared and remained muddied at the same time. Yet, the takeouts are worthwhile. Let’s jump right in to take on the riddles and dutifully share the lessons.
One of the foundations of Stoicism is that you focus on what depends on you and you don’t put much weight on what doesn’t. This approach is useful with regard to many aspects of life. Someone doesn’t like you, even though you did nothing wrong to them and even did a few good things? That doesn’t depend on you and you should not worry about it. Someone doesn’t appreciate what you do and never thanks you? Never mind, it’s important that you’re doing the right thing and being a good person is a reward in its own right.
It can also apply to trading. In Friday’s Alert, we described how we are going to be prepared for the possible bearish final to the week, and we promised to let you know how things develop about an hour before the end of Friday’s session. We didn’t see the final bearish confirmations, so the entire preparation didn’t result in additional positions. The market action didn’t depend on us, but to be prepared – it did. And we were. Moving forward, it still doesn’t depend on us what the market will do, but it does depend on us to analyze it as objectively as possible, and report to you accordingly. So, let’s move right to it.
In the previous few Alerts we discussed the situation in the USD Index and the euro, and since these comments remain up-to-date, we will not go through them again today. Instead, we will focus on short- and long-term aspects of the key parts of the precious metals sector: gold, silver, and mining stocks. Let’s start with gold’s long-term chart.
Gold: The Different Perspectives
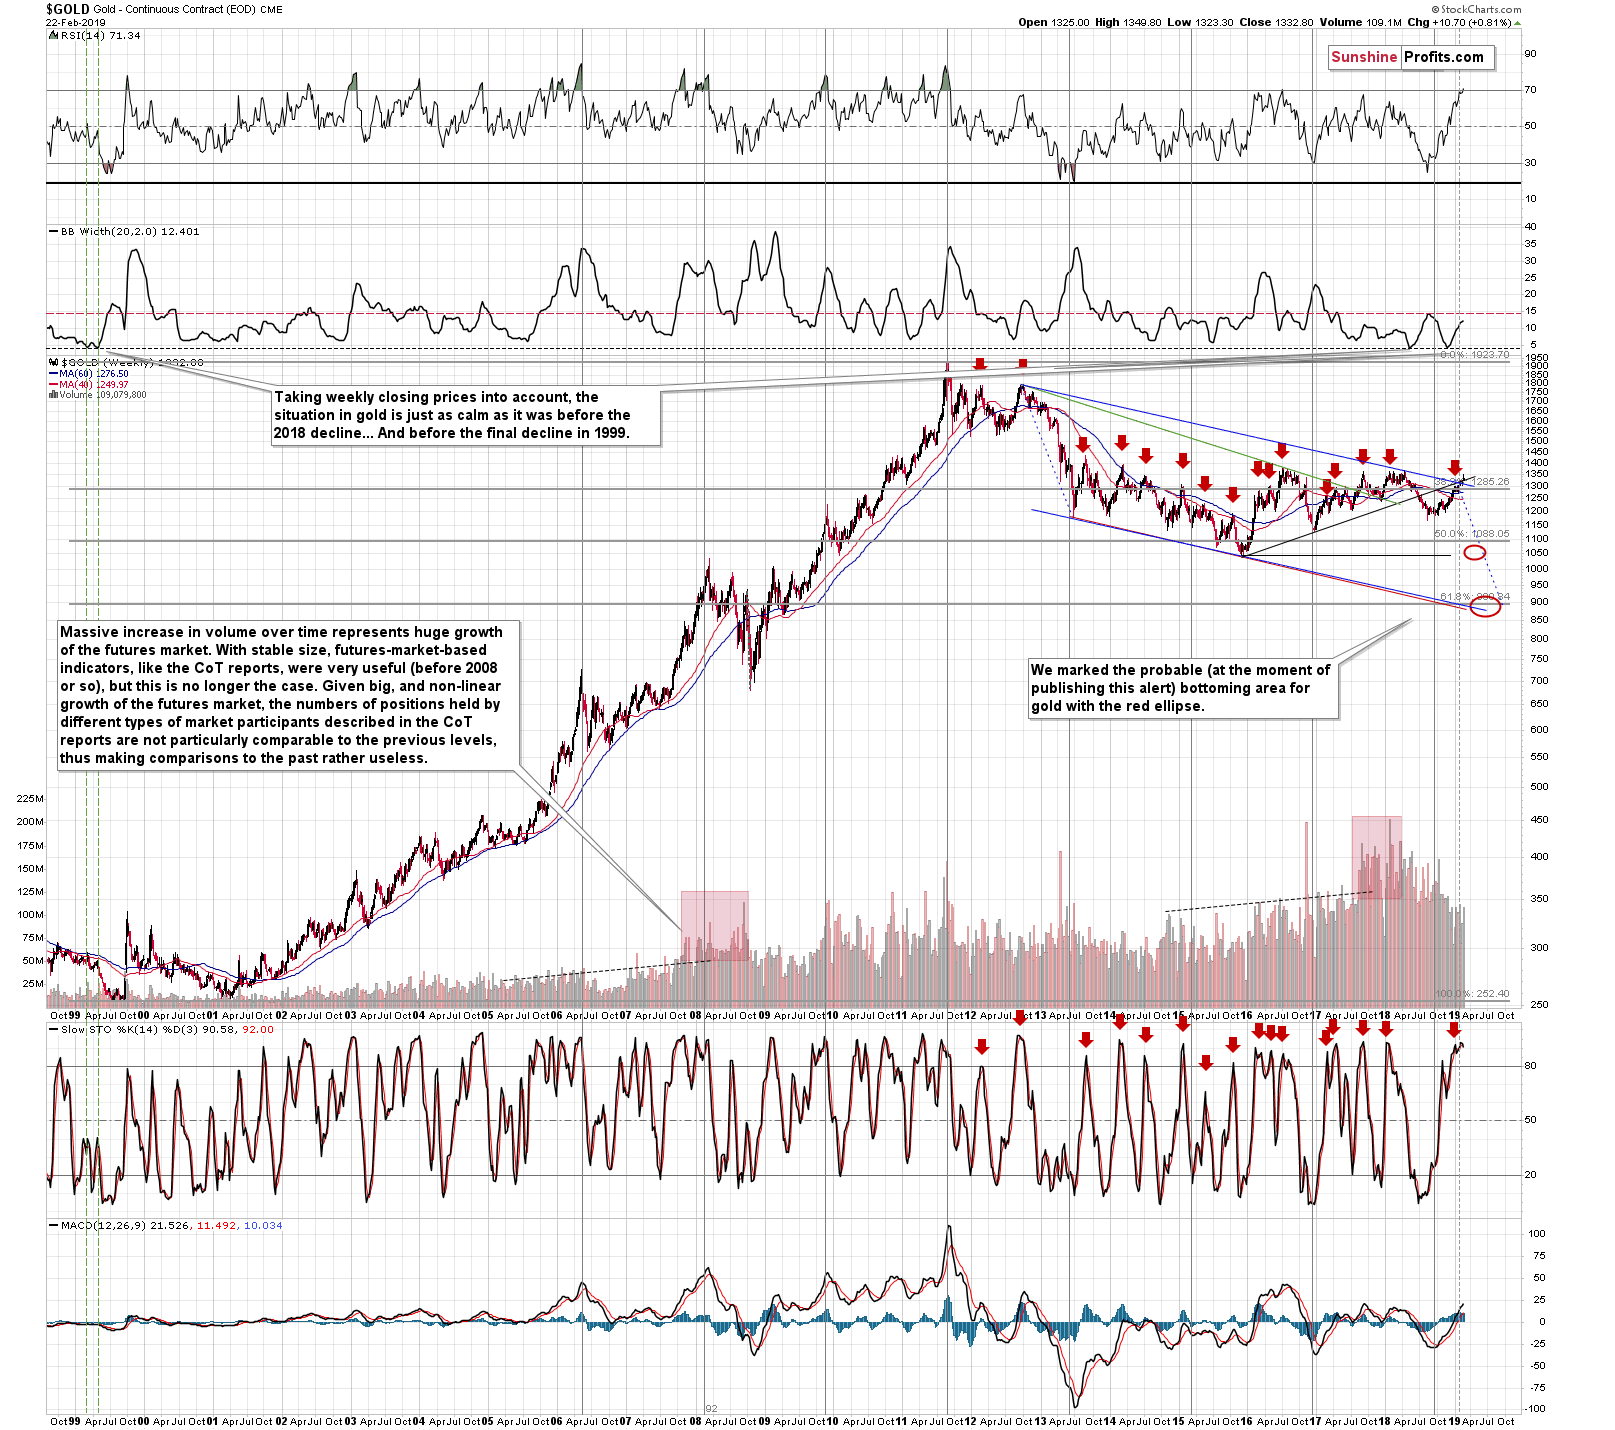
Gold moved higher recently and the volume that corresponded to this move was relatively low. Gold broke above the two strong resistance lines, but this – and the preceding rally – took place on relatively low volume, which makes it very doubtful that this move will be confirmed.
Weekly RSI above 70 and the sell signal from the weekly Stochastic indicator are a very bearish and powerful combination. The weekly shooting star candlestick also serves as a bearish sign. All this suggests that the recent breakout will be invalidated shortly. As you know, invalidations of breakouts are strong bearish signs on their own, so the outlook for the medium term remains very bearish.
On the short-term chart, however, things look much better.
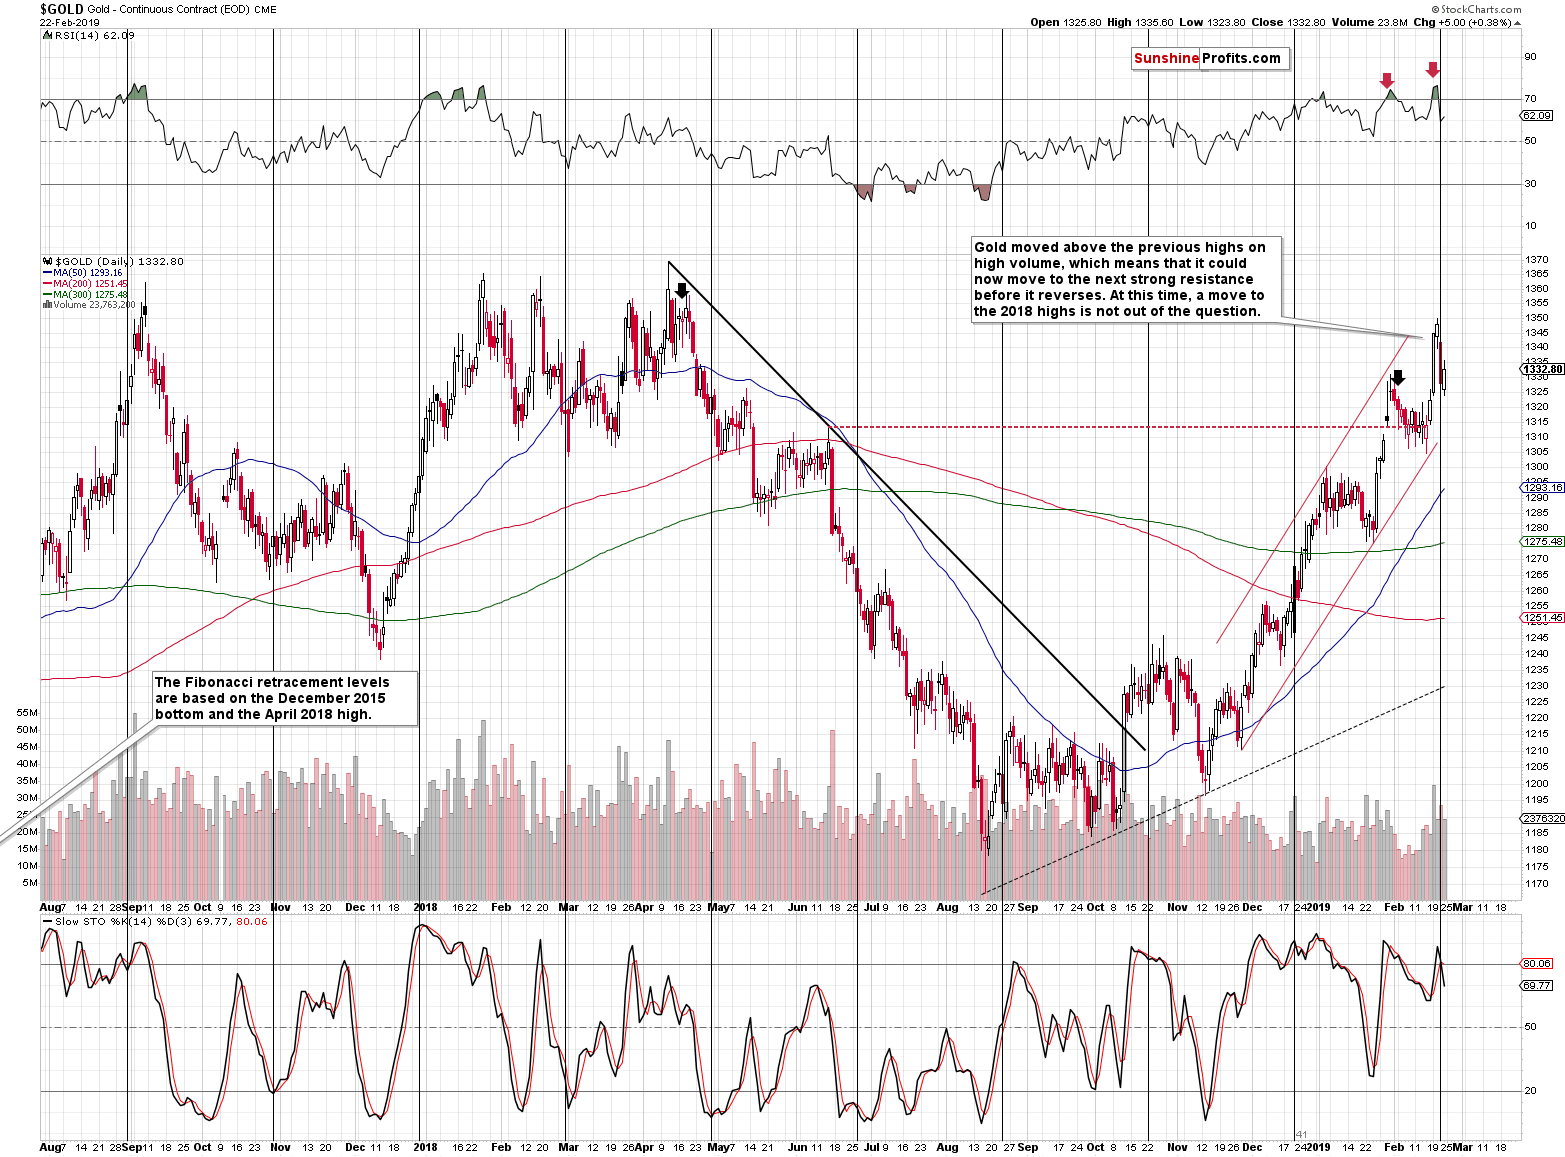
They look more bullish, because gold ultimately closed the week above the January high, and thus verified the breakout above it, instead of invalidating it. The daily RSI is no longer above 70, so it no longer tells us that lower prices ahead are very likely (in fairness though, it doesn’t suggest higher gold prices either).
On the bearish note, we have a sell signal from the daily Stochastic Oscillator, but it hasn’t been particularly reliable in the last few months, so it doesn’t necessarily change the picture much. What is more important, is that gold reversed practically right at its turning point, and thus that the trend has indeed quite likely changed.
The long-term picture for gold is bearish, while the short-term is more neutral.
Let’s turn to silver.
Silver’s Very Own Perspectives
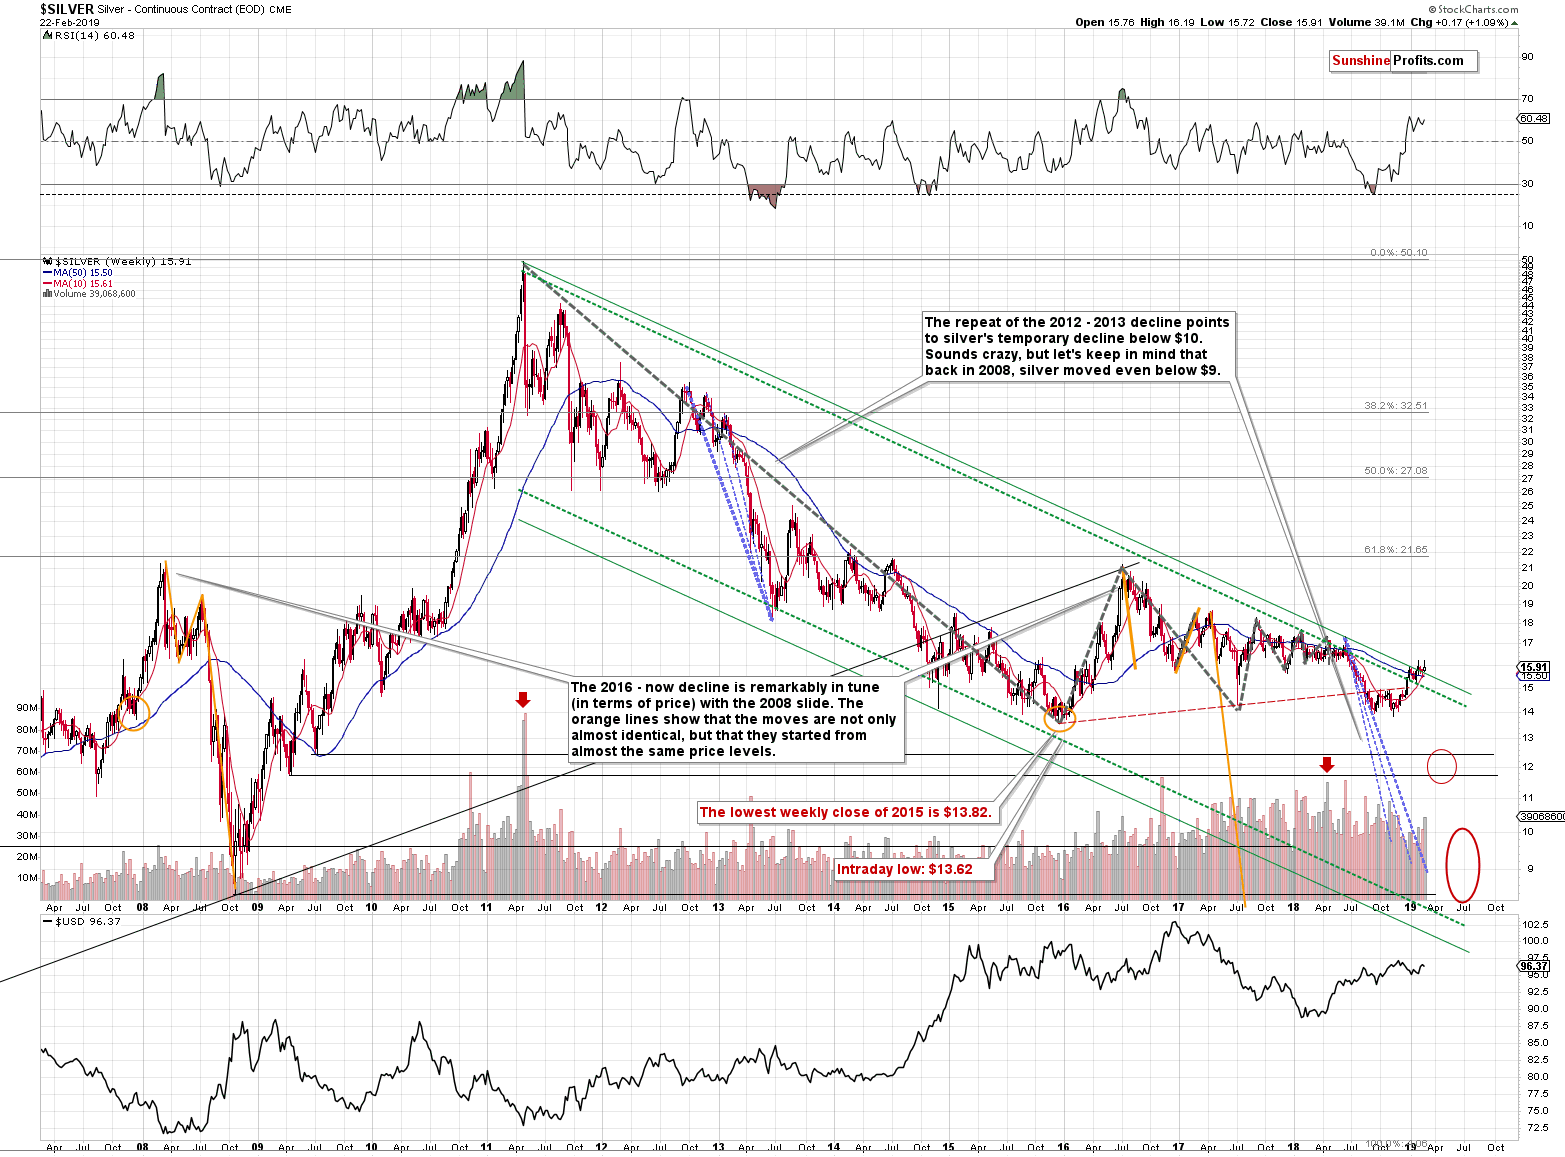
The weekly reversal is quite clear in case of the white metal. Weekly reversals are very bearish, especially when they are accompanied by strong volume. Last week’s volume in silver was the highest that we saw this year, so this is really the case right now. The tiny breakout above the declining green resistance line is therefore likely to be invalidated shortly and we can expect much lower silver prices in the coming weeks and months.
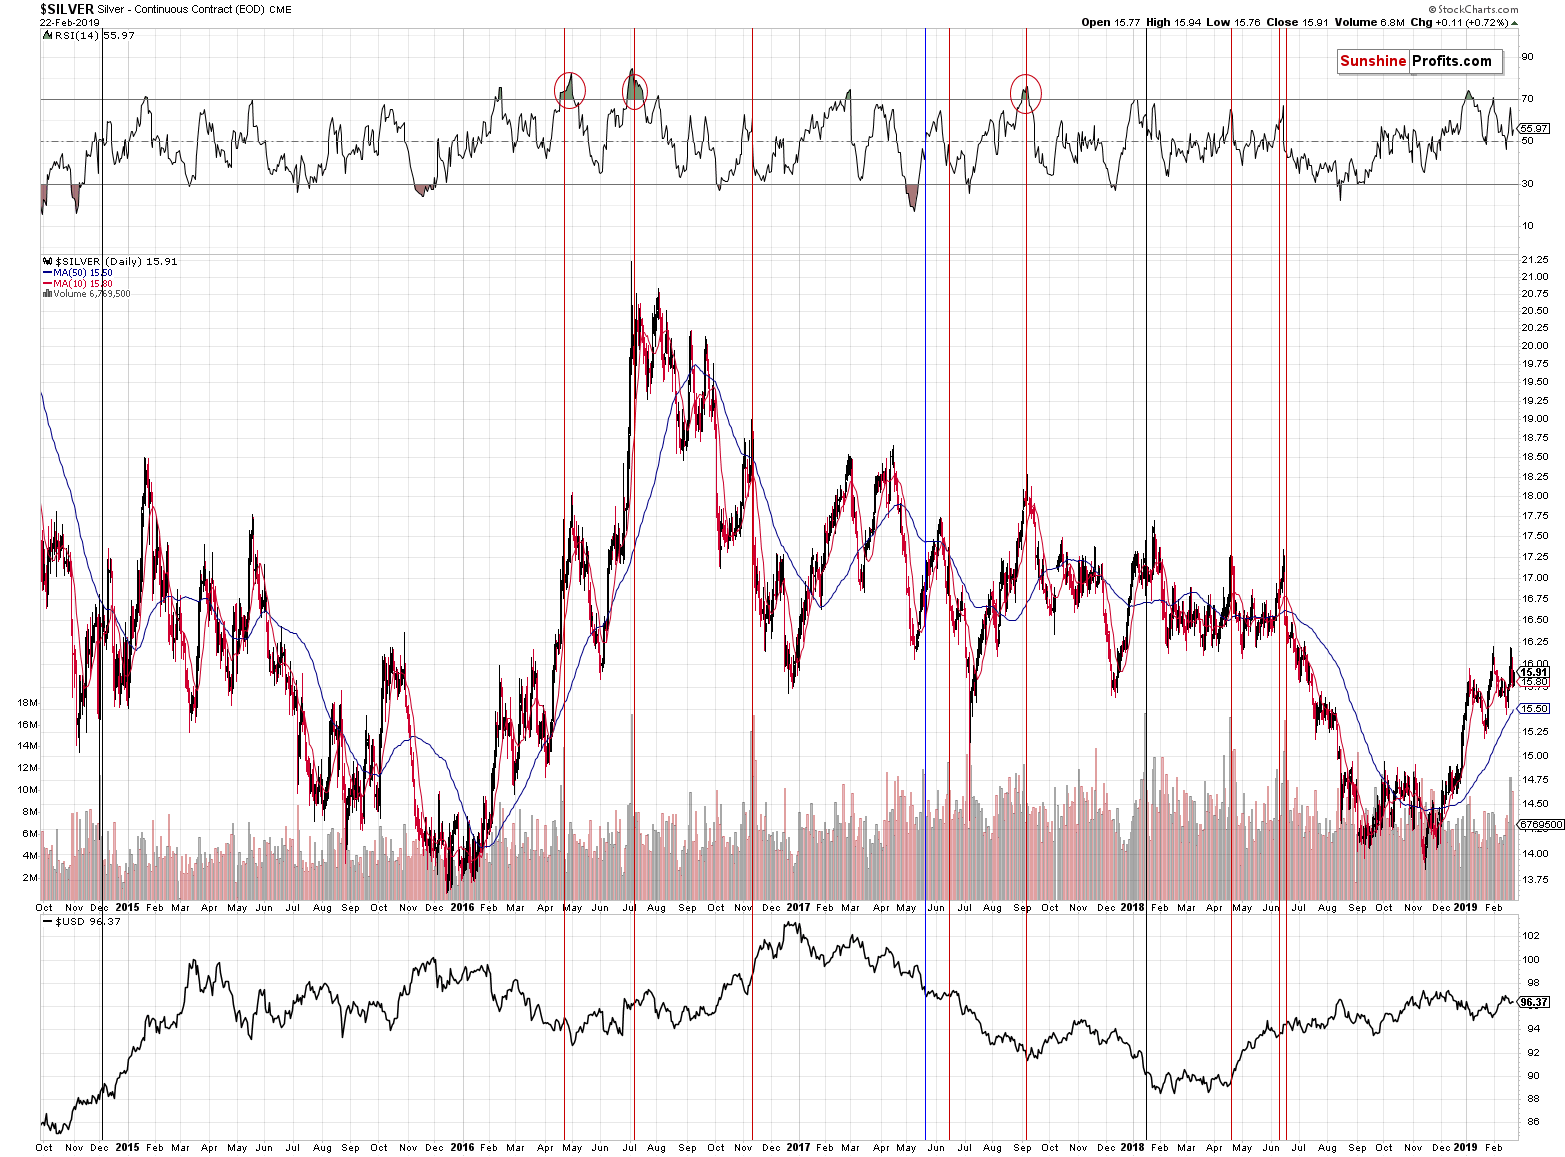
On a short-term note, silver’s outlook is bearish as well. The white metal didn’t move above its previous highs, but it did rally on very strong daily volume. In most cases, such volume spikes were followed by lower silver prices (as shown with the red vertical lines on the above chart), so the implications are bearish.
With a breakout absent, there was nothing to change the bearish outlook for the white metal. Since both: long- and short-term charts point to lower silver prices, the outlook is definitely bearish.
Before moving to mining stocks, please note how visibly silver underperforms gold on a medium-term basis. Yes, it rallied in the last few weeks, but please note how close gold is to its 2016 highs and how far silver is from its analogous price level. Even without mentioning the exact numbers (ok, silver is about $6 lower) it’s crystal clear that silver underperforms gold in the medium term.
And we can actually use the same analogy for gold miners with the same outcome.
Gold Miners and Their Underperformance
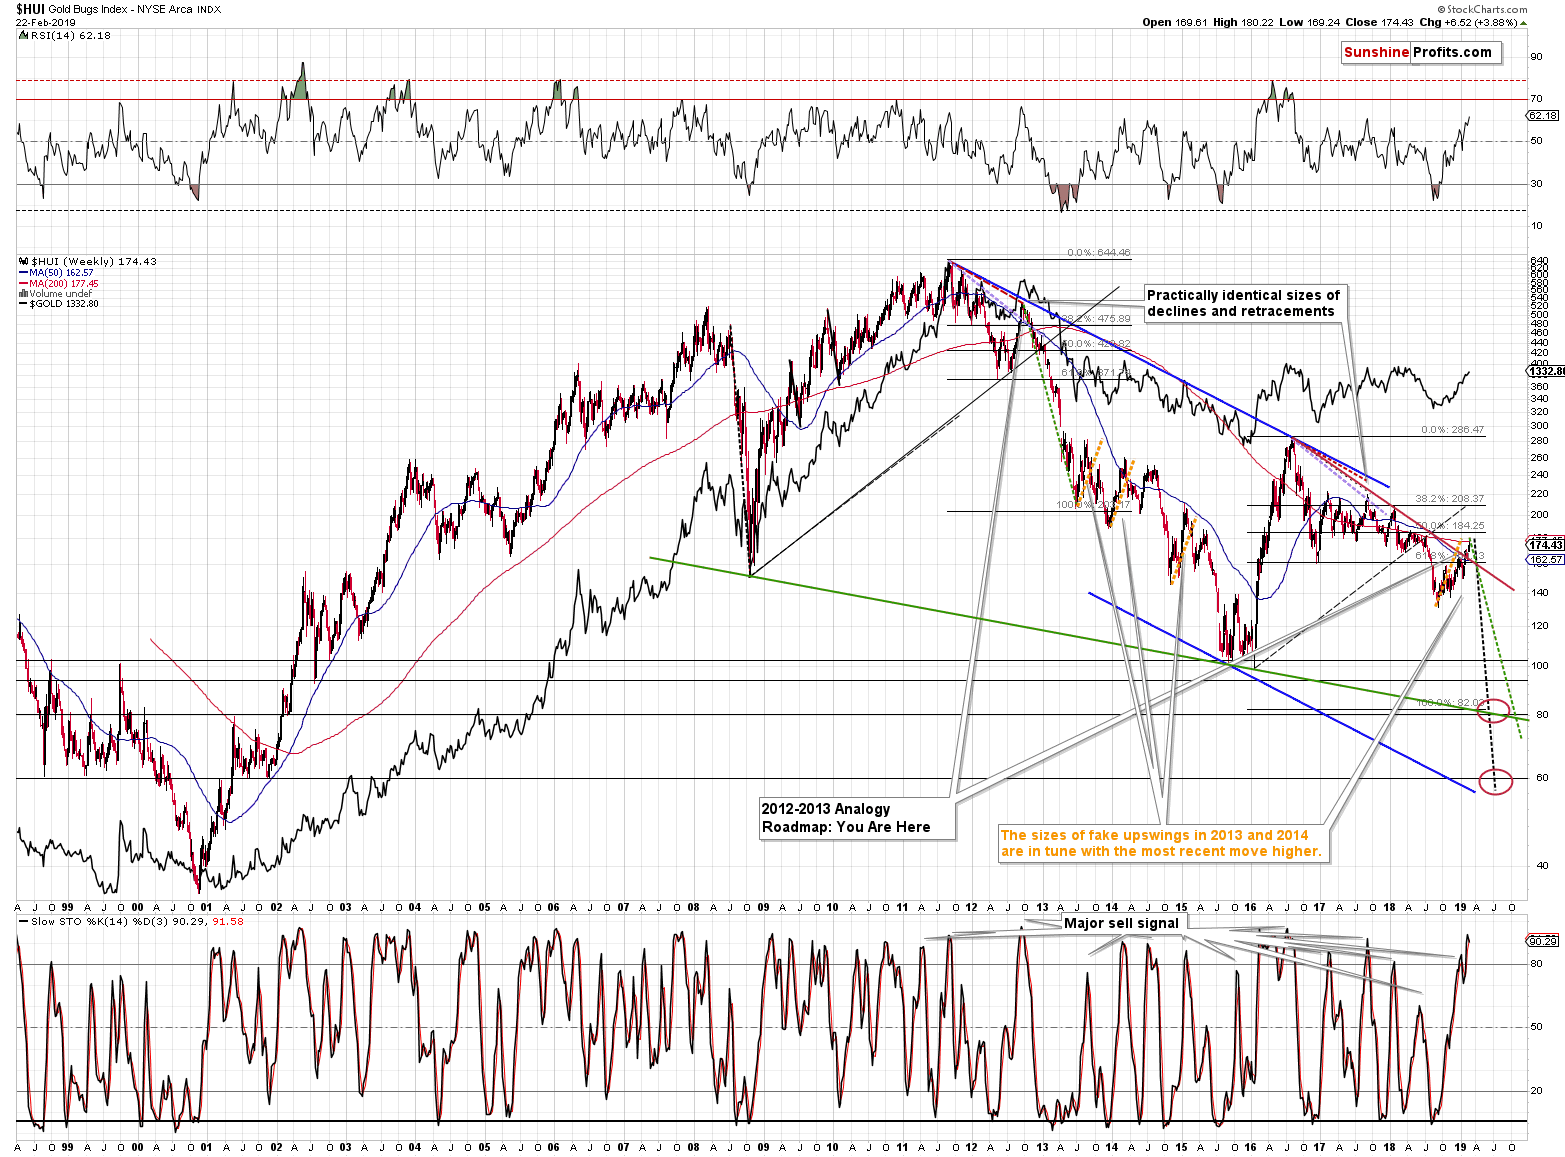
In this case, the difference is even more pronounced. The last several months of higher prices are nothing to call home about when examined from the long-term point of view. In fact, looking at the forest instead of discussing individual trees, shows us something very interesting.
Please take a look at the orange text and lines on the above chart. The most recent upswing (called “start of the new bull market” by many analysts and gold promoters) is actually just as big as the three corrective downswings that we saw during gold miners’ profound 2012 – 2016 decline. How profound can the implications of a rally truly be, if it’s just like the moves that were previously followed by powerful and volatile declines?
The weekly Stochastic indicator provides very useful signals in case of gold mining stocks. And by useful, we mean effective. It was almost always the case that we saw a major top when Stochastics flashed a weekly sell signal – and it did so based on last week’s closing prices.
But gold miners are rallying – just like in 2016!
They may have moved higher – that’s true, but this move was definitely not at all as it was in 2016. At least not with regard to the direction. In 2016 gold mines truly soared and outperformed gold, leading it higher. This is definitely not happening right now. The move is relatively small (compared to what happened in 2016) and gold stocks underperform gold, instead of leading it higher. The more likely analogy to 2016 is likely to be the fakeness of the breakout that we just saw. In early 2016, the HUI Index briefly broke below the previous lows and started the powerful rally right after invalidating this fake move. The opposite appears likely right now – miners are likely to invalidate their recent breakout and then decline with vengeance.
But the breakout did happen after all!
Yes, mining stocks moved above their declining red resistance line, which is generally a bullish phenomenon. However, we shouldn’t forget that the late 2012 top that started the biggest decline of the decade also started with a breakout – on the above chart you can see that as a move above the purple line. Given the situation on the long-term gold and silver charts, and in light of the analogy in terms of size of the previous corrective upswings, it’s doubtful that this breakout will hold.
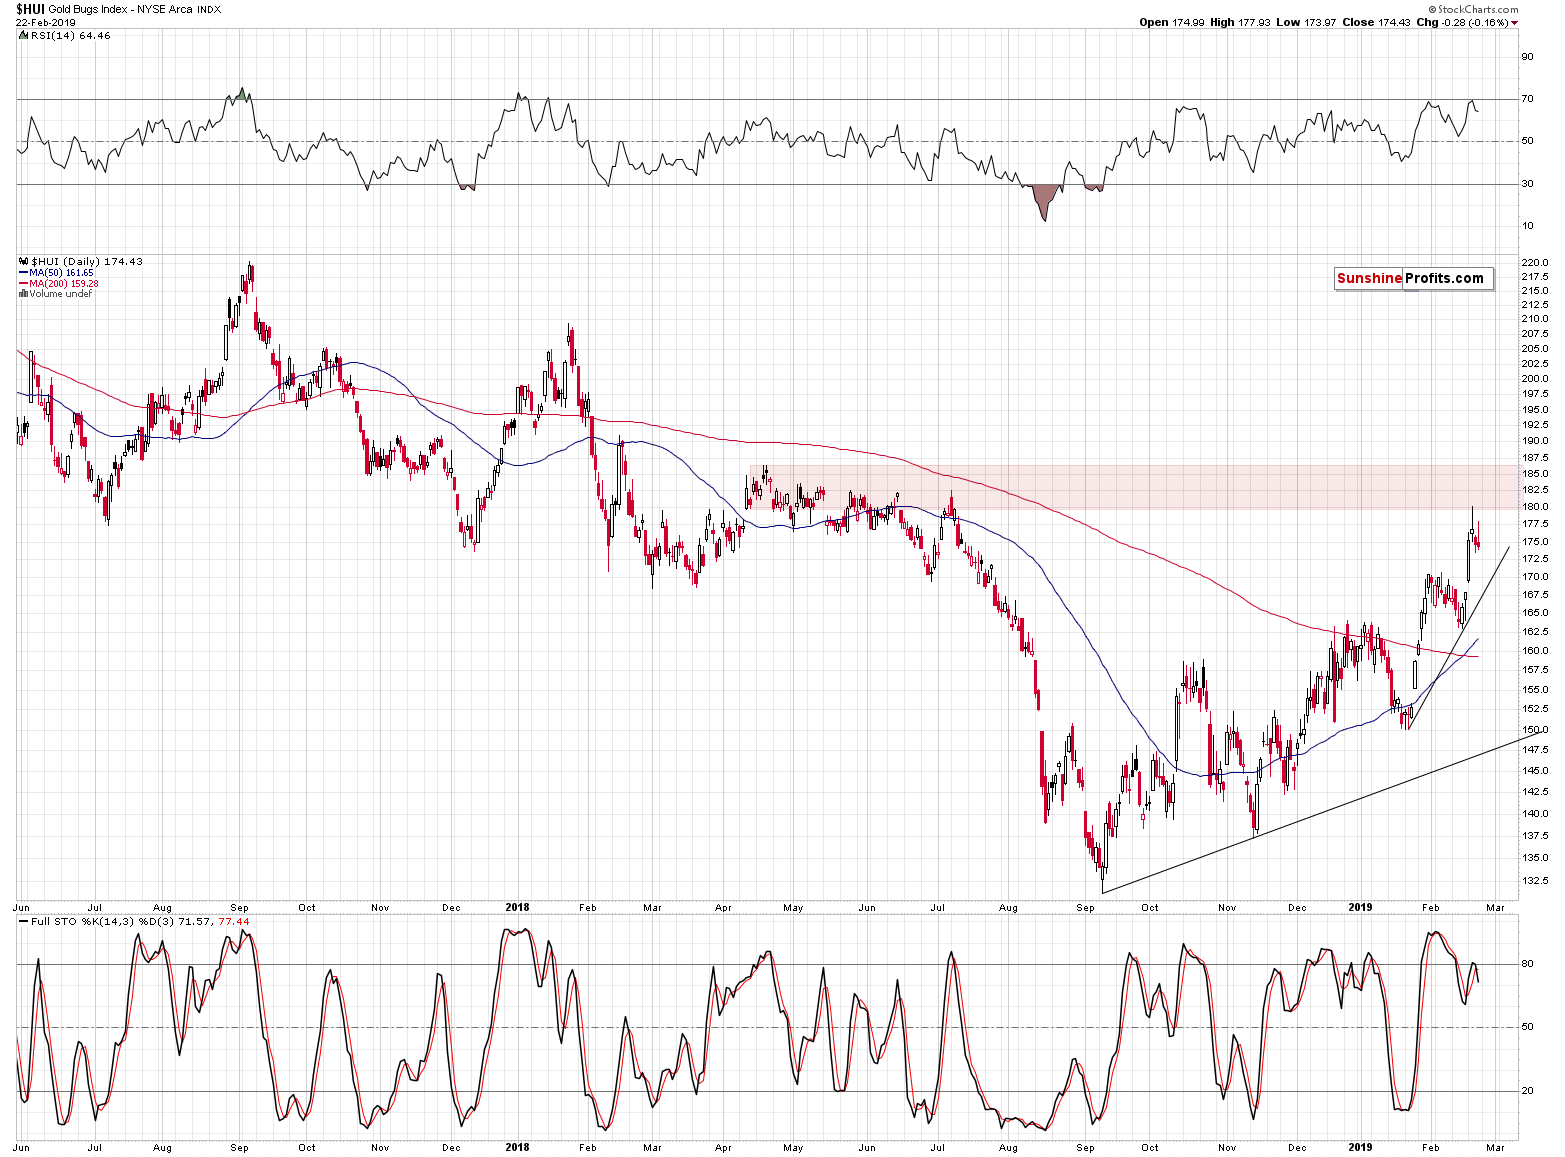
On a short-term note, we see that gold miners reached the resistance zone created by the mid-2018 tops based on intraday highs and closing prices. So far, the HUI Index was able to move to the July high in terms of intraday prices but it reversed shortly thereafter.
Gold stocks closed the week above their January highs, so we have a bullish sign here. At the same time, however, they formed another daily reversal and they underperformed gold by not managing to close the day higher. The RSI was just close to 70 and we have a new sell signal from the Stochastic indicator.
The short-term outlook looks rather unclear, but the big picture continues to point to lower prices. It seems that we will see short-term confirmations of the bearish case rather sooner than later. It also appears appropriate to wait for them before making changes to one’s trading capital, because – after all – the breakout above the January highs was confirmed.
Summary
Summing up, the precious metals sector seems to have reversed its course, but it’s too early to say that this is definitely the case right now. A lot will depend on this week’s signals with regard to short-term developments. The long-term charts continue to point to much lower gold, silver, and mining stock prices in the upcoming weeks and months. Based on the short-term indications, it seems too early to re-open the short positions in case of gold and mining stocks.
Please note that since the medium-term trend remains unaffected by the recent developments and the downside target remains intact (about $890 for gold), the precious metals market is likely to erase everything that it had gained in the last several days, weeks, and months, before THE bottom is in.
As always, we’ll keep you – our subscribers – informed.
To summarize:
Trading capital (supplementary part of the portfolio; our opinion): Full short positions (250% of the full position) in silver are justified from the risk/reward perspective with the following stop-loss orders and exit profit-take price levels:
- Gold: no position, but be prepared to enter the following position: profit-take exit price: $1,062; stop-loss: $1,357; initial target price for the DGLD ETN: $82.96; stop-loss for the DGLD ETN $39.87
- Silver: profit-take exit price: $12.32; stop-loss: $16.44; initial target price for the DSLV ETN: $47.67; stop-loss for the DSLV ETN $23.68
- Mining stocks (price levels for the GDX ETF): no position, but be prepared to enter the following position: profit-take exit price: $13.12; stop-loss: $24.17; initial target price for the DUST ETF: $76.87; stop-loss for the DUST ETF $15.47
Note: the above is a specific preparation for a possible sudden price drop, it does not reflect the most likely outcome. You will find a more detailed explanation in our August 1st Alert. In case one wants to bet on junior mining stocks’ prices (we do not suggest doing so – we think senior mining stocks are more predictable in the case of short-term trades – if one wants to do it anyway, we provide the details), here are the stop-loss details and target prices:
- GDXJ ETF: profit-take exit price: $17.52; stop-loss: $35.67
- JDST ETF: initial target price: $143.87 stop-loss: $30.97
Long-term capital (core part of the portfolio; our opinion): No positions (in other words: cash)
Insurance capital (core part of the portfolio; our opinion): Full position
Important Details for New Subscribers
Whether you already subscribed or not, we encourage you to find out how to make the most of our alerts and read our replies to the most common alert-and-gold-trading-related-questions.
Please note that the in the trading section we describe the situation for the day that the alert is posted. In other words, it we are writing about a speculative position, it means that it is up-to-date on the day it was posted. We are also featuring the initial target prices, so that you can decide whether keeping a position on a given day is something that is in tune with your approach (some moves are too small for medium-term traders and some might appear too big for day-traders).
Plus, you might want to read why our stop-loss orders are usually relatively far from the current price.
Please note that a full position doesn’t mean using all of the capital for a given trade. You will find details on our thoughts on gold portfolio structuring in the Key Insights section on our website.
As a reminder – “initial target price” means exactly that – an “initial” one, it’s not a price level at which we suggest closing positions. If this becomes the case (like it did in the previous trade) we will refer to these levels as levels of exit orders (exactly as we’ve done previously). Stop-loss levels, however, are naturally not “initial”, but something that, in our opinion, might be entered as an order.
Since it is impossible to synchronize target prices and stop-loss levels for all the ETFs and ETNs with the main markets that we provide these levels for (gold, silver and mining stocks – the GDX ETF), the stop-loss levels and target prices for other ETNs and ETF (among other: UGLD, DGLD, USLV, DSLV, NUGT, DUST, JNUG, JDST) are provided as supplementary, and not as “final”. This means that if a stop-loss or a target level is reached for any of the “additional instruments” (DGLD for instance), but not for the “main instrument” (gold in this case), we will view positions in both gold and DGLD as still open and the stop-loss for DGLD would have to be moved lower. On the other hand, if gold moves to a stop-loss level but DGLD doesn’t, then we will view both positions (in gold and DGLD) as closed. In other words, since it’s not possible to be 100% certain that each related instrument moves to a given level when the underlying instrument does, we can’t provide levels that would be binding. The levels that we do provide are our best estimate of the levels that will correspond to the levels in the underlying assets, but it will be the underlying assets that one will need to focus on regarding the signs pointing to closing a given position or keeping it open. We might adjust the levels in the “additional instruments” without adjusting the levels in the “main instruments”, which will simply mean that we have improved our estimation of these levels, not that we changed our outlook on the markets. We are already working on a tool that would update these levels on a daily basis for the most popular ETFs, ETNs and individual mining stocks.
Our preferred ways to invest in and to trade gold along with the reasoning can be found in the how to buy gold section. Additionally, our preferred ETFs and ETNs can be found in our Gold & Silver ETF Ranking.
As a reminder, Gold & Silver Trading Alerts are posted before or on each trading day (we usually post them before the opening bell, but we don't promise doing that each day). If there's anything urgent, we will send you an additional small alert before posting the main one.
=====
Latest Free Trading Alerts:
The broad stock market slightly extended its short-term uptrend on Friday following breaking above the recent consolidation. But will stocks continue higher despite some clear technical overbought conditions?
S&P 500 Gets Closer to 2,800, Will Stocks Continue Higher?
=====
Thank you.
Sincerely,
Przemyslaw Radomski, CFA
Editor-in-chief, Gold & Silver Fund Manager

