

Briefly: In our opinion, small (100% of the regular size of the position) speculative long positions in gold, silver and mining stocks are justified from the risk/reward perspective at the moment of publishing this alert.
After three weeks of declines, gold finally moved higher last week. Was this move surprising? Not at all, if you read our analysis of the previous week’s huge decline in platinum. The sizable slide in the latter was likely to trigger at least a small rally and that’s what we saw last week. However, gold reversed quite clearly on Friday and shooting star candlesticks, as these sessions are called, are signs of a reversal. Did we see one?
That’s not likely. There are several reasons not to believe the shooting start in gold. Let’s take a look at yellow metal’s chart for details (chart courtesy of http://stockcharts.com).
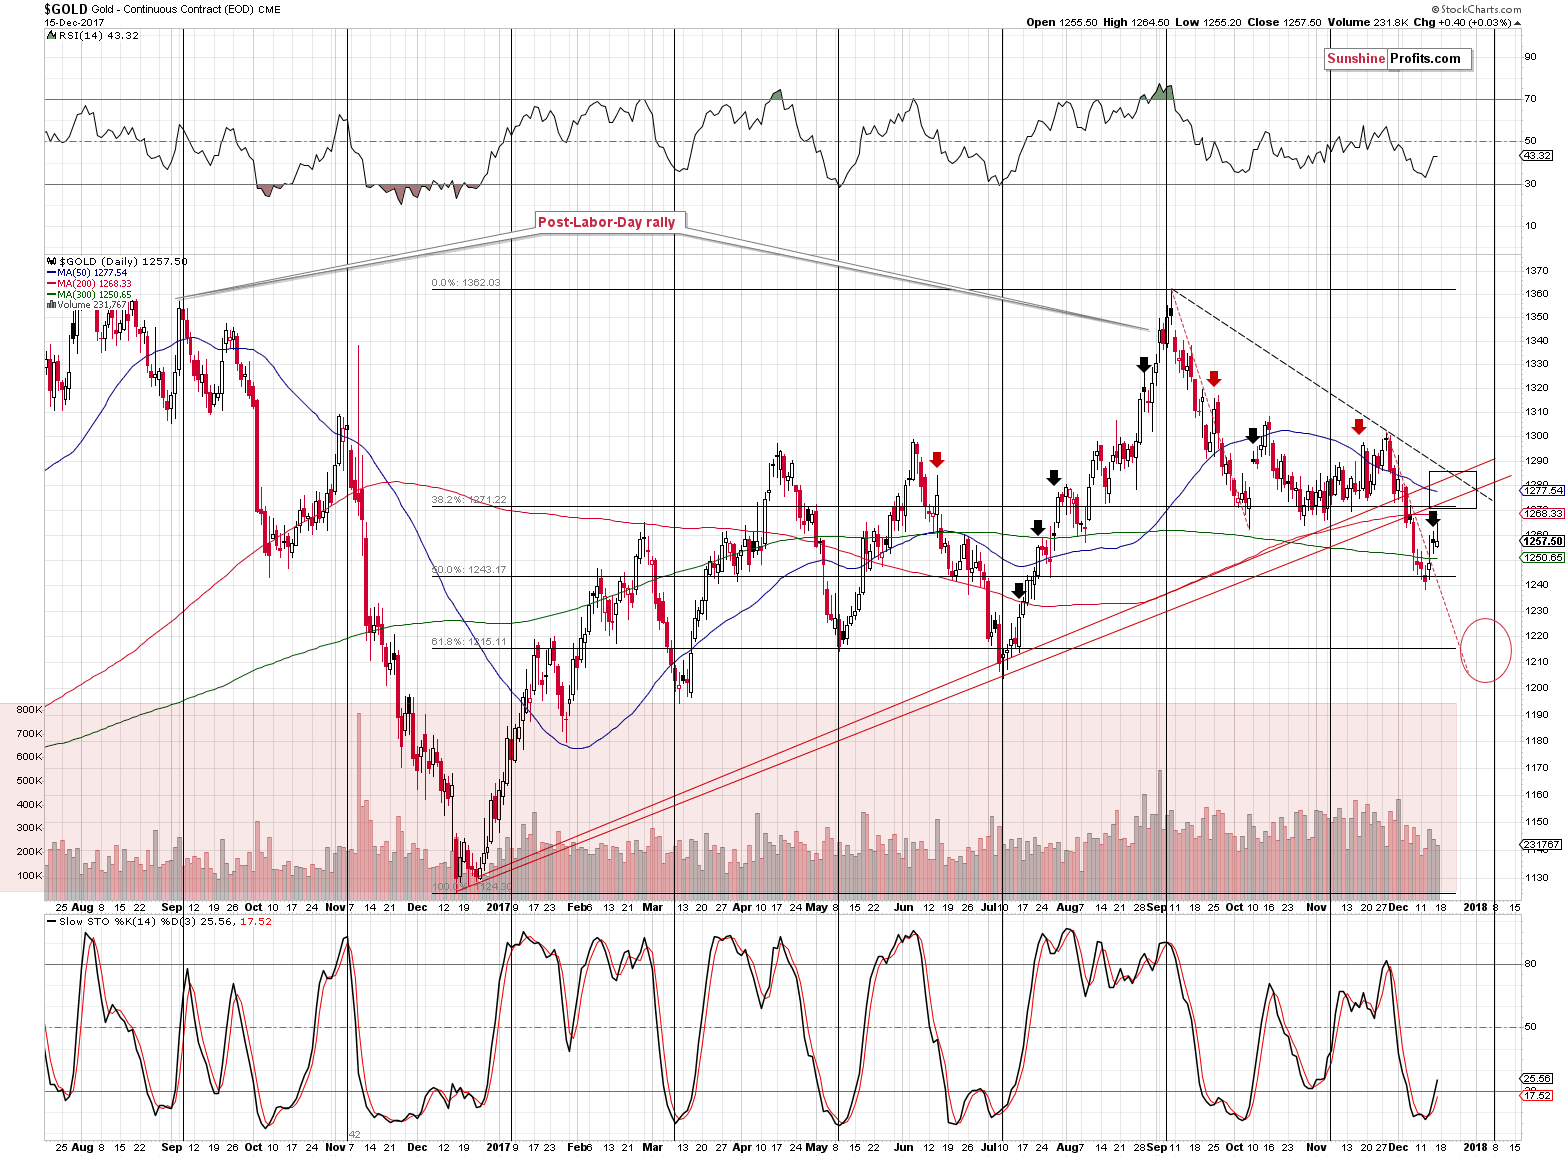
The reversal is a fact, but it is also a fact that the shooting star candlestick should be confirmed by huge volume. Instead of huge volume, we saw rather average and declining daily volume levels. Consequently, the bearish implications of the candlestick pattern don’t seem to really apply.
We explained the importance of confirmations in the November 21 Alert, but – in light of the above - it seems that quoting it might help. Back then we described it with regard to a breakout in silver and its subsequent invalidation, but the explanation regarding volume applies also to reversals.
As we’ve often emphasized, invalidations of breakouts are effective immediately and are quite strong signals that the move in the other direction is about to follow.
If you’ve been wondering why this is the case, here’s an explanation. If the market moves over a given resistance then this move could be accidental or it could be a true show of strength. What we want to see is signs that would confirm that there has been a “battle” for a given breakout and that the bulls have won this battle. A fierce battle means that a lot of capital was used and we would see high volume levels as a confirmation (that’s why a huge volume reading can confirm a breakout or breakdown on its own). But, what if the market was somehow forced to move higher (for instance gold could rally given a big plunge in the USD as the latter would make it cheaper in terms of other currencies and if the demand didn’t change overall, lower prices would attract more buyers), but it really doesn’t want to rally? That’s why we use the 3-day confirmation rule. If the move was artificial in some way, the market participants are likely to push the price in the original direction. Naturally, if the markets that usually confirm each other’s moves all break out or break down at the same time it further increases the odds that the move is true.
However, in the case of invalidations things are different. Invalidations are not just breakouts / breakdowns in the opposite direction. The preceding action is important. Before a breakout/breakdown, the investors and traders know that it would take an effort and a “battle” for the market to move above/below a certain level – the market is therefore before the “battle”. In case of the invalidation, the market is already after (!) the “battle” where the “bullets have already been shot” (trades have been made and capital has been used) and the invalidation shows that the supposedly winning side wasn’t able to hold the new ground even though the price was already above/below the key price level. This immediately (!) means that the entire “battle” was not real or it wasn’t really won as if it were, the winning side would be able to hold its ground. So, any bullish implications that the breakout might have had are invalidated.
But why is this bearish on its own? Because it shows that even though the supposedly winning side had everything in their favor (the price moved above the certain level) it turned out to be weak and the capital that was used to push the market higher can’t be used push it up again as it’s already in the market.
What does it mean for the gold market in this case? That a reversal that was accompanied by average – and declining - volume shouldn’t be trusted.
But maybe it’s some kind of data error as Stockcharts’ daily candlesticks were recently incorrect?
This time it seems that conclusions can be made based on the above chart. The closing price and the intraday action is consistent with Kitco’s data.
Moreover, the analysis of the GLD ETF provides us with bullish, rather than bearish implications.
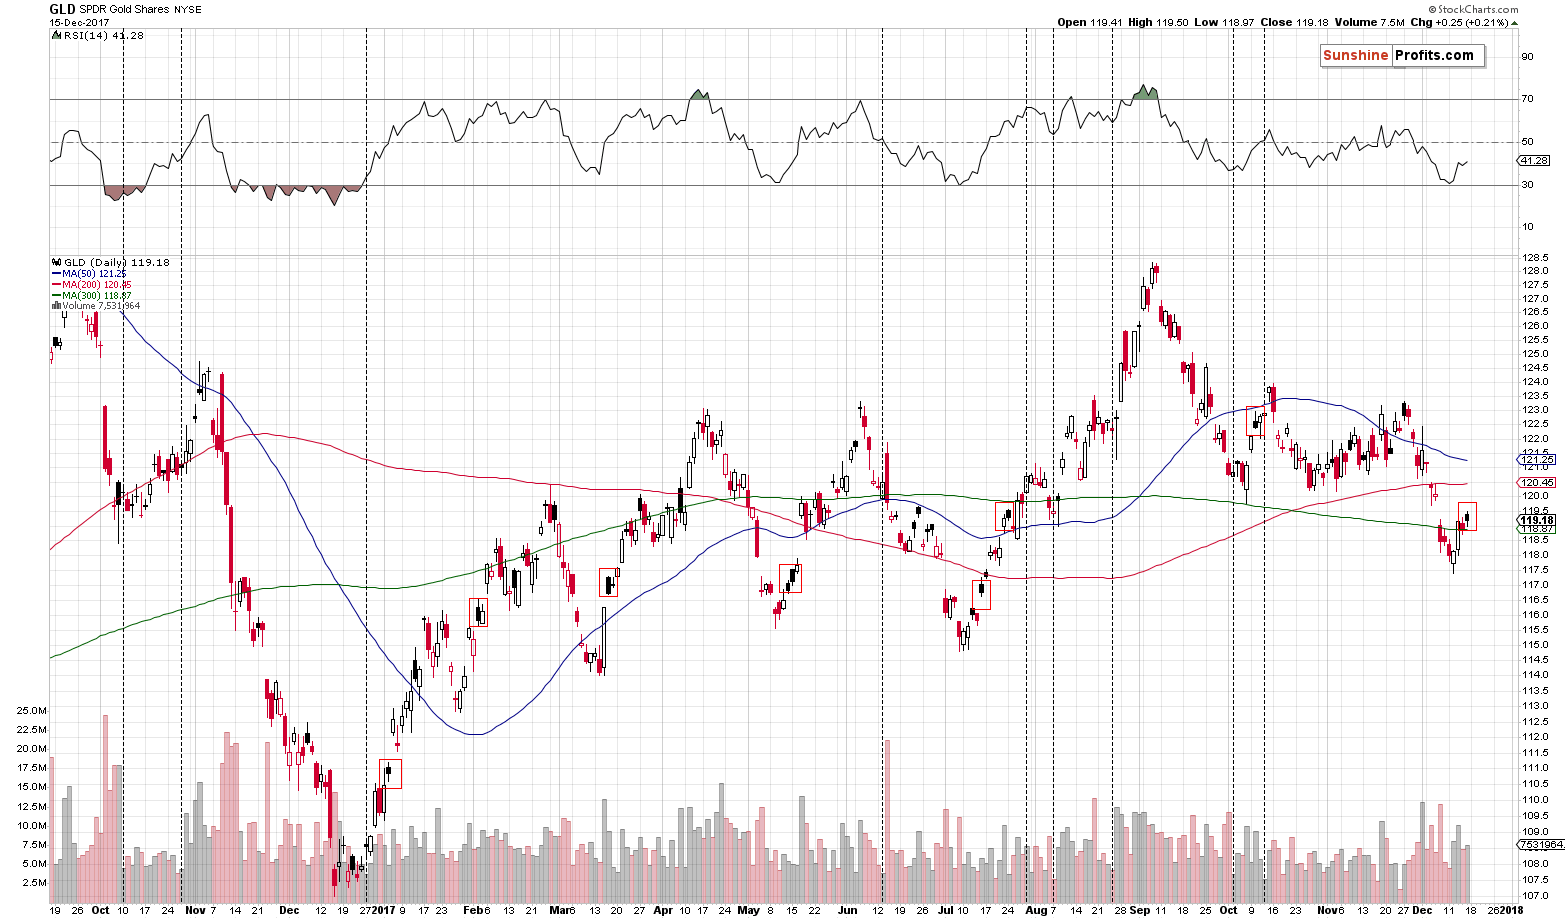
The above chart shows that the price action that we saw on Friday is very similar (red rectangles) to what we saw many times during the early stages of the previous upswings.
While we don’t expect the current rally to be as big as the preceding ones, the above analogy is enough to tell us that we shouldn’t worry about potential bearish implications of Friday’s reversal.
Moving back to the chart featuring gold futures, please note that the Stochastic indicator is not only after a classic buy signal, but also after a visible move back above the 20 level. In all similar cases that are visible on the above chart, similar action meant that the rally was not over yet.
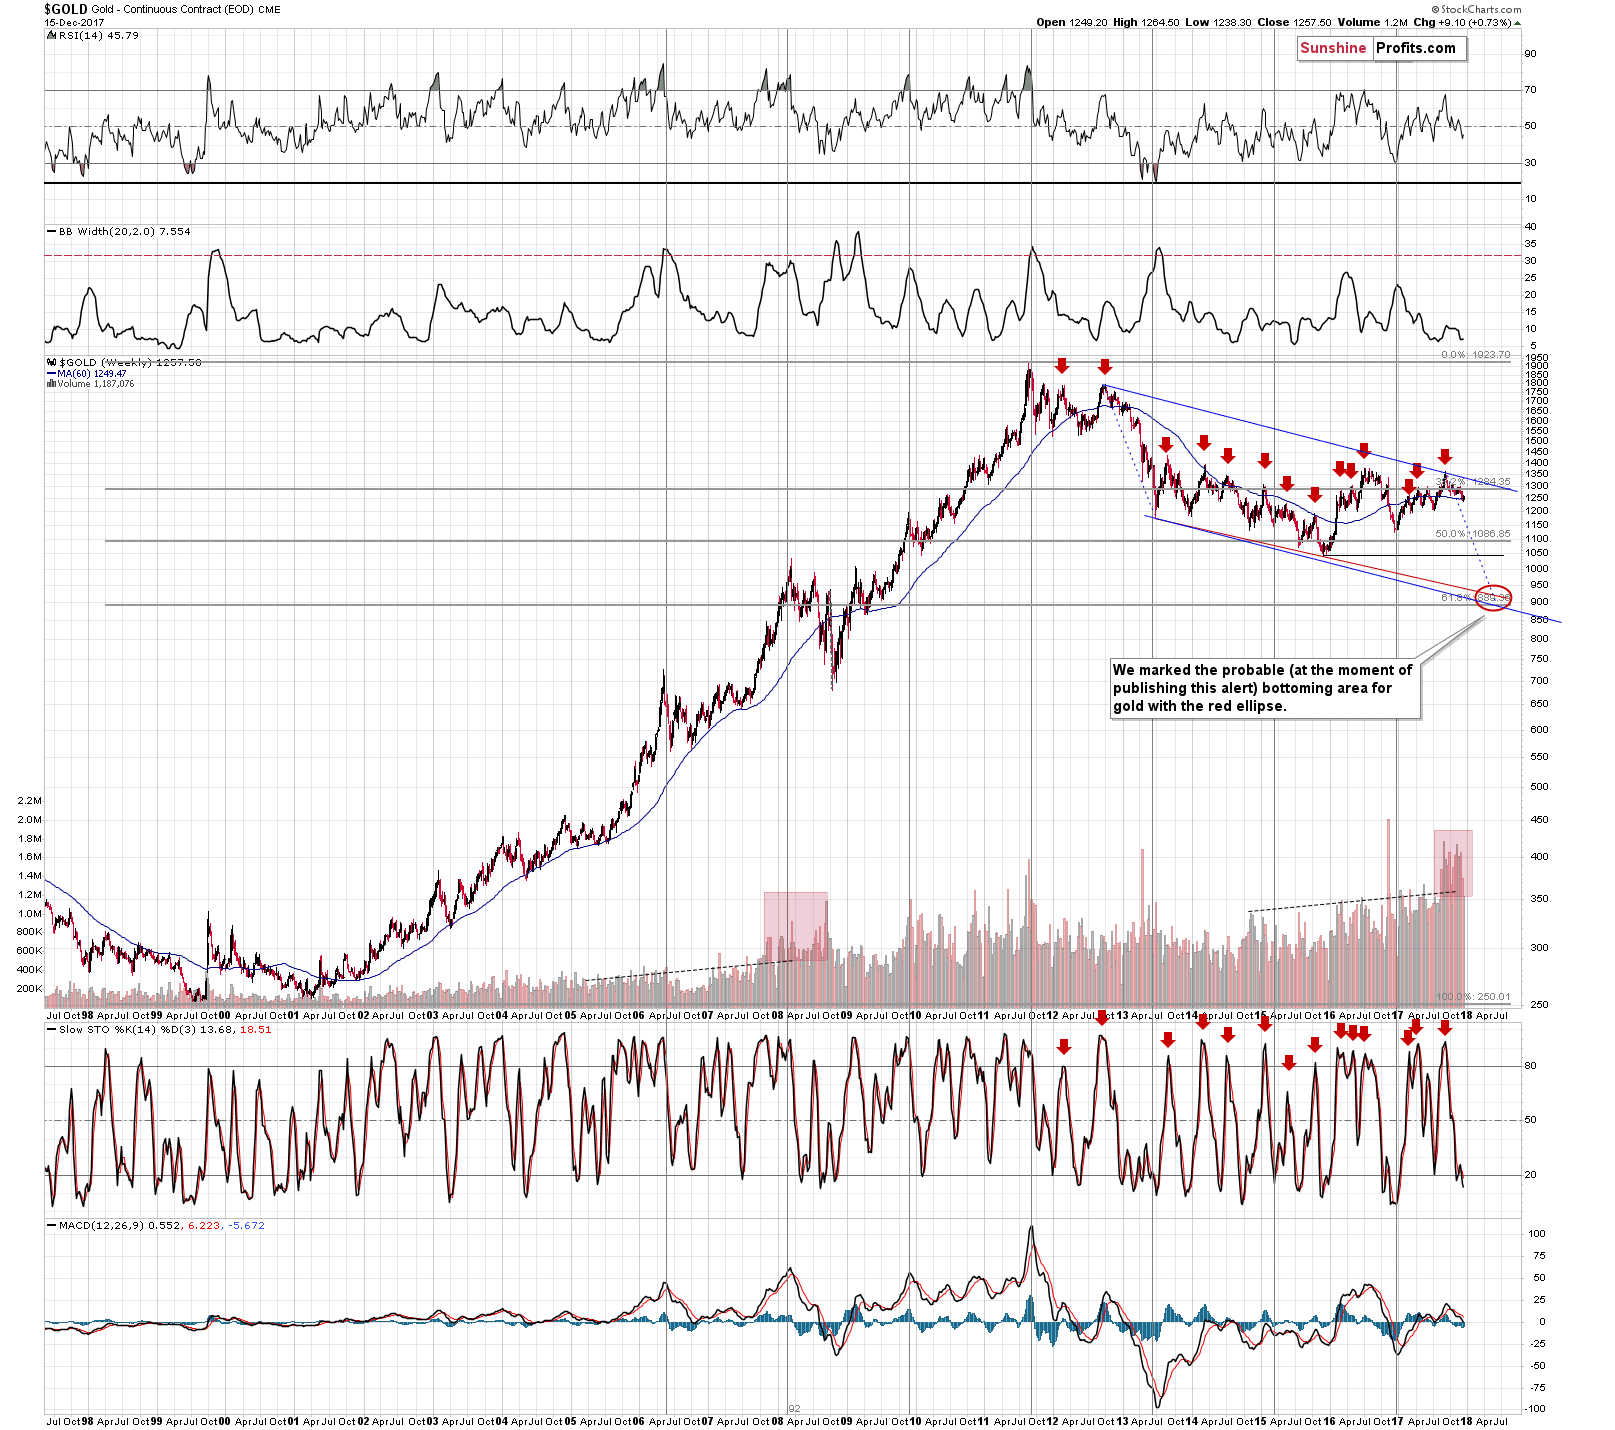
Still, let’s keep the big picture in mind. The rally that we are seeing right now is most likely just a short-term phenomenon, not a game-changer. The medium-term trend remains down and our previous comments on gold’s long-term chart remain up-to-date:
The thing that we would additionally like to point out on the above chart is that gold moved to (and closed the week below) the 60-week moving average. It had already moved close to this level in early October, but corrected shortly thereafter. Why do we mention this while discussing the long-term gold chart? Because on the above chart you can see something very similar in late 2012 and early 2013. Back then, gold’s final top was followed by a move to the 60-week MA, then we saw a correction, and then a move below the previous low and the 60-week MA. After that low we saw another corrective upswing that was a bit smaller than the previous one.
The implication here is that we could see even lower gold prices on a very short-term basis, then a correction that would not be very significant and then another big wave down. That’s in tune with what we’ve been expecting to see based on other factors, so the above simply serves as a confirmation.
In other words, a corrective upswing here is very much in tune with what took place about 5 years ago.
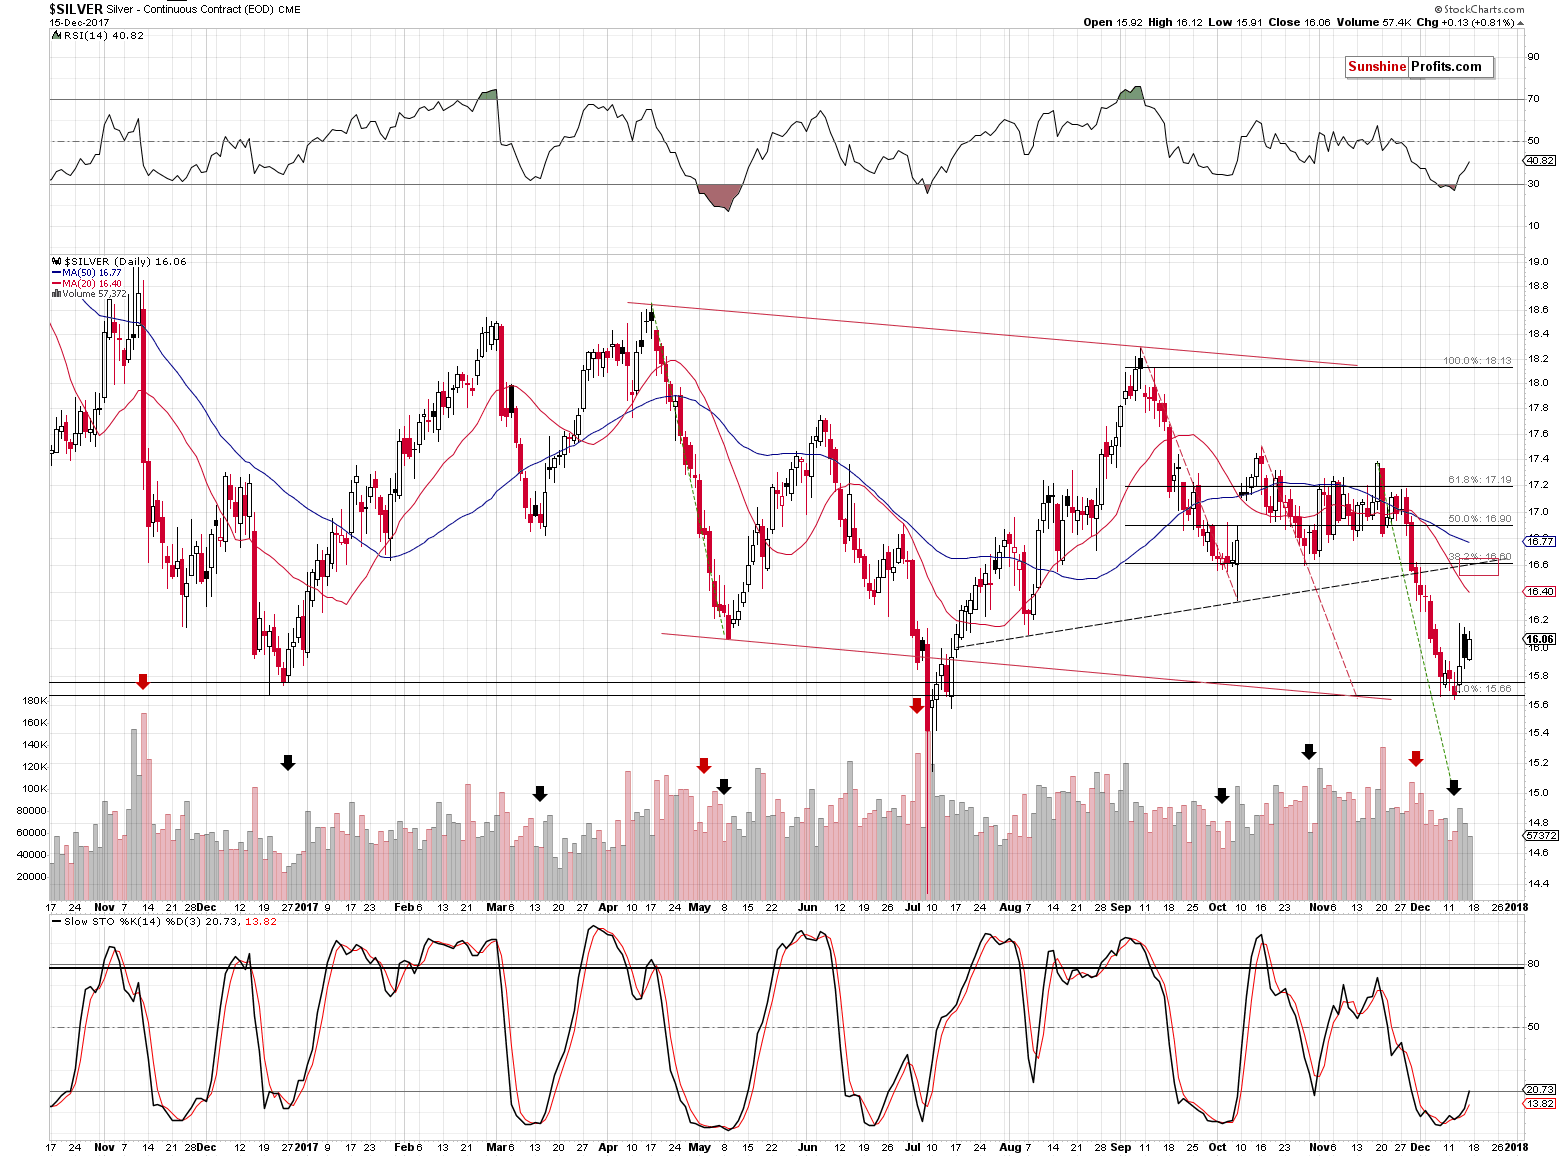
Silver is moving back and forth and this trading pattern is in tune with what happened in late 2016. After the bottom, silver moved higher initially and then corrected about half of the preceding rally before continuing to move higher. Back then, the Stochastic indicator was rather unaffected and the RSI indicator was very close to the 40 level. The same is the case today. Consequently, the follow-up action is likely to be analogous as well. Back then silver rallied, so the short-term implications are bullish.
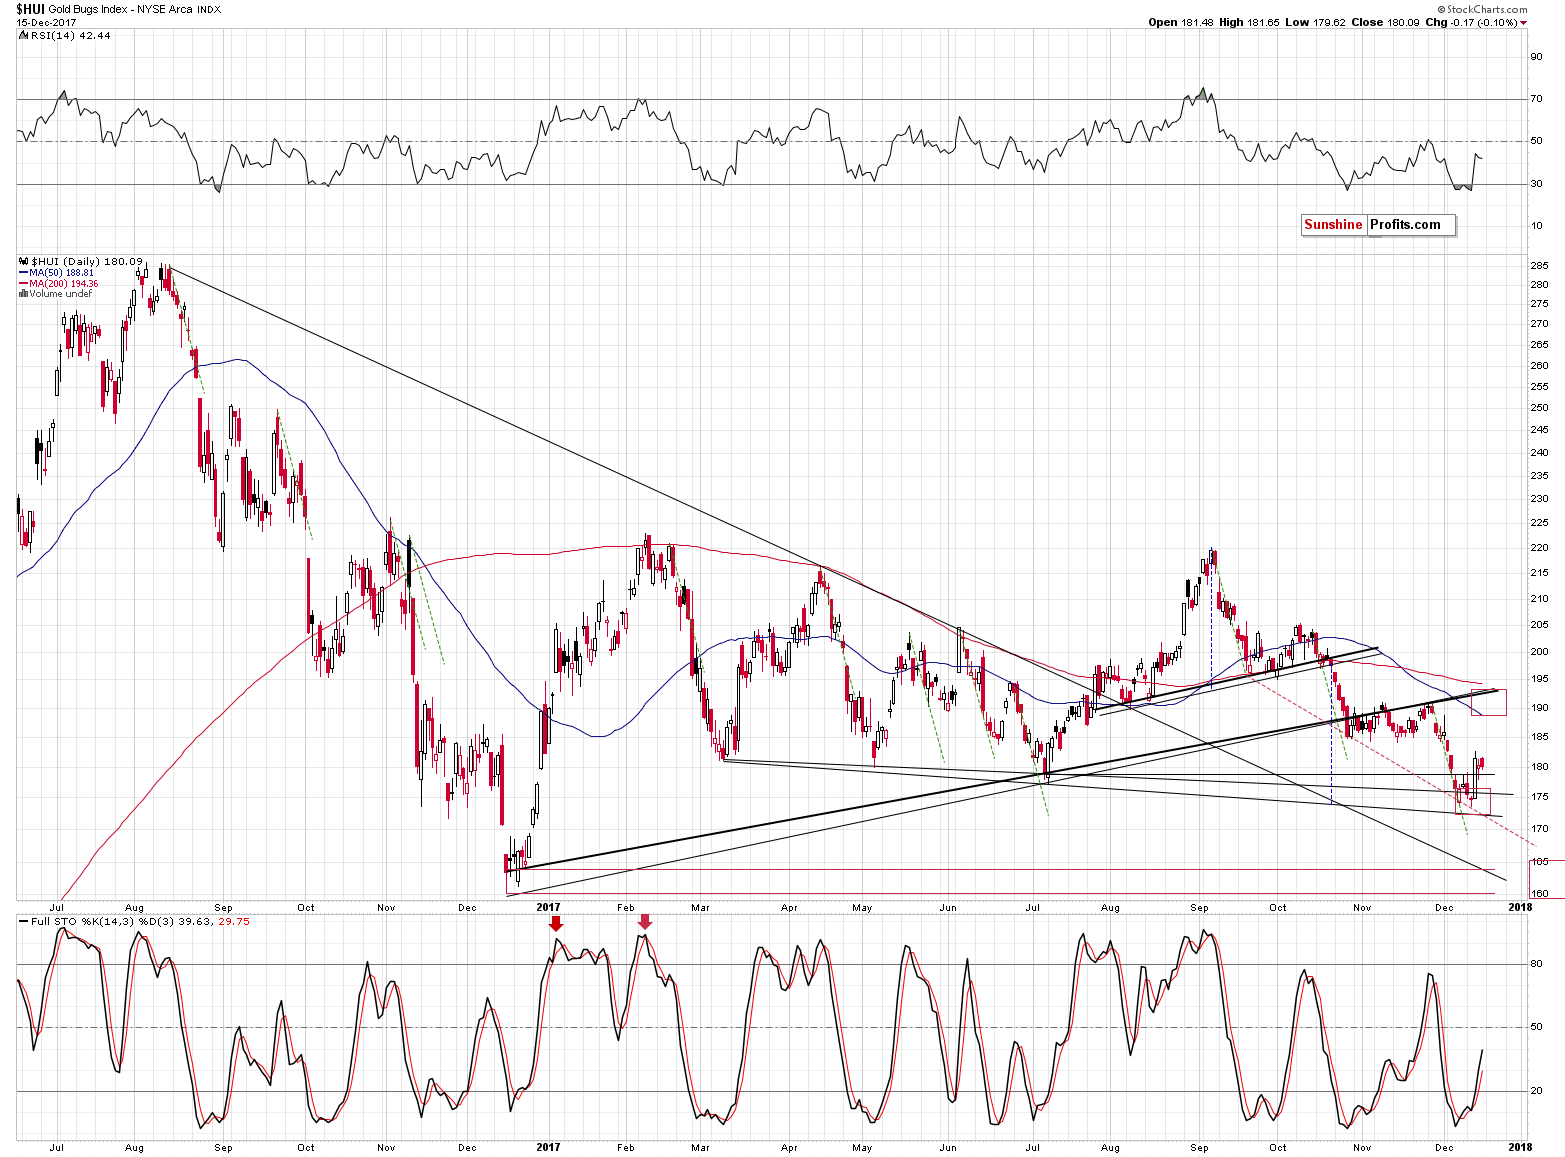
Gold stocks continue their pause, which is something natural after a sharp rally. The lack of big decline bodes well for the following days.
Just like is the case with gold, the likely short-term rally does not break the long-term bearish analogy (green dashed lines on the above chart). Small corrections are normal even in the case of the biggest of declines.
Friday’s action in the currency market also seems to support higher precious metals values in the short term. Let’s take a look at the USD Index and its proxy (UUP ETF) to be sure that they both provide the same signals.
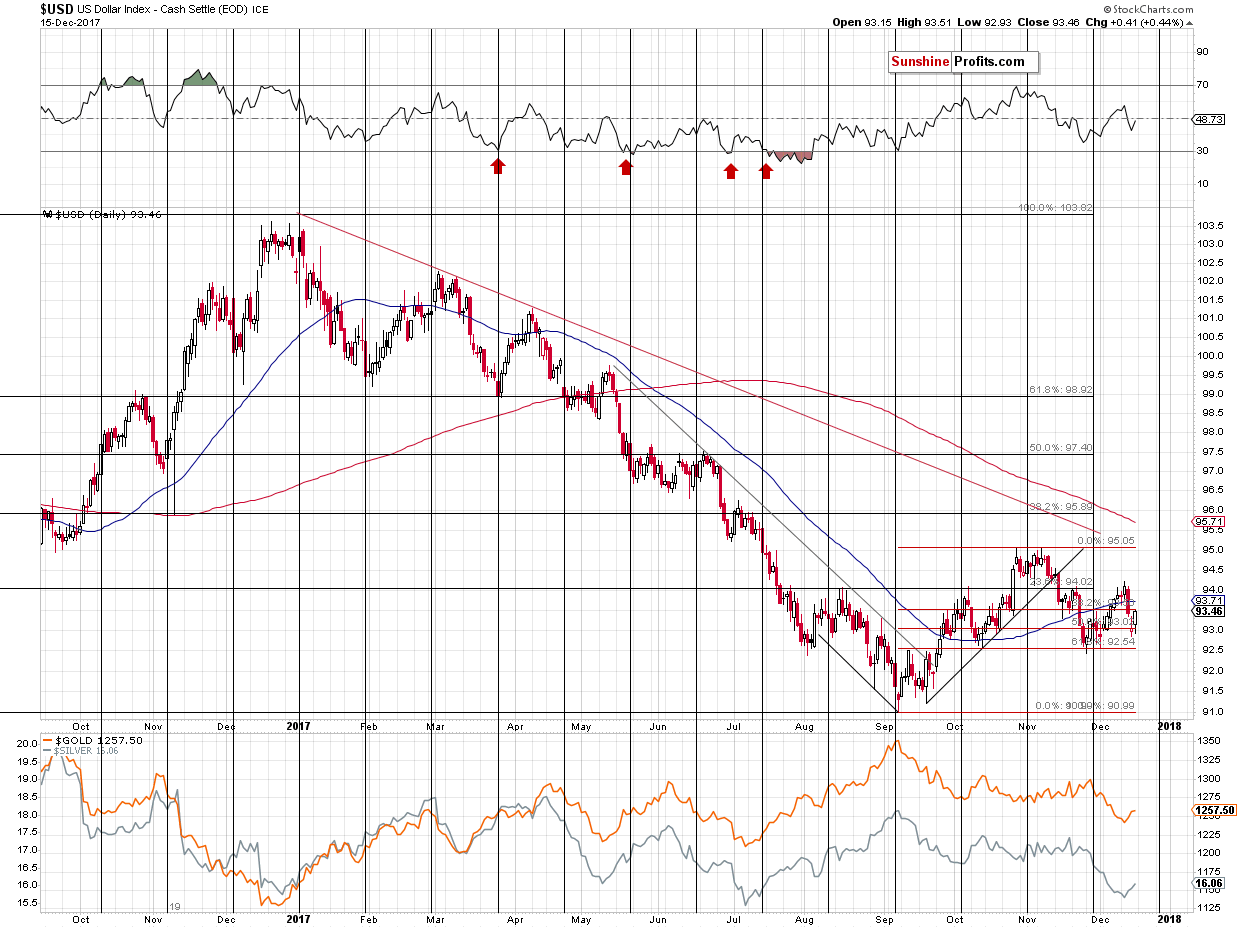
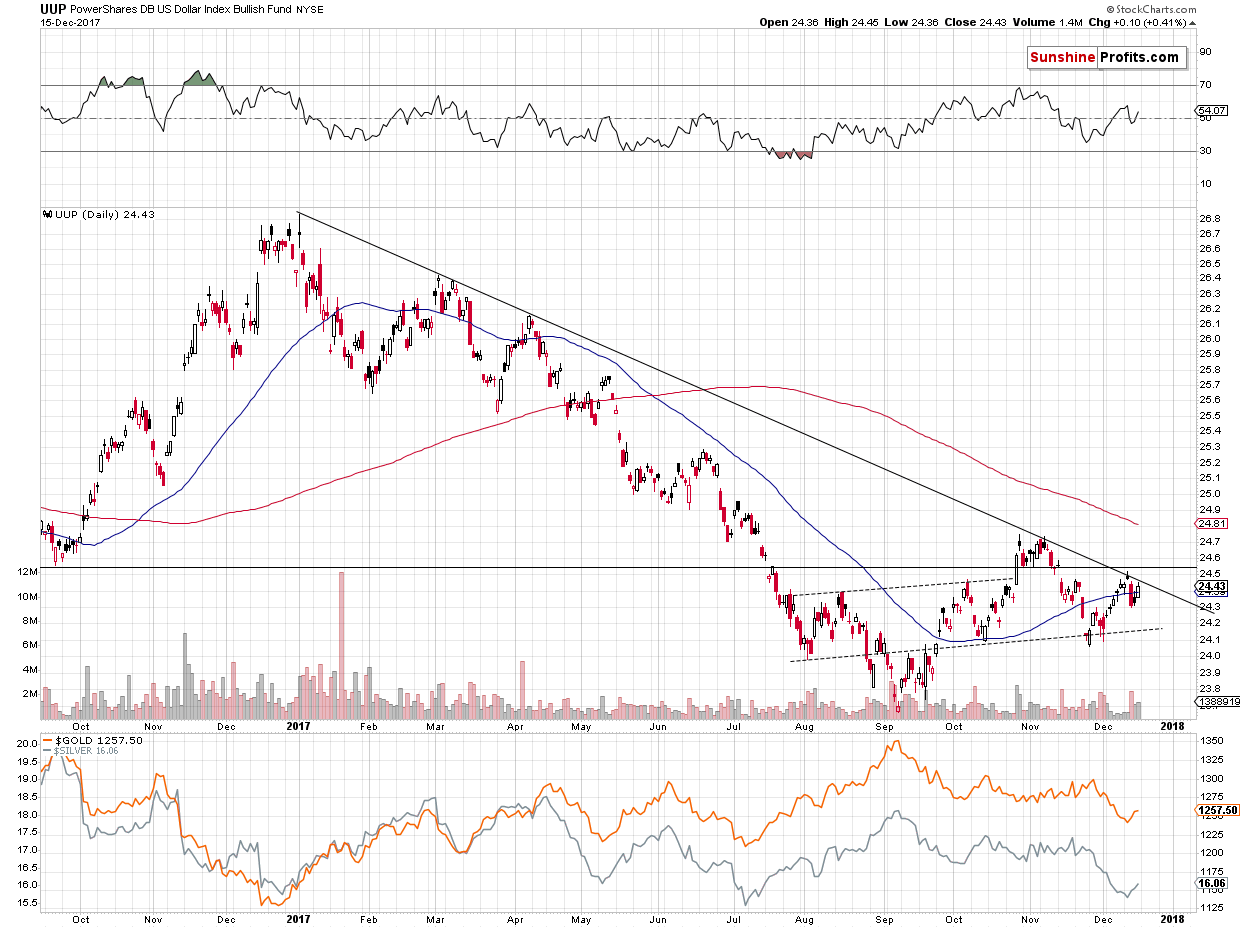
The key thing that’s visible on both above charts is the basic fact that the USD rallied on Friday. It may sound too simple to be relevant, but it really is. Gold reversed, but ended the session without declining. Since the USD moved higher, gold should have declined – but it didn’t, and thus showed strength.
While describing gold’s chart for today, we already discussed the importance of a proper confirmation. The action in the USD is the exact opposite of what a confirmation should look like.
Summing up, the medium-term outlook for the precious metals market didn’t change based on last week’s developments and it remains bearish, but the short-term outlook is bullish. Friday’s reversal in gold was not confirmed by increased volume, so the bearish implications that it should generate are rather insignificant. Conversely, since gold managed to close the session without declining given the USD’s upswing, this action serves as a bullish confirmation.
As always, we will keep you – our subscribers – informed.
To summarize:
Trading capital (supplementary part of the portfolio; our opinion): Long positions (100% of the full position) in gold, silver and mining stocks are justified from the risk/reward perspective with the following stop-loss orders and initial targets:
- Gold: initial target level: $1,279; stop-loss: $1,236; initial target level for the UGLD ETN: $10.58; stop-loss for the UGLD ETN $9.38
- Silver: initial target level: $16.48; stop-loss: $15.58; initial target level for the USLV ETN: $11.18; stop-loss for the USLV ETN $8.88
- Mining stocks (price levels for the GDX ETF): initial target level: $22.97; stop-loss: $21.08; initial target level for the NUGT ETF: $30.18; stop-loss for the NUGT ETF $23.78
In case one wants to bet on junior mining stocks' prices (we do not suggest doing so – we think senior mining stocks are more predictable in the case of short-term trades – if one wants to do it anyway, we provide the details), here are the stop-loss details and exit prices:
- GDXJ ETF: initial target level: $33.48; stop-loss: $29.78
- JNUG ETF: initial target level: $17.38; stop-loss: $11.78
Long-term capital (core part of the portfolio; our opinion): No positions (in other words: cash)
Insurance capital (core part of the portfolio; our opinion): Full position
Important Details for New Subscribers
Whether you already subscribed or not, we encourage you to find out how to make the most of our alerts and read our replies to the most common alert-and-gold-trading-related-questions.
Please note that the in the trading section we describe the situation for the day that the alert is posted. In other words, it we are writing about a speculative position, it means that it is up-to-date on the day it was posted. We are also featuring the initial target prices, so that you can decide whether keeping a position on a given day is something that is in tune with your approach (some moves are too small for medium-term traders and some might appear too big for day-traders).
Plus, you might want to read why our stop-loss orders are usually relatively far from the current price.
Please note that a full position doesn’t mean using all of the capital for a given trade. You will find details on our thoughts on gold portfolio structuring in the Key Insights section on our website.
As a reminder – “initial target price” means exactly that – an “initial” one, it’s not a price level at which we suggest closing positions. If this becomes the case (like it did in the previous trade) we will refer to these levels as levels of exit orders (exactly as we’ve done previously). Stop-loss levels, however, are naturally not “initial”, but something that, in our opinion, might be entered as an order.
Since it is impossible to synchronize target prices and stop-loss levels for all the ETFs and ETNs with the main markets that we provide these levels for (gold, silver and mining stocks – the GDX ETF), the stop-loss levels and target prices for other ETNs and ETF (among other: UGLD, DGLD, USLV, DSLV, NUGT, DUST, JNUG, JDST) are provided as supplementary, and not as “final”. This means that if a stop-loss or a target level is reached for any of the “additional instruments” (DGLD for instance), but not for the “main instrument” (gold in this case), we will view positions in both gold and DGLD as still open and the stop-loss for DGLD would have to be moved lower. On the other hand, if gold moves to a stop-loss level but DGLD doesn’t, then we will view both positions (in gold and DGLD) as closed. In other words, since it’s not possible to be 100% certain that each related instrument moves to a given level when the underlying instrument does, we can’t provide levels that would be binding. The levels that we do provide are our best estimate of the levels that will correspond to the levels in the underlying assets, but it will be the underlying assets that one will need to focus on regarding the signs pointing to closing a given position or keeping it open. We might adjust the levels in the “additional instruments” without adjusting the levels in the “main instruments”, which will simply mean that we have improved our estimation of these levels, not that we changed our outlook on the markets. We are already working on a tool that would update these levels on a daily basis for the most popular ETFs, ETNs and individual mining stocks.
Our preferred ways to invest in and to trade gold along with the reasoning can be found in the how to buy gold section. Additionally, our preferred ETFs and ETNs can be found in our Gold & Silver ETF Ranking.
As a reminder, Gold & Silver Trading Alerts are posted before or on each trading day (we usually post them before the opening bell, but we don't promise doing that each day). If there's anything urgent, we will send you an additional small alert before posting the main one.
=====
Latest Free Trading Alerts:
Last week, the reports on U.S. consumer inflation and retail sales were released. What do they imply for the gold market?
CPI and Retail Sales in November 2017 and Gold
=====
Hand-picked precious-metals-related links:
Hedge Funds Are Pulling Out of Gold and Seeking Thrills Elsewhere
Gold Speculators Drop Their Bullish Bets To Lowest In About 5 Months
=====
In other news:
Dollar dips on U.S. tax reform caution
Bond yields are an even bigger market risk than bitcoin, according to a Wall Street strategist
One large euro zone bank is short of capital: ECB
Bitcoin hits bigger stage as exchange giant CME launches futures
Oil prices rise on ongoing North Sea outage, Nigeria strike
Heretics welcome! Economics needs a new Reformation
=====
Thank you.
Sincerely,
Przemyslaw Radomski, CFA
Founder, Editor-in-chief, Gold & Silver Fund Manager
Gold & Silver Trading Alerts
Forex Trading Alerts
Oil Investment Updates
Oil Trading Alerts

