

Briefly: in our opinion, a full (300% of the regular position size) speculative short position in silver is justified from the risk/reward point of view at the moment of publishing this Alert.
If there was a good way to describe the last several days on the precious metals market (and related markets), it would be “a whole lot of nothing”.
Let’s start with the nothing that happened in the USD Index.
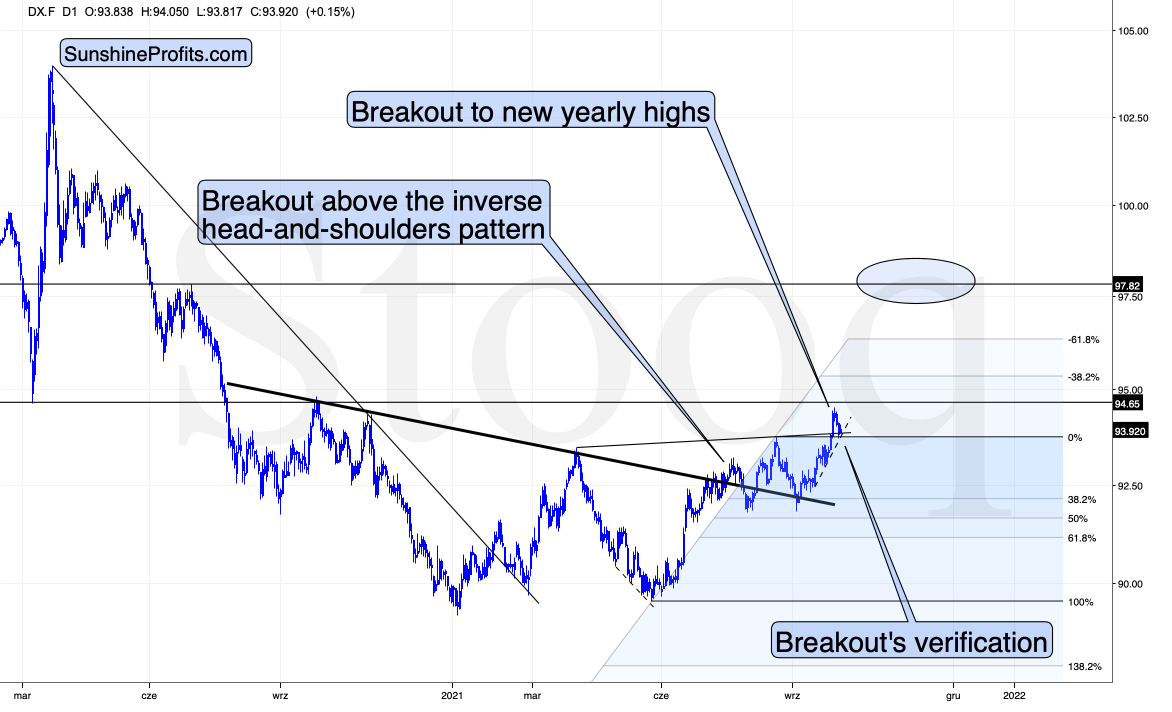
The USDX moved lower very recently, but it changed absolutely nothing. The USD Index moved back to:
- Its previous highs
- Its previous rising resistance line based on the previous highs, which it has verified as support
- The rising dashed support line based on the recent lows.
Moving to a rising support line and verifying a previous breakdown is not a bearish development. Conversely, it’s something quite common during an uptrend.
I previously mentioned that the USD Index is likely to consolidate either below or above its horizontal resistance at about 94.5, and what we’re seeing right now is a consolidation below this level. Once this level is taken out, the USDX could actually rally further without a bigger post-breakout consolidation. Consequently, I’m removing the short-term target area around this level as it no longer seems likely that the USDX will form a meaningful top there.
The next “nothing” comes from the gold market.
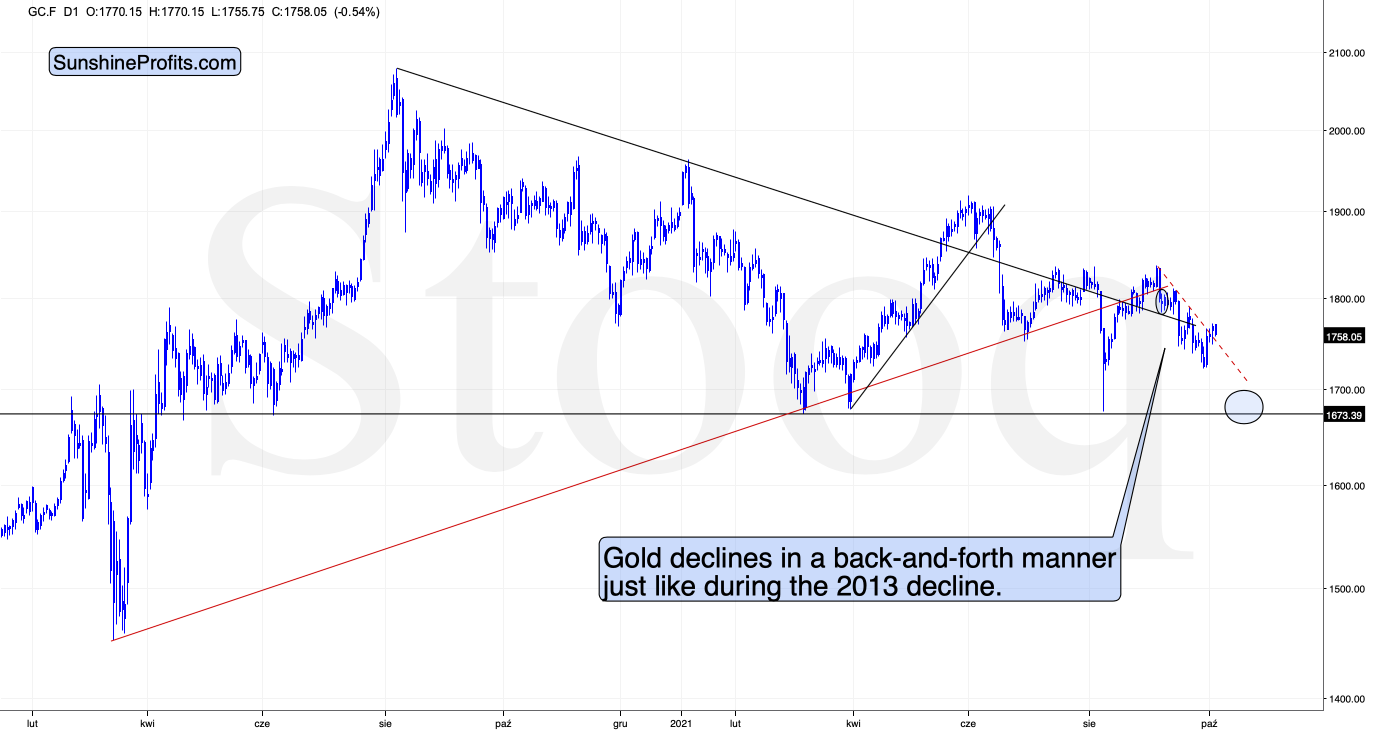
There’s a local breakout above the dashed resistance line, but it’s so much in tune with what happened in 2013 that it’s difficult to view it as bullish.
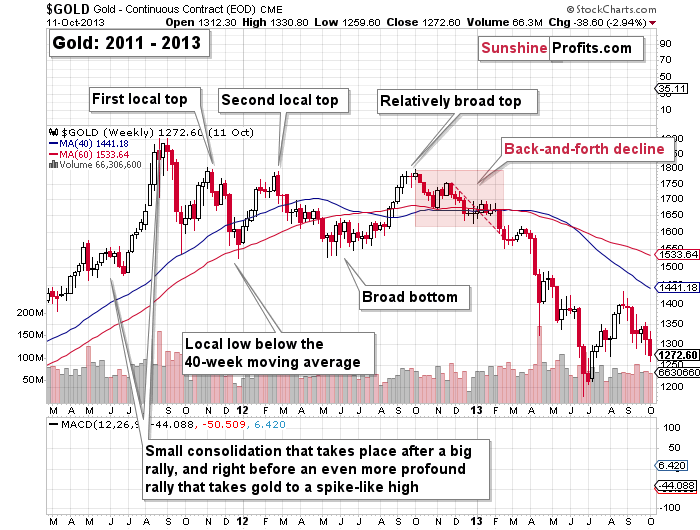
Likewise, the very short-term breakout that we just saw is similar to what we saw in… early 2013. Remember the similarity to early 2013 that I described on multiple markets? It’s not just gold, it’s the HUI Index, the HUI to gold ratio, and even the 10-year yield.
The small breakout above the red dashed line in early 2013 didn’t take the yellow metal much higher. Gold only finished moving back and forth before sliding to previous important lows, and that was just the beginning of a much bigger move lower.
The very bearish analogy remains intact, so what changed? Nothing.
Silver’s “Nothing”
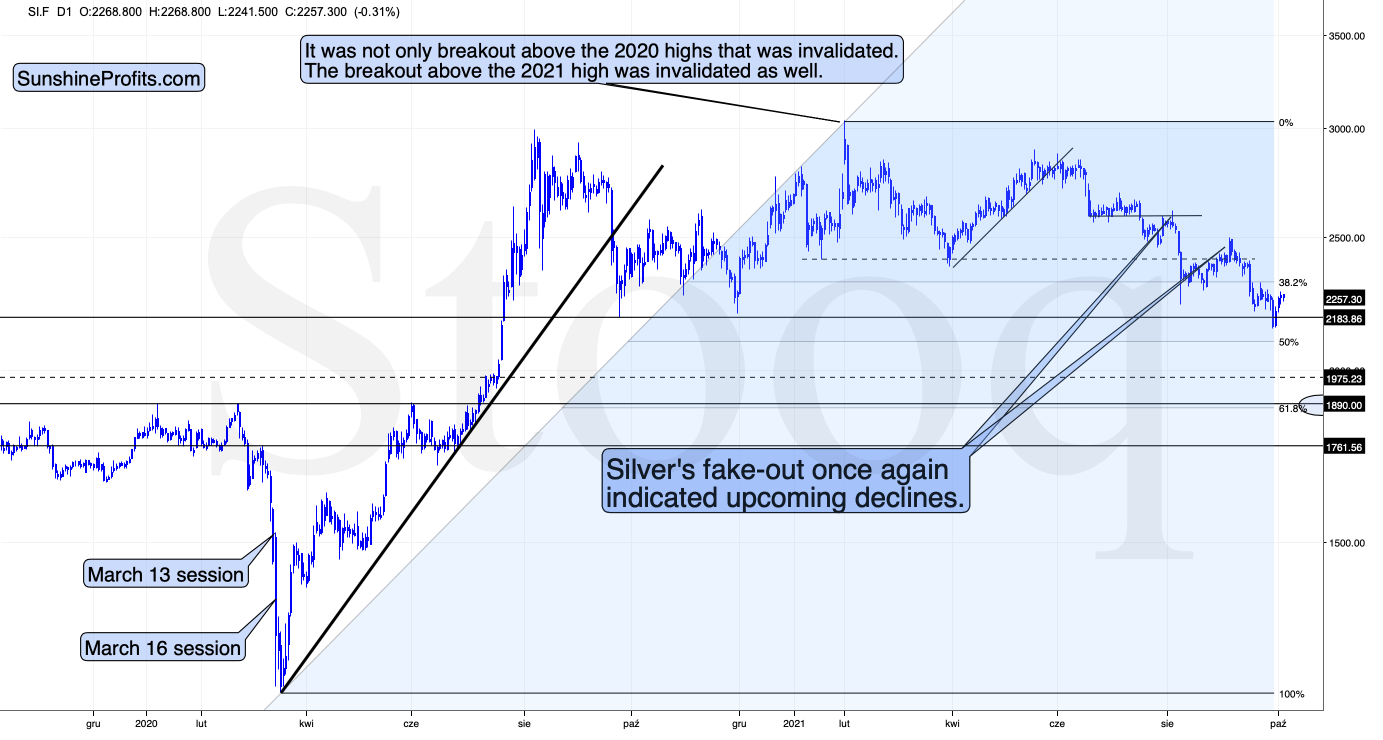
Remember the late-July comeback in silver? The white metal showed significant “strength” at that time. Too bad it didn’t last — the gains that we saw then preceded one of the sharpest slides of this year.
The thing that preceded this “strength” in July was a sizable, steady decline that ended with two bottoms, where the second bottom formed lower than the first one.
We saw something similar recently. Should this rally be trusted? No, it shouldn’t. In fact, I wouldn’t even call it a rally, it’s just a rebound within a downtrend.
Of course, having skin in the game – a short position in silver – makes one want silver to slide immediately, but successful trading requires patience and staying in the position that’s likely to bring profits (as long as that really remains likely) even if the market takes its time before moving. That’s the situation we’re in right now.
The downside target is just as likely to be reached as it was when silver was trading lower a few days ago, and it’s further from the current price than the targets for mining stocks are from their respective prices. Consequently, it remains justified from the risk to reward point of view to keep the short position in silver intact.
And speaking of mining stocks, please have a look at how weak their reaction to gold’s rally was.
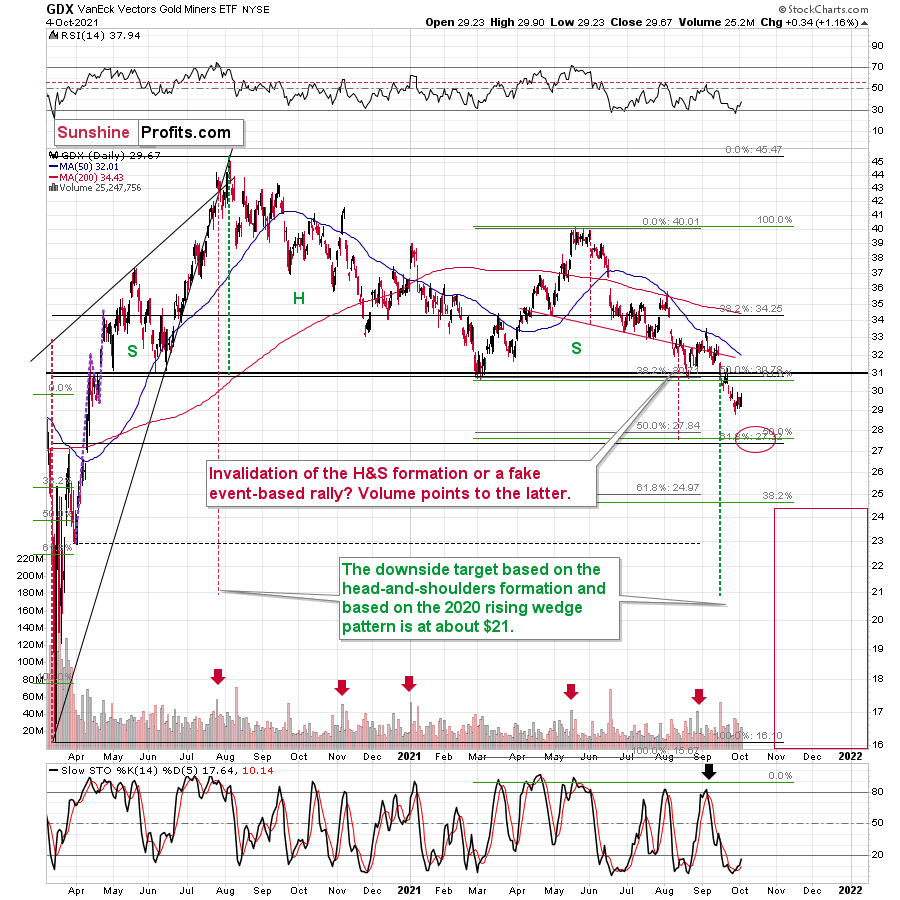
Even without looking at exact percentage gains, it’s clear that the GDX has barely moved back up. It didn’t even manage to move back above $30 in yesterday’s intraday trading.
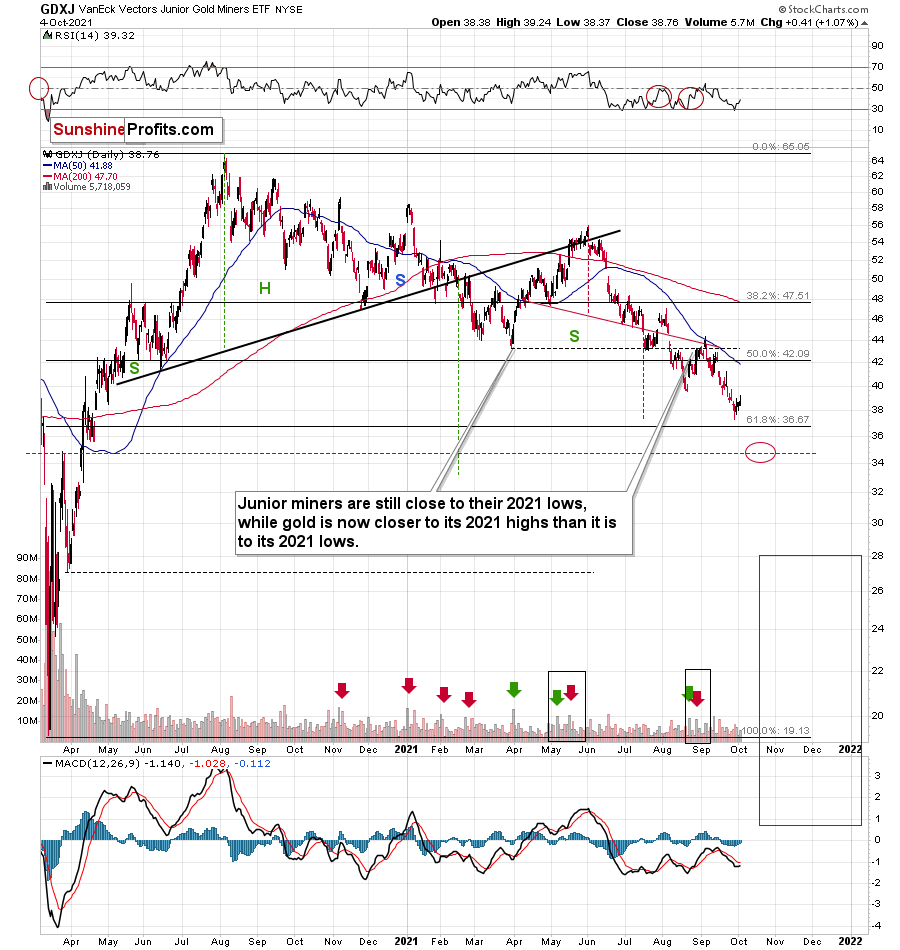
Juniors (GDXJ) confirm seniors’ (GDX) relative weakness, and they both suggest that the precious metals sector is likely to move lower in the following weeks.
Having said that, let’s take a look at the details from a more fundamental point of view.
Dollars and Sense
While the USD Index retreated on Oct. 4 and dipped below 94, the greenback still has the wind at its back. For one, investors’ short-term profit-taking is quite normal, and it shouldn’t impact the USD Index’s medium-term uptrend. Second, a solid U.S. nonfarm payrolls print on Oct. 8 could solidify the Fed’s taper timeline and underwrite the USD Index’s next leg higher.
For context, with inflation surging and “substantial further progress” already met, Fed Chairman Jerome Powell was asked about the labor market’s impact on his taper timeline. He said on Sep. 22:
“For me it wouldn’t take a knockout, great, super-strong employment report. It would take a reasonably good employment report for me to feel like that test is met. Others on the committee, many on the committee, feel the test is already met. Others want to see more progress.”
More importantly, though, he added:
“Many on the committee feel that substantial further progress test for employment has been met... I guess my own view is the test for substantial further progress on employment is all but met.”
Thus, if a “reasonably good employment report” hits the wire on Oct. 8, the USD Index should be a major beneficiary.
Please see below:
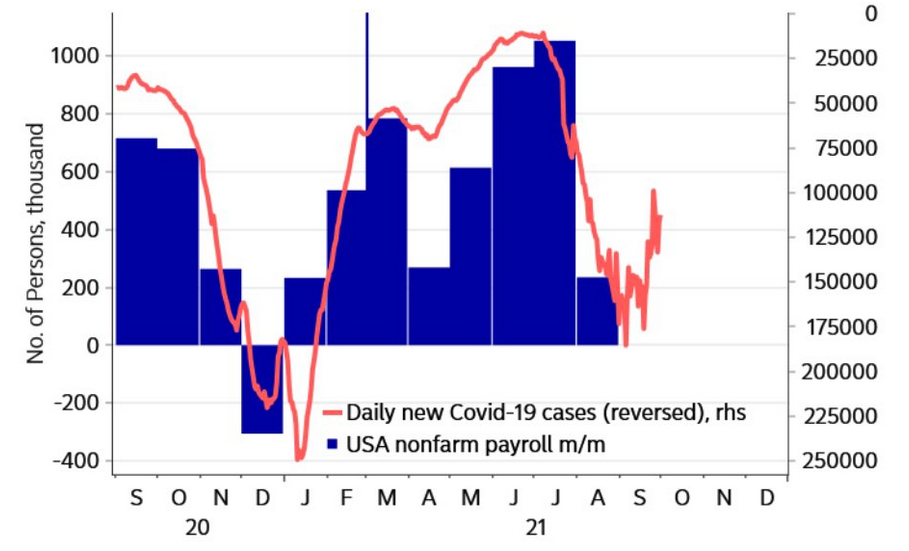 Source: Nordea
To explain, the blue bars above track U.S. nonfarm payrolls, while the red line above tracks the inverted count of U.S. daily new coronavirus cases. For context, inverted means that when the red line is rising, U.S. daily new coronavirus cases are falling, and when the red line is falling, U.S. daily new coronavirus cases are rising. If you analyze the relationship, you can see that progress on the health front is often bullish for U.S. nonfarm payrolls. Moreover, with a decelerating Delta variant also coinciding with the end of enhanced unemployment benefits, a decent payrolls print on Oct. 8 could elicit a formal taper announcement from the Fed in November. And with investors known to front-run the action, the USD Index should benefit from the prospective liquidity drain.
In addition, commercial futures traders’ positioning also signals a stronger U.S. dollar. For context, commercial futures traders often act on behalf of institutions that use the U.S. dollar in their day-to-day operations. As a result, commercial futures traders are primarily hedgers and the CFTC classifies them as “engaged in business activities hedged by the use of the futures or option markets.”
Please see below:
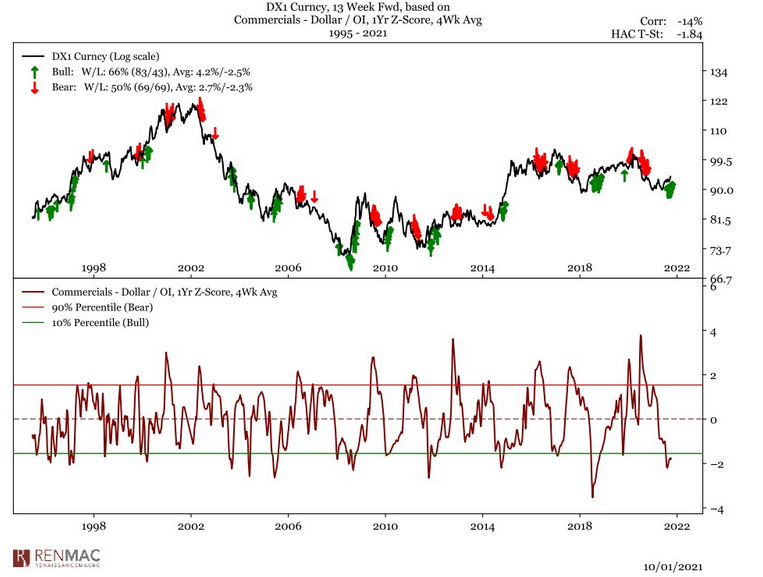
To explain, the black line at the top half of the chart above tracks the USD Index (log scale), while the red line at the bottom half of the chart above tracks the four-week average z-score of commercial futures traders’ net positions. If you analyze the right side of the chart, you can see that commercial futures traders’ net-short positions have sunk below the 10th percentile (meaning that they are overwhelmingly short the U.S. dollar).
However, if you analyze the statistics at the top left corner of the chart, you can see that 66% of the time when commercial futures traders’ net-short positions breach the 10th percentile, the USD Index rallies (marked by the green arrows throughout the black line) and the average gain is 4.2%. Conversely, 34% of the time when the USD Index has declined, the drawdown has averaged 2.5%. Thus, not only does the simple risk-reward favor a stronger greenback at nearly 2-1, but the asymmetric payoff is also 1.68-1. As a result, history implies that the USD Index’s weakness should be short-lived.
Expanding on intuitional positioning, while the USD Index was quite popular in September, the dollar basket likely has plenty of room to run.
Please see below:
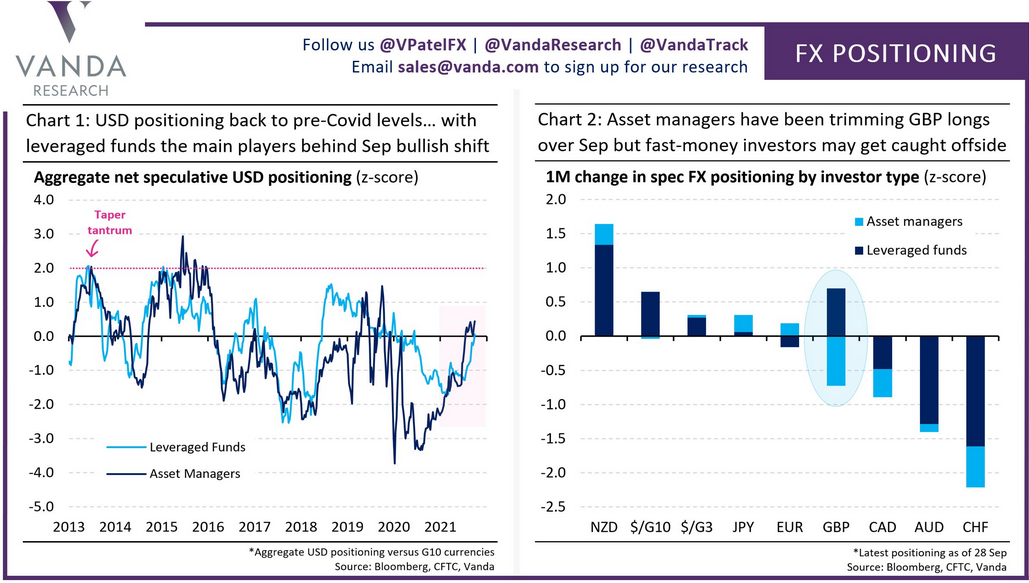
To explain, if you focus your attention on the chart on the left, you can see that asset managers and leveraged funds are back to their pre-COVID positionings. However, if you analyze the section labeled “Taper Tantrum,” you can see that the pairs’ allocations are nowhere near the highs set during prior historical upswings.
Similarly, if you turn to the chart on the right, you can see that the one-month change in positioning still supports a stronger U.S. dollar. For example, if you analyze the column labeled “$/G3,” you can see that both asset managers and leveraged funds have increased their USD net positions relative to the euro (nearly 58% of the USD Index’s movement) and the Japanese yen (13.6% of the USD Index’s movement). Furthermore, the “GBP” and the “EUR” on their own are roughly flat (longs and shorts offset), while both asset managers and leveraged funds dumped the CAD (9.1% of the USD Index’s movement). As a result, U.S. dollar sentiment remains quite strong.
The Euro Has More Room To Fall
On top of that, with the EUR/USD a major beneficiary of the ‘reflation’ narrative – due to the region’s concentration in financials, autos, industrials, energy, etc. – the perception of strong global growth supports the euro. However, with stagflation grabbing the baton in recent weeks, central banks’ worst nightmare has the opposite effect on the EUR/USD.
Please see below:
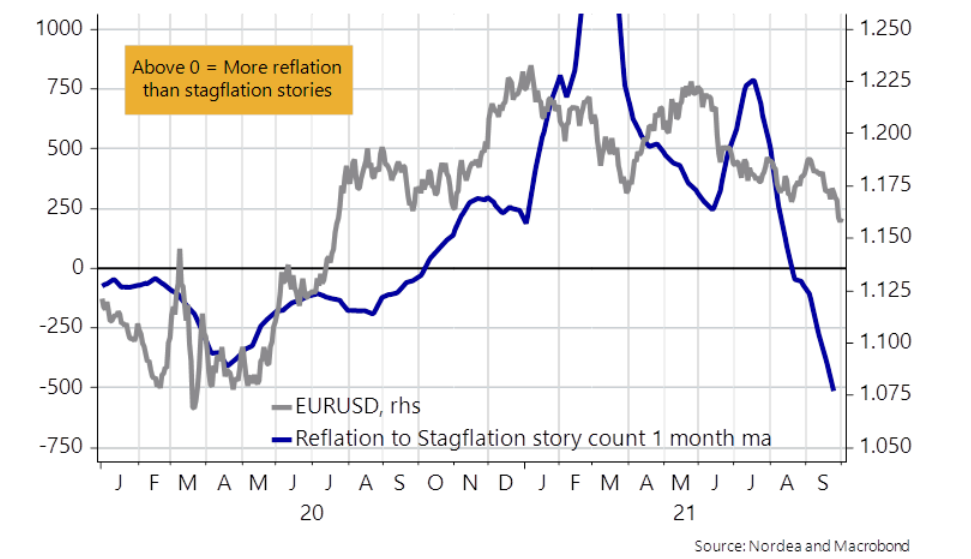
To explain, the media plays an important role in fueling a narrative’s flame. And when stories of reflation dominated the headlines in mid-2020 (the blue line above), the EUR/USD followed right along (the gray line above). However, if you analyze the right side of the chart, you can see that stagflation stories have taken center stage and the blue line has made a new low. Moreover, the last time we witnessed a reading of this magnitude, the EUR/USD was trading below 1.100. As a result, with supply chains still disrupted and the colder months less favorable to GDP growth, the EUR/USD’s downtrend likely has more room to run.
Finally, Sebastian Raedler, Head of European Equity Strategy at Bank of America, expects the Stoxx Europe 600 Index to decline by 10% before the end of the year. He told clients that “the macro backdrop for equities [is] shifting from goldilocks (i.e., accelerating growth and a falling discount rate) to anti-goldilocks (slowing growth and a rising discount rate).” Furthermore, with European PMIs “now dropping sharply as a reopening boost fades,” he wrote that “further downside [is] likely as growth normalizes over the coming months.”
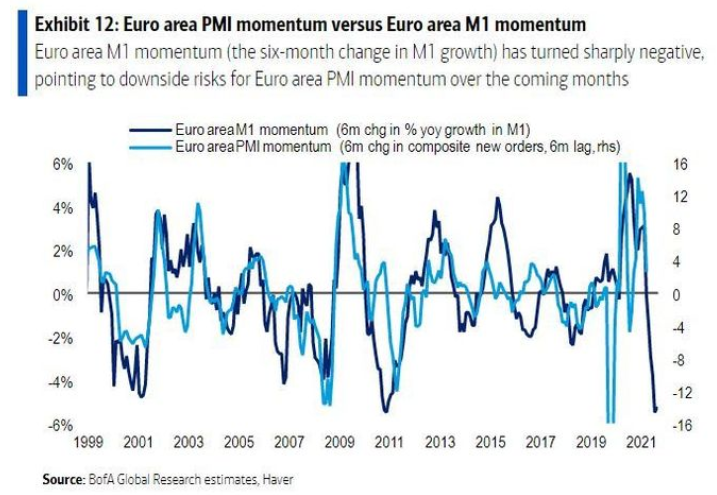
To explain, the light blue line above tracks Eurozone PMI momentum, while the dark blue line above tracks Eurozone M1 money supply growth momentum. If you analyze the right side of the chart, you can see that M1 money supply growth has sunk to the 2010/2011 lows. And with the light blue line still materially elevated, Eurozone PMIs still have plenty of room to fall. More importantly, though, if Raedler’s forecast becomes reality, the EUR/USD shouldn’t be too far behind.
The bottom line? While the USD Index’s weakness on Oct. 4 may seem material, the consolidation is likely a short-term phenomenon. With technicals, fundamentals and positioning (a proxy for sentiment) all signaling a stronger U.S. dollar over the medium term, the greenback’s outlook remains robust. Moreover, with U.S. Treasury yields shrugging off the stock market’s struggles and rallying on Oct. 4, higher U.S. interest rates should also support dollar strength over the next few months.
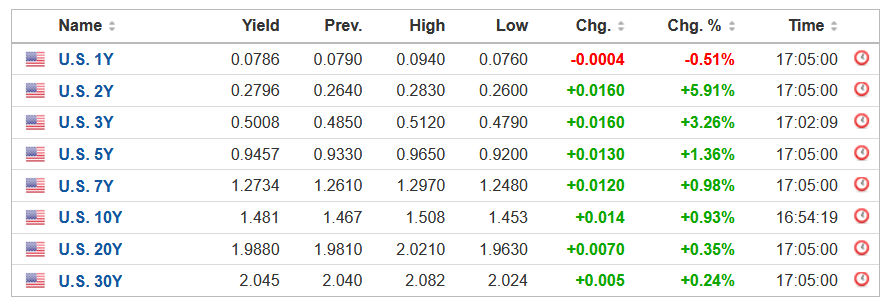 Source: Investing.com
In conclusion, the PMs rallied on Oct. 4 as a weaker U.S. dollar helped underwrite their short-term optimism. However, with the technical and fundamental headwinds that caused their YTD swoons still in place, the short-term strength is likely a corrective upswing within a medium-term downtrend. As a result, lower lows likely await the PMs over the next few months.
Overview of the Upcoming Part of the Decline
- It seems to me that the corrective upswing in gold is over, and the big decline seems to be already underway. We are very likely in the final part of this short-term decline, which is why I expect silver to catch up with mining stocks and decline quite substantially.
- It seems that the first stop for gold will be close to its previous 2021 lows, slightly below $1,700. Then it will likely correct a bit, but it’s unclear if I want to exit or reverse the current short position based on that – it depends on the number and the nature of the bullish indications that we get at that time. Before the next big slide, I will likely prefer to get back to the short position in the junior mining stocks.
- After the above-mentioned correction, we’re likely to see a powerful slide, perhaps close to the 2020 low ($1,450 - $1,500).
- If we see a situation where miners slide in a meaningful and volatile way while silver doesn’t (it just declines moderately), I plan to – once again – switch from short positions in miners to short positions in silver. At this time, it’s too early to say at what price levels this could take place, and if we get this kind of opportunity at all – perhaps with gold close to $1,600.
- I plan to exit all remaining short positions when gold shows substantial strength relative to the USD Index while the latter is still rallying. This might take place with gold close to $1,350 - $1,400. I expect silver to fall the hardest in the final part of the move. This moment (when gold performs very strongly against the rallying USD and miners are strong relative to gold after its substantial decline) is likely to be the best entry point for long-term investments, in my view. This might also happen with gold close to $1,375, but it’s too early to say with certainty at this time. I expect the final bottom to take place near the end of the year, perhaps in mid-December.
- As a confirmation for the above, I will use the (upcoming or perhaps we have already seen it?) top in the general stock market as the starting point for the three-month countdown. The reason is that after the 1929 top, gold miners declined for about three months after the general stock market started to slide. We also saw some confirmations of this theory based on the analogy to 2008. All in all, the precious metals sector is likely to bottom about three months after the general stock market tops.
- The above is based on the information available today, and it might change in the following days/weeks.
You will find my general overview of the outlook for gold on the chart below:
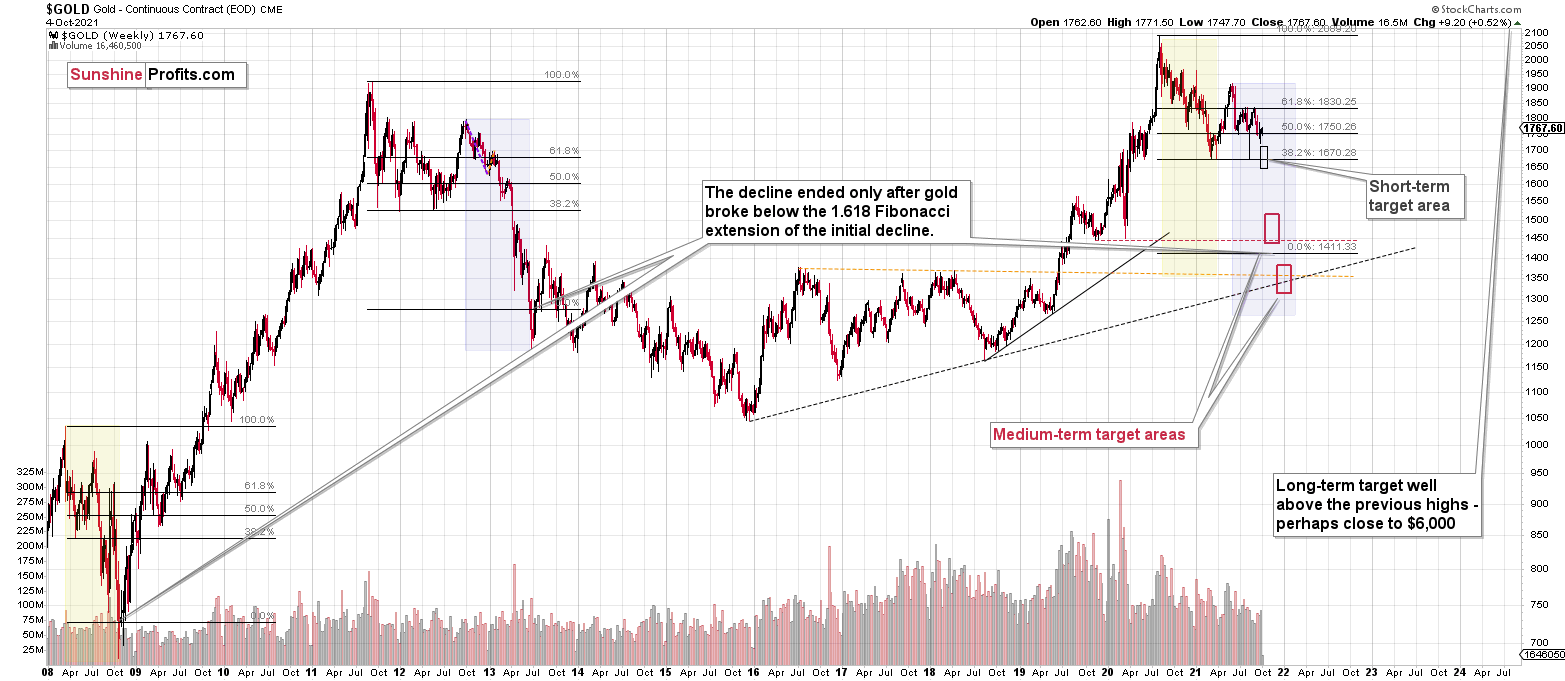
Please note that the above timing details are relatively broad and “for general overview only” – so that you know more or less what I think and how volatile I think the moves are likely to be – on an approximate basis. These time targets are not binding or clear enough for me to think that they should be used for purchasing options, warrants or similar instruments.
Letters to the Editor
Q: Silver has moved back above the resistance level of 22.50. Could you provide an update as to what has changed and the significance of the current economic numbers.
A: I already commented on silver and on the payrolls, but to clarify – nothing really changed based on them and based on silver’s upswing in the last few days. We’d all like to see markets move in a straight line right to our profit-take targets, but that’s not how the markets work. They move back and forth, sometimes based on news, sometimes based on technical reasons, and sometimes based on more or less random developments. But as long as we’re positioned in tune with the trend and based on sound analysis, we’re likely to reap great profits without waiting for them too long either.
Q: I have just watched PR's excellent breakdown of the gold stocks to gold ratio chart. As an unsophisticated investor, I appreciate PR's careful explanations. I do have a question though, which I hope he can address in the coming week. It seems that we are at a similar point in this ratio as we were in 2013 – which led to a two-year decline in gold and gold stocks. Are we perhaps looking at a two-year decline now too?
A: Thanks, I’m very happy that you enjoy my videos. I don’t think that gold will decline for that long because the fundamental situation is ridiculously favorable for the long run. It’s like the 1970s all over again to some extent, and by that I mean the upcoming stagflation. Gold was very overbought on a long-term basis in 2011, it got ahead of itself, and it needed to decline significantly. Now gold is not after a multi-year rally, it’s after a failed attempt to break to new highs, which is indeed a negative technical factor, but it’s not of the same kind of strength as the negative factor we saw in 2011.
Consequently, at some point, I expect the self-similarity to end and gold to decouple from its 2013 performance. Ultimately, it will once again be viewed as a safe haven, just as it was the case in 1929 and 2008. Back then gold didn’t continue to decline when the stock prices fell. It bottomed relatively early (after a few months) and started a massive long-term rally, which lasted for years. That’s what seems most likely to me.
Summary
To summarize, the outlook for the precious metals sector remains extremely bearish for the next few months. It seems that we are in the final part of this short-term decline, which is why I expect silver to catch up with mining stocks and decline quite substantially.
Congratulations on reaping great profits from the previous short position in the junior mining stocks! While juniors are likely to decline more, it seems to me that the profits that one could get from shorting silver right now are likely to be even bigger.
From the medium-term point of view, the key two long-term factors remain the analogy to 2013 in gold and the broad head and shoulders pattern in the HUI Index. They both suggest much lower prices ahead.
It seems that our profits from the short positions are going to become truly epic in the following months.
After the sell-off (that takes gold to about $1,350 - $1,500), I expect the precious metals to rally significantly. The final part of the decline might take as little as 1-5 weeks, so it's important to stay alert to any changes.
Most importantly, please stay healthy and safe. We made a lot of money last March and this March, and it seems that we’re about to make much more on the upcoming decline, but you have to be healthy to enjoy the results.
As always, we'll keep you - our subscribers - informed.
By the way, we’re currently providing you with the possibility to extend your subscription by a year, two years or even three years with a special 20% discount. This discount can be applied right away, without the need to wait for your next renewal – if you choose to secure your premium access and complete the payment upfront. The boring time in the PMs is definitely over, and the time to pay close attention to the market is here. Naturally, it’s your capital, and the choice is up to you, but it seems that it might be a good idea to secure more premium access now while saving 20% at the same time. Our support team will be happy to assist you in the above-described upgrade at preferential terms – if you’d like to proceed, please contact us.
To summarize:
Trading capital (supplementary part of the portfolio; our opinion): Full speculative short position (300% of the full position) in silver is justified from the risk to reward point of view with the following binding exit profit-take price levels:
Silver futures profit-take exit price: $19.12
SLV profit-take exit price: $17.72
ZSL profit-take exit price: $41.38
HZD.TO profit-take exit price: $31.98
OR if gold reaches $1,683 – in this case, I think that taking profits and closing the short position in silver (and related instruments) will be justified from the risk to reward point of view, regardless of silver’s price.
I don’t have a stop-loss level for this trade.
For-your-information targets (our opinion; we continue to think that mining stocks are the preferred way of taking advantage of the upcoming price move, but if for whatever reason one wants / has to use silver or gold for this trade, we are providing the details anyway.):
Gold futures downside profit-take exit price: $1,683
GDXJ: $35.73
JDST: $16.28
GDXD: $33.48
All mining-stock-related instruments: if gold reaches $1,683 or the GDXJ reaches $35.73 (whichever is reached first), I would exit all remaining short positions in any mining stock trading vehicles aimed at profiting from the declines in the mining stocks.
Long-term capital (core part of the portfolio; our opinion): No positions (in other words: cash
Insurance capital (core part of the portfolio; our opinion): Full position
Whether you already subscribed or not, we encourage you to find out how to make the most of our alerts and read our replies to the most common alert-and-gold-trading-related-questions.
Please note that we describe the situation for the day that the alert is posted in the trading section. In other words, if we are writing about a speculative position, it means that it is up-to-date on the day it was posted. We are also featuring the initial target prices to decide whether keeping a position on a given day is in tune with your approach (some moves are too small for medium-term traders, and some might appear too big for day-traders).
Additionally, you might want to read why our stop-loss orders are usually relatively far from the current price.
Please note that a full position doesn't mean using all of the capital for a given trade. You will find details on our thoughts on gold portfolio structuring in the Key Insights section on our website.
As a reminder - "initial target price" means exactly that - an "initial" one. It's not a price level at which we suggest closing positions. If this becomes the case (like it did in the previous trade), we will refer to these levels as levels of exit orders (exactly as we've done previously). Stop-loss levels, however, are naturally not "initial", but something that, in our opinion, might be entered as an order.
Since it is impossible to synchronize target prices and stop-loss levels for all the ETFs and ETNs with the main markets that we provide these levels for (gold, silver and mining stocks - the GDX ETF), the stop-loss levels and target prices for other ETNs and ETF (among other: UGL, GLL, AGQ, ZSL, NUGT, DUST, JNUG, JDST) are provided as supplementary, and not as "final". This means that if a stop-loss or a target level is reached for any of the "additional instruments" (GLL for instance), but not for the "main instrument" (gold in this case), we will view positions in both gold and GLL as still open and the stop-loss for GLL would have to be moved lower. On the other hand, if gold moves to a stop-loss level but GLL doesn't, then we will view both positions (in gold and GLL) as closed. In other words, since it's not possible to be 100% certain that each related instrument moves to a given level when the underlying instrument does, we can't provide levels that would be binding. The levels that we do provide are our best estimate of the levels that will correspond to the levels in the underlying assets, but it will be the underlying assets that one will need to focus on regarding the signs pointing to closing a given position or keeping it open. We might adjust the levels in the "additional instruments" without adjusting the levels in the "main instruments", which will simply mean that we have improved our estimation of these levels, not that we changed our outlook on the markets. We are already working on a tool that would update these levels daily for the most popular ETFs, ETNs and individual mining stocks.
Our preferred ways to invest in and to trade gold along with the reasoning can be found in the how to buy gold section. Furthermore, our preferred ETFs and ETNs can be found in our Gold & Silver ETF Ranking.
As a reminder, Gold & Silver Trading Alerts are posted before or on each trading day (we usually post them before the opening bell, but we don't promise doing that each day). If there's anything urgent, we will send you an additional small alert before posting the main one.
Thank you.
Przemyslaw Radomski, CFA
Founder, Editor-in-chief

