

Briefly: in our opinion, full (100% of the regular position size) speculative long positions in junior mining stocks are justified from the risk/reward point of view at the moment of publishing this Alert.
I’m moving the target level for the JNUG slightly lower, and I’m moving the targets for gold and silver lower as well.
Welcome to this week's flagship Gold & Silver Trading Alert. Predicated on last week’s price moves, our most recently featured outlook remains the same as the price moves align with our expectations. On that account, there are parts of the previous analysis that didn’t change at all in the earlier days, which will be written in italics.
Let’s start today’s analysis with a recap of what recently happened on the fundamental front.
The Weekly Fundamental Roundup
This week was all about the Fed, as officials continue to rattle the financial markets with their hawkish rhetoric. Moreover, with the S&P 500 and the NASDAQ Composite suffering mightily, the unwinding of unprecedented stimulus has stifled the bulls.
However, with the technicals perfectly predicting the GDXJ ETF's short-term bottom, hawk talk was no match for the junior miners this week. Therefore, whether it's the short or the long side, the technicals have been extremely prescient over the last several weeks.
Conversely, with the PMs' medium-term outlooks clouded by the Fed's liquidity drain, I warned on Apr. 6 that the central bank's war on inflation does not support higher asset prices. I wrote:
Please remember that the Fed needs to slow the U.S. economy to calm inflation, and rising asset prices are mutually exclusive to this goal. Therefore, officials should keep hammering the financial markets until investors finally get the message.
Moreover, with the Fed in inflation-fighting mode and reformed doves warning that the U.S. economy “could teeter” as the drama unfolds, the reality is that there is no easy solution to the Fed’s problem. To calm inflation, it has to kill demand. And as that occurs, investors should suffer a severe crisis of confidence.
Furthermore, Kansas City Fed President Esther George subtly made the point for me on May 19. She said:
 Source: CNBC
Thus, while Fed officials realize that inflation will only subside if commodity and stock prices fall, a near 20% peak-to-trough decline in the S&P 500 still hasn’t spooked market participants. Moreover, while some claim that sentiment is extremely bearish on Wall Street, the reality is that no one fears the Fed.
Please see below:
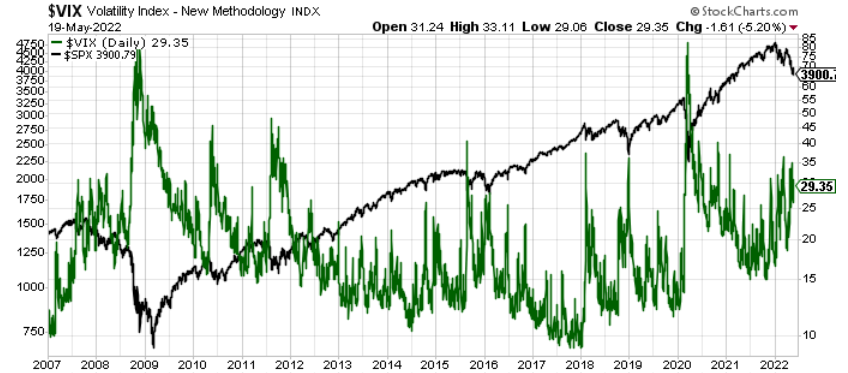
To explain, the black line above tracks the S&P 500, while the green line above tracks the Cboe Volatility Index (VIX). If you analyze the relationship, notice how material spikes in the VIX often mark bottoms for the S&P 500? In a nutshell: when true fear is present, investors rush to buy put options (downside hedges) at any cost, and volatility skyrockets. Therefore, panic is what often creates long-term bottoms.
However, if you analyze the right side of the chart, you can see that the VIX hasn’t even cracked 40 in 2022. Moreover, the VIX has actually declined, even though the S&P 500 remains in free fall. As a result, investors continue to buy call options (upside hedges) as they follow the post-GFC script and await the Fed’s dovish pivot.
And why is this? Well, despite that annualized inflation mirrors the 1970s/1980s, investors still don’t believe that the Fed will follow through with its hawkish threats.
As evidence:
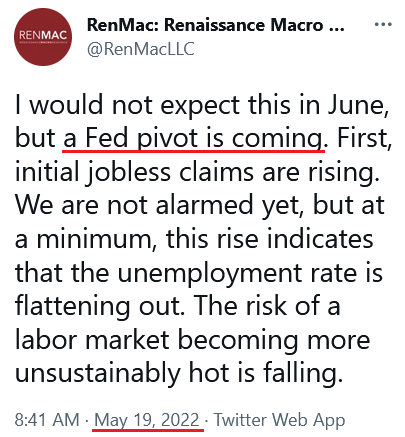
And:
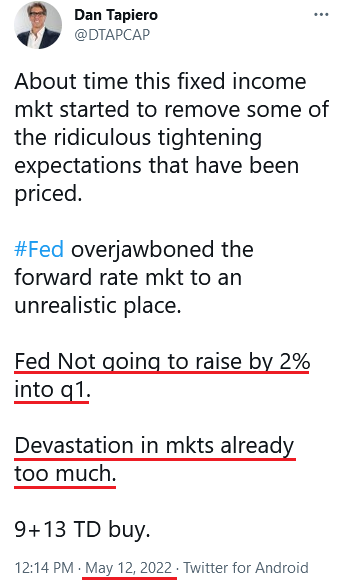
And, of course:
As a result, with the consensus still fighting the hawkish realities that I warned about since 2021, the VIX is behaving as you might expect. I mean, why panic when the Fed is all bark and no bite? Therefore, everyone relax because the Fed will turn dovish, inflation will rage, and in some alternative reality, this outcome is bullish for risk assets.
However, I’ve warned on numerous occasions that a dovish pivot would have dire long-term consequences for the U.S. economy. As such, Fed officials (should) know this, and a small short-term recession is much more attractive than a long-term hyperinflationary collapse. Yet, investors still assume that the latter option is more likely because the Fed can’t withstand falling stock prices.
However, with recency bias clouding investors’ judgment, they don’t realize that 1970s/1980s-like inflation is a completely different animal.
To explain, much has been made about the earnings weakness of Walmart and Target. In a nutshell: weak performance on their bottom lines means that U.S. consumers are struggling, demand destruction is upon us, a recession is imminent, and you guessed it... the Fed will turn dovish.
Conversely, the first rebuttal is that Home Depot – the fourth-largest retailer in the U.S. – had a phenomenal quarter. Moreover, the company primarily sells discretionary items (products purchased with disposable income), and management raised their 2022 guidance. As a result, with the U.S. housing market more affected by higher interest rates than any other sector, Home Depot hasn't seen any demand destruction.
Please see below:
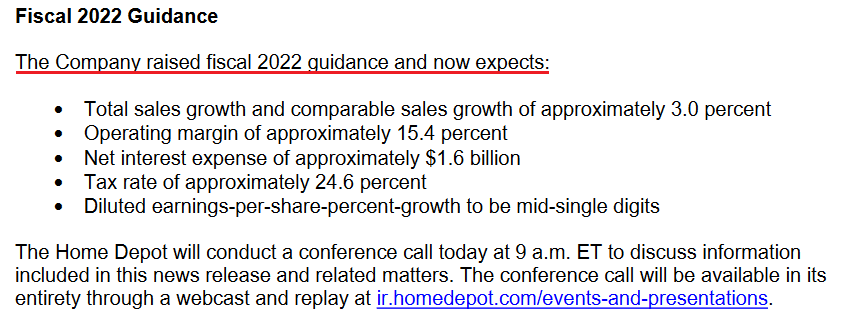 Source: Home Depot
Moreover, I noted the optimistic comments from now CEO Ted Decker previously:
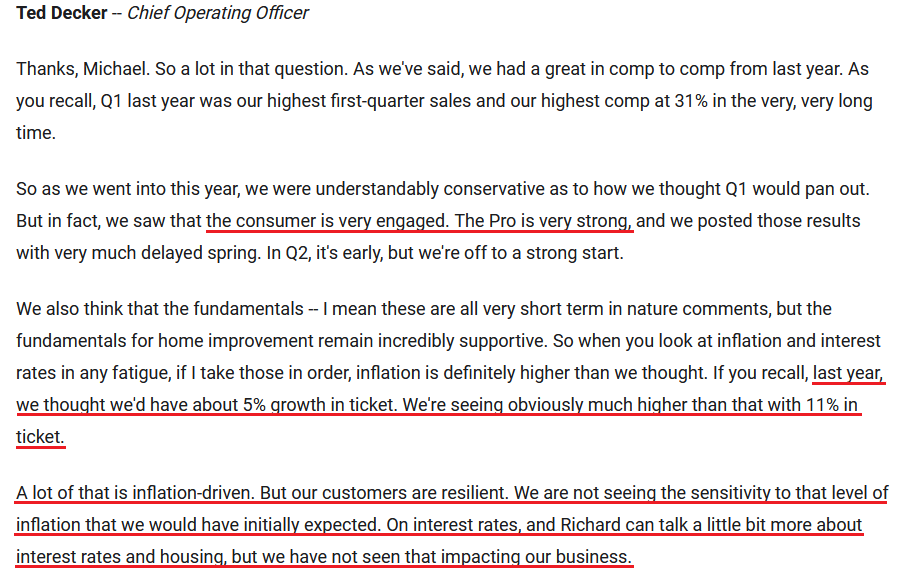 Source: Home Depot/The Motley Fool
Second, investors have misconstrued the fact that Walmart and Target are value-oriented retailers, which means they lack pricing power. In addition, both companies beat analysts’ consensus estimates on the top line. Therefore, U.S. consumers are still doing plenty of shopping, and Target CEO Brian Cornell said as much on May 18.
Please see below:
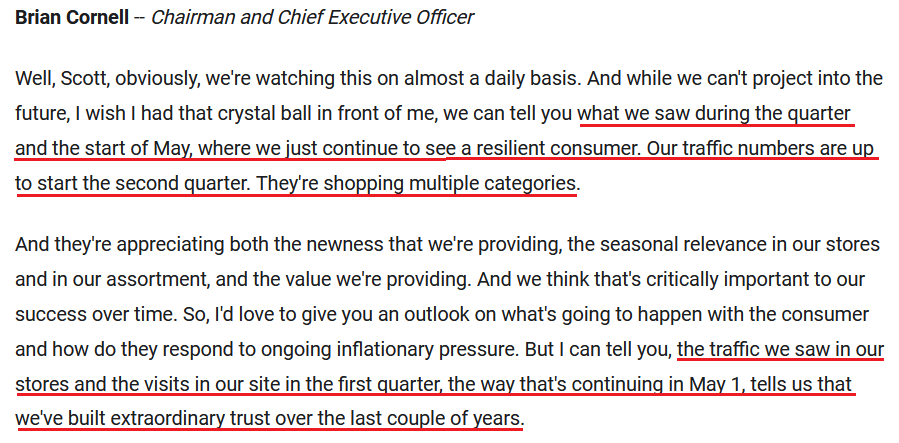 Source: Target/The Motley Fool
Third, TJX Companies – which is home to brands like T.J. Maxx, Marshalls, Winners and HomeSense (all discretionary items) – reported earnings on May 18. CEO Ernie Herrman said:
“I am very pleased with our first quarter performance. I’m especially pleased that both, first quarter adjusted pretax profit margin and adjusted earnings per share exceeded our expectations. We achieved these results even though comp sales came in a bit lighter than our plans.”
As it relates to inflation and demand:
 Source: TJX Companies/The Motley Fool
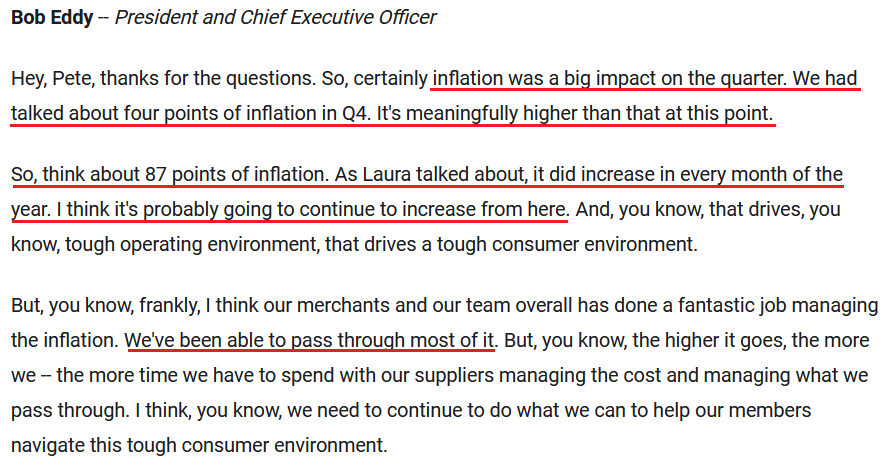
Fourth, BJ's Wholesale Club – which sells both discretionary and non-discretionary items like Costco – released its earnings on May 19. CEO Bob Eddy said:
“In the first quarter, we continued to build on the transformational gains we have driven over the last two years. Our membership continues to get stronger, achieving new all-time records in key membership metrics, including eclipsing 6.5 million members in the first quarter....
“Our performance in the first quarter was strong as we navigated what is already shaping up to be another dynamic year here in 2022. Our first quarter comp sales were up over 4%, adjusted EBITDA grew 9% to $221 million, and adjusted EPS grew 21% to $0.87. Our comps were driven by significant gains in traffic and market share, and our sales were led by our grocery and perishable categories.”
Furthermore, with inflation that’s “probably going to continue to increase from here,” imagine what would happen if the Fed performed a dovish 180.
Please see below:
 Source: BJ's Wholesale Club/The Motley Fool
As a result, while investors assume that destitute U.S. consumers will make it easy for the Fed to turn dovish, the data above suggests otherwise. Moreover, the fixation on Walmart and Target’s profit margins lacks real foresight.
For example, if the majority of U.S. companies were experiencing margin pressures, output inflation would fall significantly. Instead, inflation is still prominent because demand is underwriting higher prices. Remember, if demand fell off a cliff, inflation would crater as items go unpurchased and the weakness filters through the supply chain.
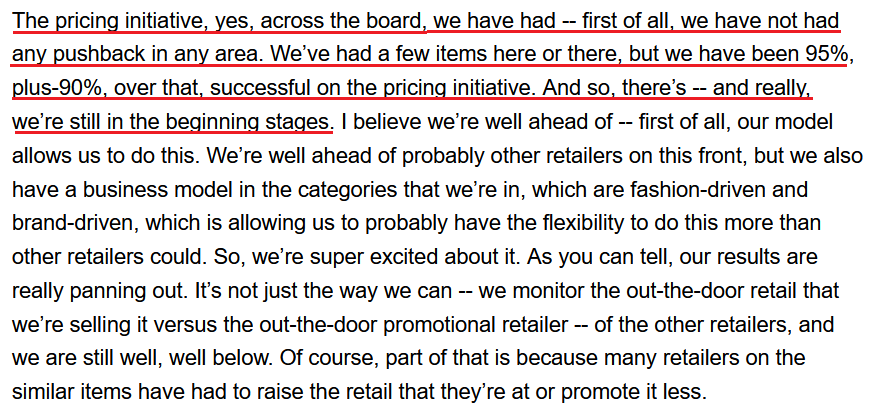
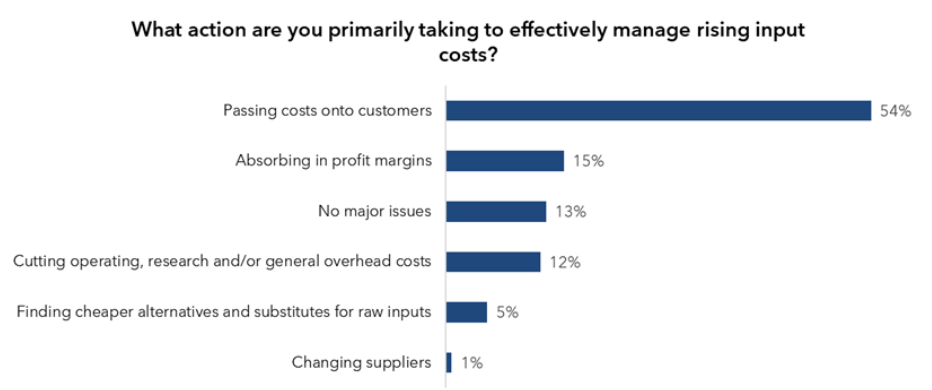
Conversely, with demand still resilient, I wrote on May 18 that the Confidence Board’s U.S. CEO survey revealed that “More than half (54%) of CEOs said they were effectively managing rising input costs by passing along costs to customers, while 13% said they had no major issues with input costs.”
 Source: The Confidence Board
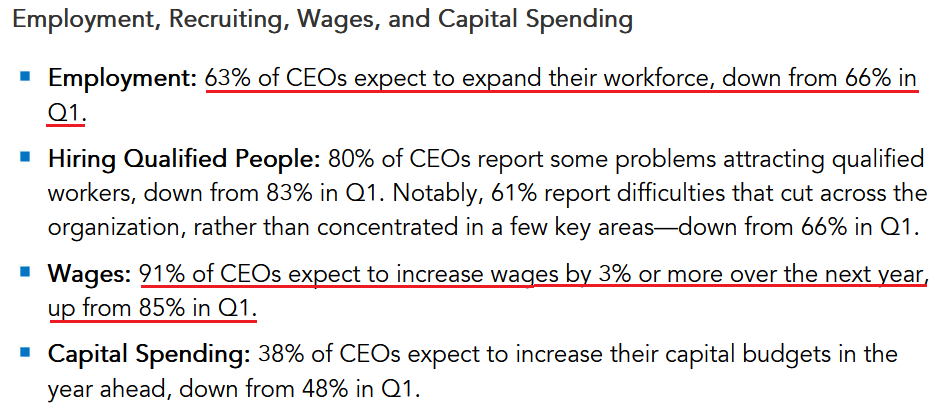
In addition, while consolidated CEO confidence has crashed to “levels not seen since the onset of the pandemic,” nearly two-thirds of CEOs plan to increase their workforce and more than nine out of 10 plan to increase wages. As a result, would major U.S. corporations be adding employees and paying them more if demand has fallen off a cliff?
 Source: The Confidence Board
The bottom line? The new narrative on Wall Street suggests that demand destruction will provide the Fed with a dovish out. However, how can demand destruction unfold when 91% of U.S. CEOs plan to increase their employees’ wages? It lacks fundamental logic. Thus, what I wrote on May 18 should prove prescient in the coming months:
While Powell keeps warning investors of what’s to come, a decade of dovish pivots has a generation of investors believing that the central bank is all talk and no action. However, with inflation at levels unseen in 40+ years, Powell is not out of ammunition, and the Fed followers should suffer profound disappointment as the drama unfolds.
In conclusion, the PMs rallied on May 19, and the GDXJ ETF was a noticeable outperformer. Moreover, with the technicals predicting the perfect pivot point, our long position is already reaping the rewards. However, while more upside should materialize in the coming days, the Fed’s hawkish hammer should change the narrative over the medium term.
What to Watch for Next Week
With more U.S. economic data releases next week, the most important are as follows:
- May 24: S&P Global manufacturing PMI, Richmond Fed manufacturing index
With inflation, employment, and output remaining resilient in April, May’s data will provide more clues about how much demand destruction, or lack thereof, has unfolded.
- May 25: FOMC minutes
With the minutes from the latest FOMC meeting providing more details about officials’ rate hike and quantitative tightening (QT) expectations, some interesting tidbits should emerge.
- May 26: Kansas City Fed manufacturing index
Like the Richmond data, the KC Fed’s regional survey will break down the growth, inflation and employment developments in Missouri.
- May 27: Personal Consumption Expenditures (PCE) Index
Since the PCE Index is the Fed’s favorite inflation gauge, the release is material. However, as it’s lagged data, the surveys and earnings calls are more useful for future predictions.
All in all, economic data releases impact the PMs because they impact monetary policy. Moreover, if we continue to see higher employment and inflation, the Fed should keep its foot on the hawkish accelerator. If that occurs, the outcome is profoundly bearish for the PMs.
Let’s start today’s technical discussion with a quick check on copper prices.

Practically, everything that I wrote about it last week remains up-to-date:
Copper recently CLEARLY invalidated another attempt to move above its 2011 high. This is a very strong technical sign that copper (one of the most popular commodities) is heading lower in the medium term.
The interest rates are going up, just like they did before the 2008 slide. What did copper do before the 2008 slide? It failed to break above the previous (2006) high, and it was the failure of the second attempt to break higher that triggered the powerful decline. What happened then? Gold declined, but silver and mining stocks truly plunged. The GDXJ was not trading at the time, so we’ll have to use a different proxy to see what this part of the mining stock sector did.
However, the situation looks different from the short-term point of view.
Even if copper is about to slide profoundly (which seems likely), it’s still likely to rebound as it reached its previous lows. In the past, we have seen such rebounds from analogous levels. I marked those situations with red rectangles.
Since PMs quite often align their short-term price moves with copper, a short-term correction here would be quite likely.
The only thing I would like to add is that it could be the case that the corrective upswing is about to end.
Now, let’s move back to the big picture.
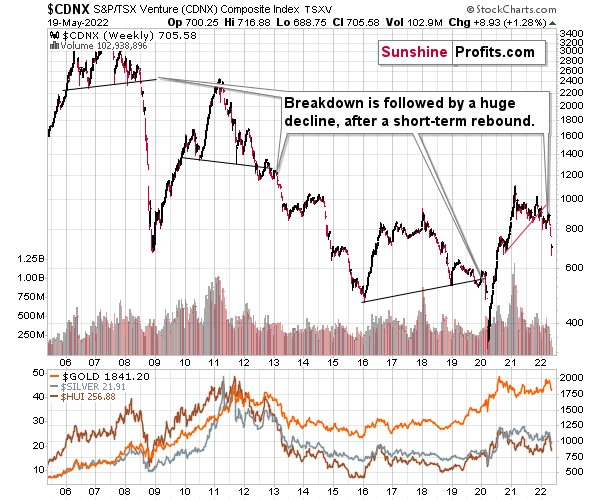
I previously commented on the above chart in the following way:
The Toronto Stock Exchange Venture Index includes multiple junior mining stocks. It also includes other companies, but juniors are a large part of it, and they truly plunged in 2008.
In fact, they plunged in a major way after breaking below their medium-term support lines and after an initial corrective upswing. Guess what – this index is after a major medium-term breakdown and a short-term corrective upswing. It’s likely ready to fall – and to fall hard.
So, what’s likely to happen? We’re about to see a huge slide, even if we don’t see it within the next few days.
And indeed, we did see a slide in the index. It’s down over 13%, even though the week is not yet over. The medium-term outlook remains extremely bearish, even though the above chart doesn’t have any specific short-term indications.
The index corrected, just like the PMs, but it didn’t change anything with regard to the medium term.
What has happened recently?
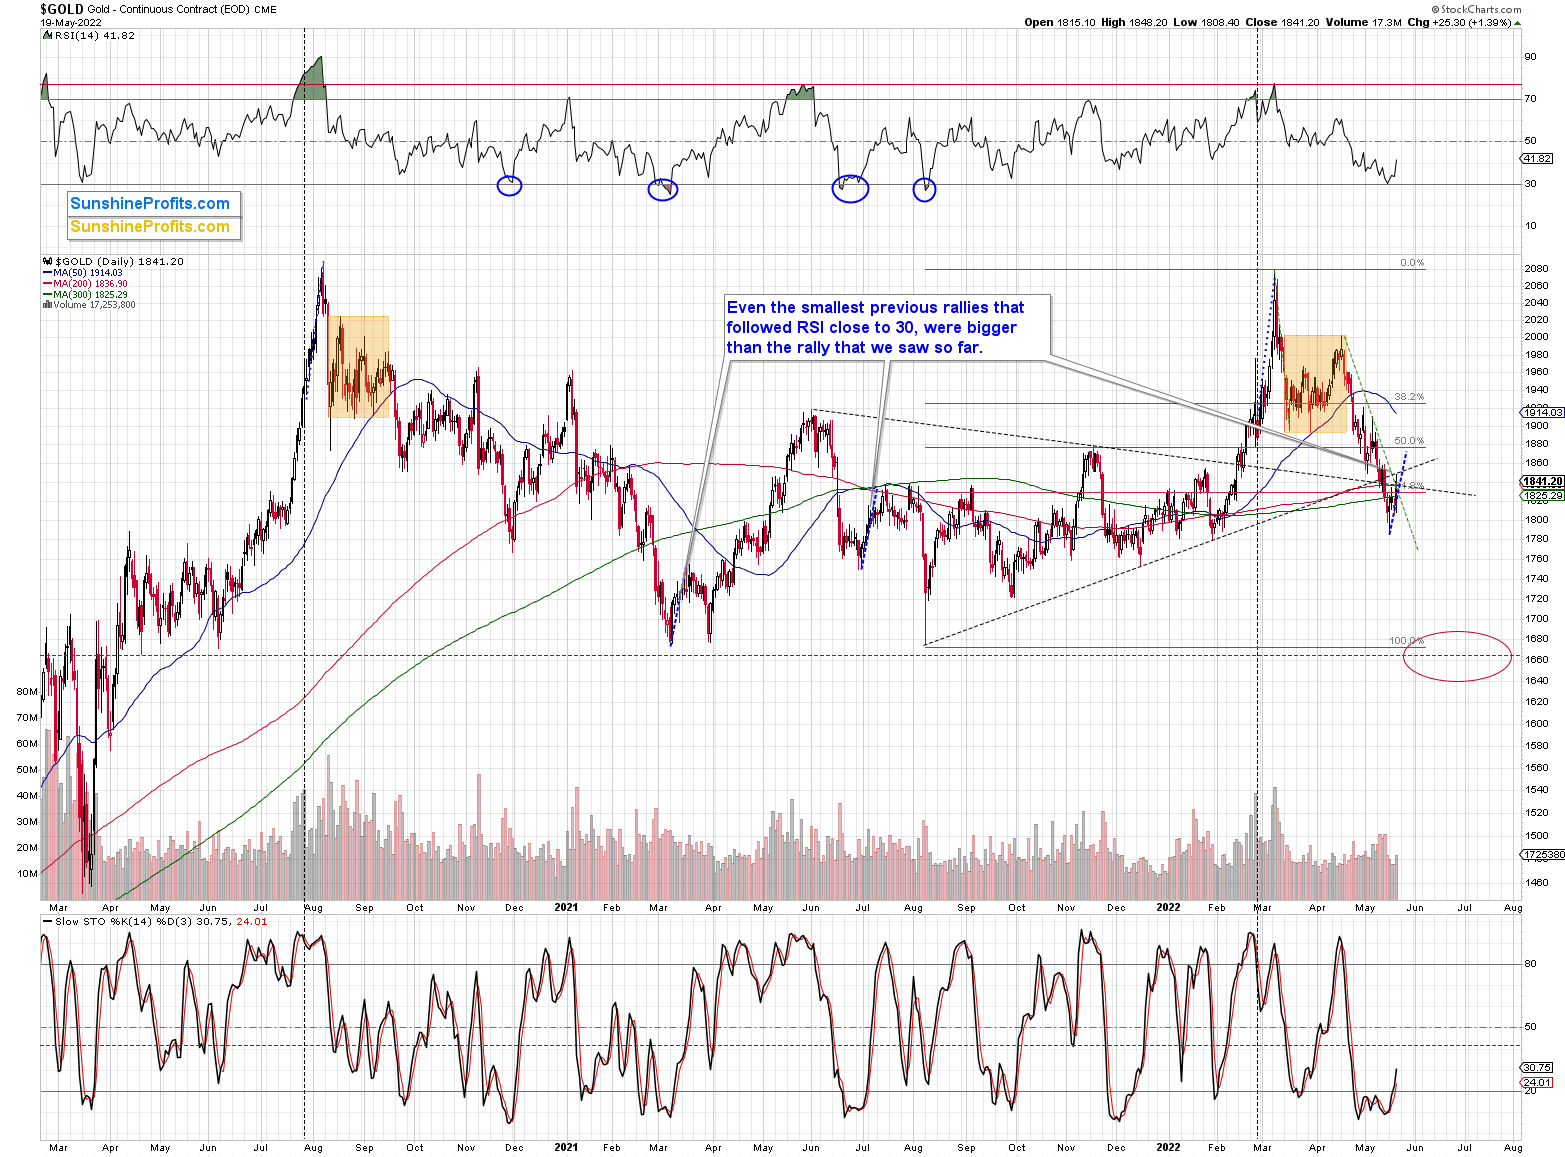
Gold erased almost the entire war-tension-based rally, and it’s now correcting this decline.
The RSI based on gold’s daily price changes was close to 30, which is a classic short-term buy signal. Based on how much gold usually rallied after this signal, it seems that it hasn’t rallied enough so far.
I marked the smallest rallies that followed an analogous signal with blue, dashed lines, and I copied them to the current situation. They point to gold above $1,880 in the near future.
Before continuing with the analysis of the recent events – since the war-tension-based rally is over - I would like to quote what I wrote about war and gold’s “imminent” price rise at the end of February, when titles like “gold to $3000!” were common on various media sides.
Here's what I wrote on February 28, 2022, in the Gold & Silver Trading Alert entitled “Since There is a War, Gold Will Rise, Right? Wrong.”:
Let’s keep in mind that for gold to decline, the war doesn’t have to end, it doesn’t have to be won by either side. The only thing that matters with regard to it, is how big the uncertainty and concern is. And the peak uncertainty/concern might be today, as everything is new, and the situation is dramatically changing the geopolitical environment in Europe.
For comparison, remember Covid-19 cases, deaths in early 2020? That was just a tiny fraction of what we saw later. However, it was new and unknown. People were particularly scared then, and the markets moved particularly significantly then – not based on additional millions of cases and thousands of deaths next year.
Investing and trading are difficult. If it was easy, most people would be making money – and they’re not. Right now, it’s most difficult to ignore the urge to “run for cover” if you physically don’t have to. The markets move on rumor and sell the fact. This repeats over and over again in many (all?) markets, and we have direct analogies to similar situations in gold itself. And junior miners are likely to decline the most, also based on the massive declines that are likely to take place (in fact, it already started) in the stock markets.
That wasn’t the peak uncertainty - it peaked about a week later, but that’s not crucial. What is crucial is that the war is still taking place (months later), so it seems that one could say that the above proved correct.
Since junior miners just moved to new 2022 lows, it was also profitable not to chase the “emotional stampede”, but rather focus on the analogies to the previous situations from the past. Based on how the situation has developed in the markets so far, it seems that the clearest analogy is to how the gold market performed in 2001, based on the U.S.-Afghanistan war. I provided the chart in my Feb. 28, 2022, analysis, but here it is again:
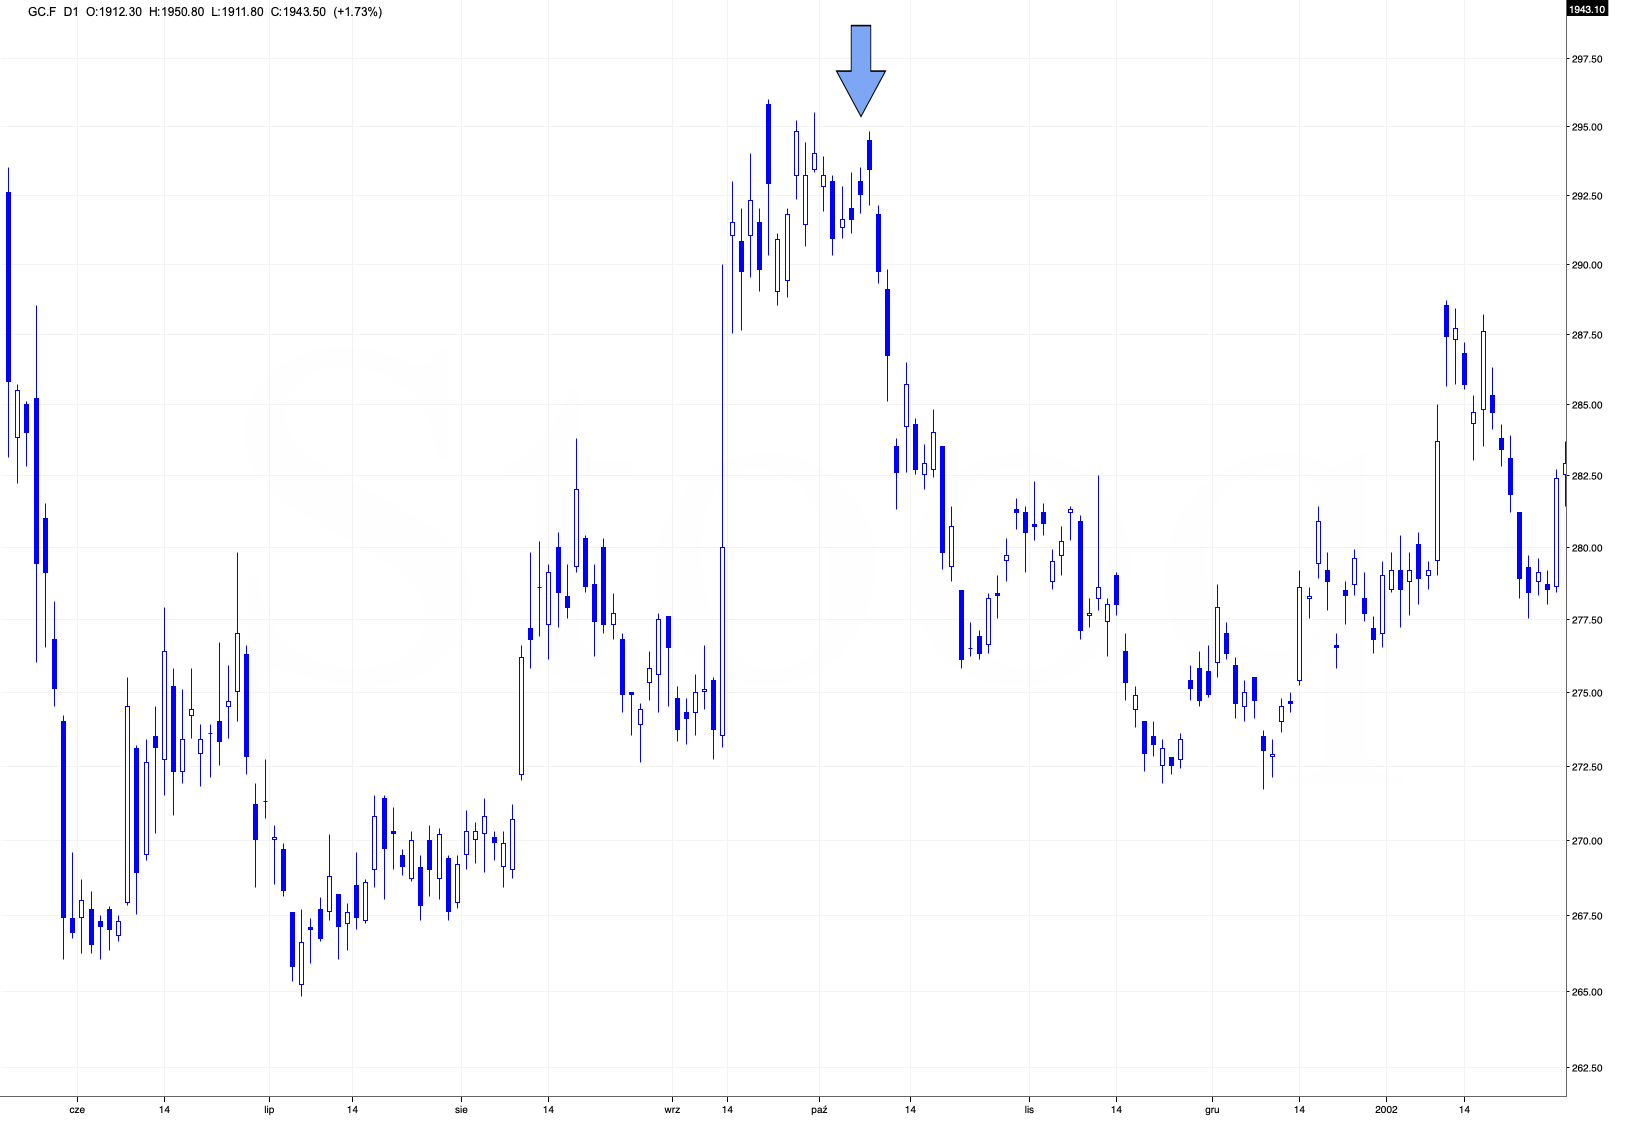
The decline had been big and sharp, but please note when it ended. Gold formed an initial, and then final, short-term bottom, very close to the price levels at which the rally started before the outbreak of the war.
So, gold corrected, and then it did what it was likely to do based on the previous trends.
That’s exactly what we’re seeing right now. Gold is correcting, and when it’s done correcting, it’s likely to return to its previous trend. This time, the medium-term trend is down.
The major takeaway from this situation is that when things get hot, it’s absolutely necessary to check what happened previously given similar situations before acting based on emotions.
Before looking at mining stocks, let’s take a look at gold from a broader point of view.
Let’s keep in mind that between 2020 and now, quite a lot happened, quite a lot of money was printed, and we saw a war breaking out in Europe. Yet, gold failed to rally to new highs.
In fact, it’s trading very close to its 2011 high, which tells you something about the strength of this market. It’s almost absent.
Truth be told, what we see in gold is quite in tune with what we saw after the 2011 top, and in particular, shortly after the 2012 top. The long-term gold price chart below provides details.
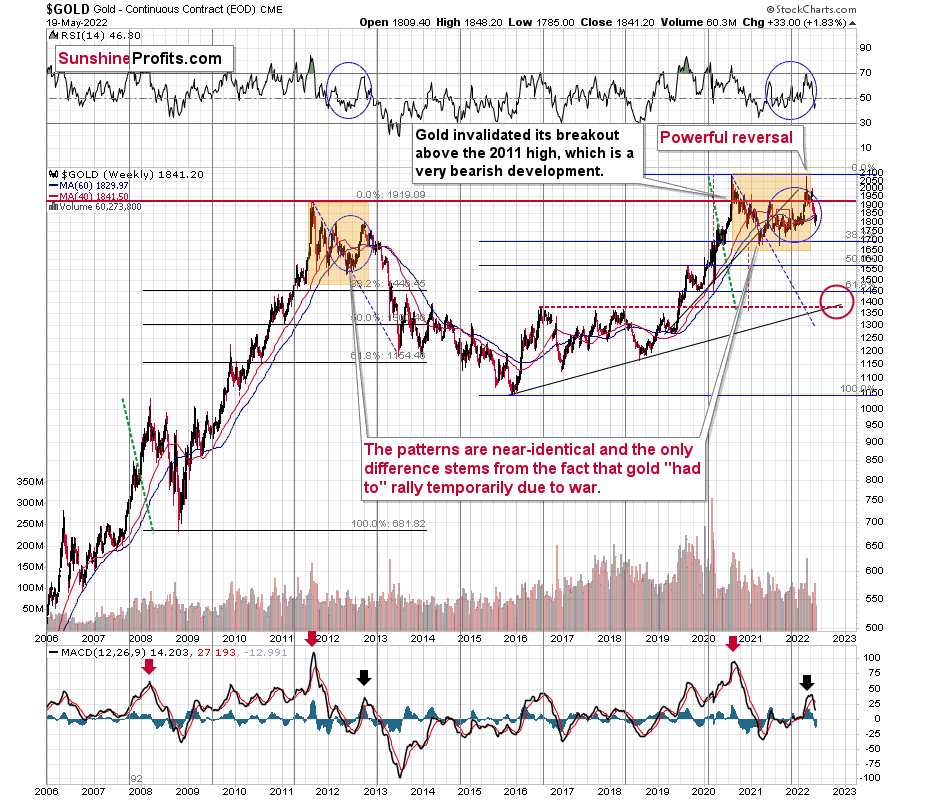
It seems that if it weren’t for the war in Europe, gold wouldn’t have been able to move above $2,000 and instead it would have topped close to its previous highs, which provided strong resistance.
The extraordinary thing about that is that that’s exactly what happened in 2012. Gold moved higher but only until it reached its previous highs, which happened in the second half of 2012.
This time the RSI was a bit higher, but it was close to 70, just like what we saw in 2012.
The moves that we see in the long-term MACD indicator (lower part of the above chart) also confirm the analogy between now and 2012. The indicator is between 25 and 50, and it’s above its previous local top (early 2012 and mid-2021), and this local top formed after a profound decline from the ultimate top.
Yes, this time gold moved back to the previous high, but:
- This happened based on a geopolitical event (war in Europe) and geopolitically-driven rallies are generally unsustainable;
- When gold reached its previous highs, it also formed a profound weekly reversal, which formed on huge volume, and that’s very bearish.
So, the current outlook for gold is very bearish – the recent back and forth movement (the consolidation) appears analogous to the back-and-forth part of the decline that we saw right after the 2012 top. That was the beginning of a huge medium-term downswing.
There are also very interesting short-term takeaways from the above chart.
If the 2012-2013 is currently being replayed (at least to a significant extent), then let’s not forget that this decline initially took the shape of a back-and-forth decline with lower lows and lower highs (but there were notable short-term rallies within the decline).
One of those counter-trend rallies took place when gold touched its 40- and 60-week moving averages (marked with blue and red) in late 2012. The RSI was trading at about 50 at that time, and that’s more or less when we saw the clear sell signal from the MACD indicator (lower part of the above chart).
Let’s see how this applies to the current situation.
The 40- and 60-week moving averages are currently trading at ~$1,830 and ~$1,840, respectively. Consequently, they are quite close to recent short-term lows.
The RSI is just below 50.
Plus, we recently saw a clear sell signal from the MACD indicator.
Consequently, seeing a brief rally here or after an additional small decline would not be bullish – it would be a perfectly bearish confirmation of the 2012-now analogy.
The above is based on what I wrote previously – right before the bottom. As the corrective upswing is already taking place, we see that the history does indeed rhyme. Still, let’s not lose focus – the medium-term trend remains down, and what we see right now, is just a counter-trend upswing.
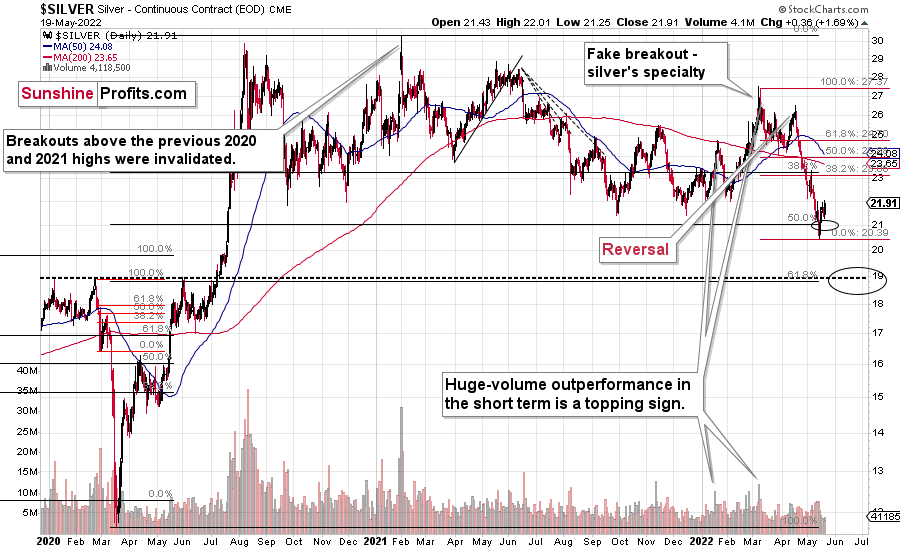
Just like gold, silver hit my target area and then moved slightly below it.
How high could silver go? In an analogy to gold, silver could correct approximately 38.2% of the recent decline. Interestingly, just like in the case of gold, this retracement coincides with the recent immediate-term top, which makes it more reliable as a target.
Please note that the above would be in tune with how silver corrected in early 2020 after the first part of the decline. It erased a bit over 38.2% of the initial decline and declined from there.
After the correction is over, I expect the decline to continue, and I think that the next move lower will be powerful.
In fact, gold is not the only precious metal that is repeating its 2012 performance right now, and you can see more details on silver’s long-term chart.
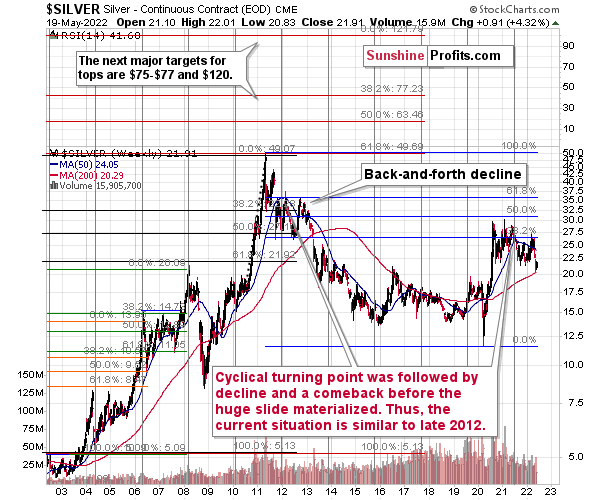
As you can see on the above chart, silver corrected about 50% of the previous downswing, and this correction ended at about $30, a long time ago. Ever since, silver has been declining, and even the outbreak of war in Europe didn’t make silver rally above that level.
On the above chart, you can see how silver first topped in 2011, then declined and formed another top at the cyclical turning point. Next, it declined once again – to the previous lows. After that, silver rallied (in 2012 and 2022), and it topped between its 50-week moving average (marked in blue) and the previous top. Now silver is declining in a back-and-forth manner (you can see it more clearly on the previous short-term silver chart).
Back in 2012, these were just the early days of a gargantuan decline, and the same appears likely to be the case this time. Interest rates are going up after all, and the Fed is determined to quench inflation.
Let’s not forget that rising interest rates are likely to negatively impact not just commodities, but practically all industries. This will likely cause silver’s price to decline profoundly, as silver’s industrial demand could be negatively impacted by lower economic growth (or a decline in economic activity).
Besides, please note that silver didn’t even manage to rally as much as copper (which tried to move to new highs recently) or most other commodities, thus being rather weak.
Consequently, it seems that silver will need to decline profoundly before it rallies (to new all-time highs) once again.
Having said that, let’s take a look at what happened in junior mining stocks. In yesterday’s analysis, I wrote the following:
Of course, there will be some back-and-forth movement on an intraday basis, but it doesn’t change anything. Junior miners are likely to rally this week nonetheless. And perhaps not longer than that, as the next triangle-vertex-based reversal is just around the corner – on Friday/Monday.
The previous few days were the “forth” and yesterday [May 18] was the “back” movement – so far, my comments remain up-to-date. However, comparing the market action with what I wrote previously isn’t what I meant by analogies to past situations. I meant this:
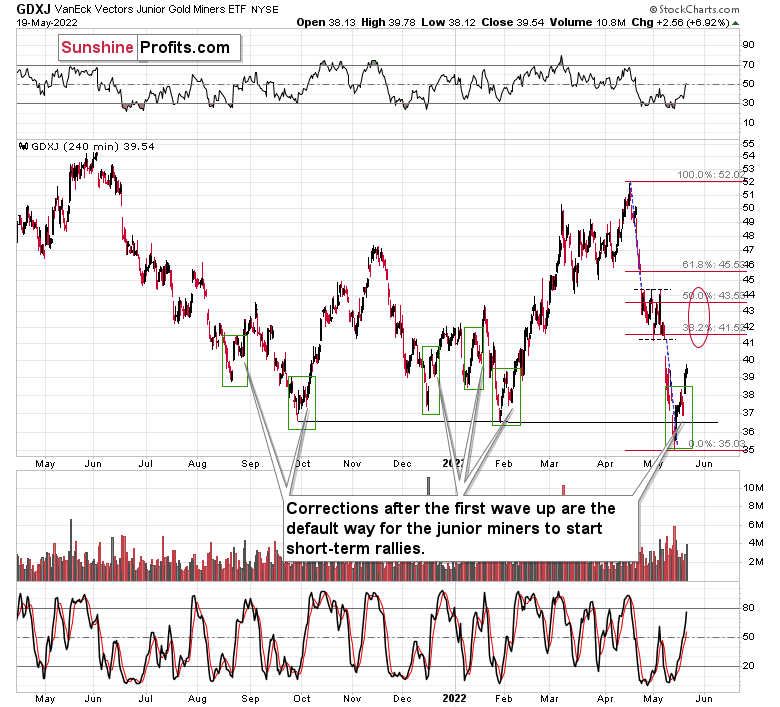
The areas marked with green rectangles are the starting moments of the previous short-term rallies. Some were bigger than others, and yet they all had one thing in common. They all included a corrective downswing after the initial post-bottom rally.
Consequently, what we saw yesterday [May 18] couldn’t be more normal during a short-term rally. This means that yesterday’s decline is not bearish at all and the profits from our long positions are likely to increase in the following days.
Besides, the general stock market declined by over 4%, while the GDXJ (normally moving more than stocks) ETF – a proxy for junior mining stocks – declined by only about 2%.
Well, that’s exactly what happened. Juniors soared yesterday, and so did profits from our long positions (which we managed to open practically right at the bottom).
I would like to clarify one of the points that I made previously with regard to timing the top. I previously wrote that based on the next triangle-vertex-based reversal, it’s likely that the top will take place today (Friday) or on Monday. However, I re-visited the charts to make sure that I got the date right, and when I applied the same methodology on a bigger chart, it turned out that the vertex that I described was already behind us, and that it simply confirmed the bottom when we switched from short to long positions.
Consequently, it’s not very likely that the final top for the rally will take place today or on Monday. It could be the case based on other reasons, but not based on the triangle-vertex-based reversal.
Since gold and silver are likely to move higher, so are junior miners.
I previously wrote that the target for junior miners is at the 38.2% Fibonacci retracement and the recent short-term low, a bit above $41. However, it could be the case that the next resistance is a bit higher, closer to the upper border of the previous consolidation. This could correspond to the 50% Fibonacci retracement close to the $44 level.
Still, remaining conservative and keeping our chances of exiting the current trade and cashing profits at all, I’m keeping the profit-take level intact.
On a very short-term basis, junior miners could be driven by stock market moves. Meanwhile, the stock market appears to be repeating its very recent consolidation pattern.
After stocks’ initial rebound (late April), they declined once again, and then they rallied back up to their previous high before sliding to new lows.
So far, we’re seeing something similar. The initial rebound was indeed followed by a sharp decline. In fact, even the intraday performance is similar. The daily decline was big and sharp, and it was followed by a daily reversal. What followed then was a small daily rally and then a huge daily rally, which was the final top.
If history rhymes, then perhaps today’s or Monday’s (or Tuesday’s) rallies will be significant and take stocks to the final short-term top. This could correspond to a short-term top in junior miners as well.
The above would fit the scenario in which the miners continue to rally for the next 1-3 days.
Also, let’s not forget about the forest while looking at individual trees. By that, I mean looking at how gold stocks perform relative to gold. That’s one of the major indications that the current situation is just like what we saw at the 2012 top.
I previously wrote the following:
Gold stocks (GDX, GDXJ, and HUI Index) have recently been quite strong relative to gold. OK, but is this necessarily bullish? It might be, until one considers the fact that we saw the same thing at the 2012 top! This changes everything, and it does so, because the links between now and that top are almost everywhere: in gold, in silver, in gold stocks, and even in their ratios.
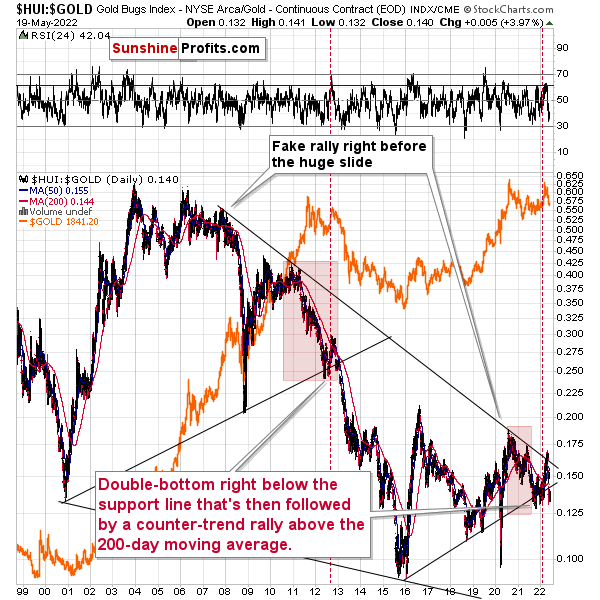
As it turns out, the gold stocks to gold ratio is behaving almost identically as it was behaving at the 2012 top in the precious metals sector.
In both cases, the ratio moved below the rising medium-term support line, then formed a double-bottom below the line, and invalidated the breakdown, which resulted in a counter-trend rally. The rally ended shortly after the ratio moved above its 200-day moving average (marked in red). That’s what happened recently. What happened next in 2012? The decline not only continued – it accelerated!
Consequently, the recent action in the ratio is not really bullish. In other words, the fact that gold stocks were recently (in the short run only) strong relative to gold doesn’t make the medium-term outlook for the precious metals sector bullish. However, it remains bearish.
Interestingly, the ratio itself moved to its declining resistance line (and it even moved slightly above it, but the move was too small to be viewed as reliable), indicating that the corrective upswing might already be over or almost over. We get the same indication from the RSI indicator. It’s not above 70, but in the case of most local tops, the RSI didn’t have to move above 70. It just moved to more or less the same levels – I marked it with a horizontal blue line.
The above is actually a confirmation of the analogy that is visible directly in all three key components of the precious metals sector: gold, silver, and mining stocks.
Indeed, the HUI to gold ratio moved lower recently, clearly invalidating the breakout above its declining resistance line – in line with my previous expectations.
The decline didn’t stop there. The ratio actually managed to decline below its rising support line, likely surprising those who didn’t see the analogy to 2012-2013 (but if you’ve been reading my analyses for some time – you did).
The implications are extremely bearish, as it appears that the 2012-2013 decline will now be repeated to a considerable extent. Still, given this similarity, it seems that we might see a short-term correction, just like the one that we did in the early part of the 2012 decline.
I already discussed the analogies to 2012-2013 in gold and silver, so let’s take a look at the analogy in the HUI Index – a proxy for gold stocks.
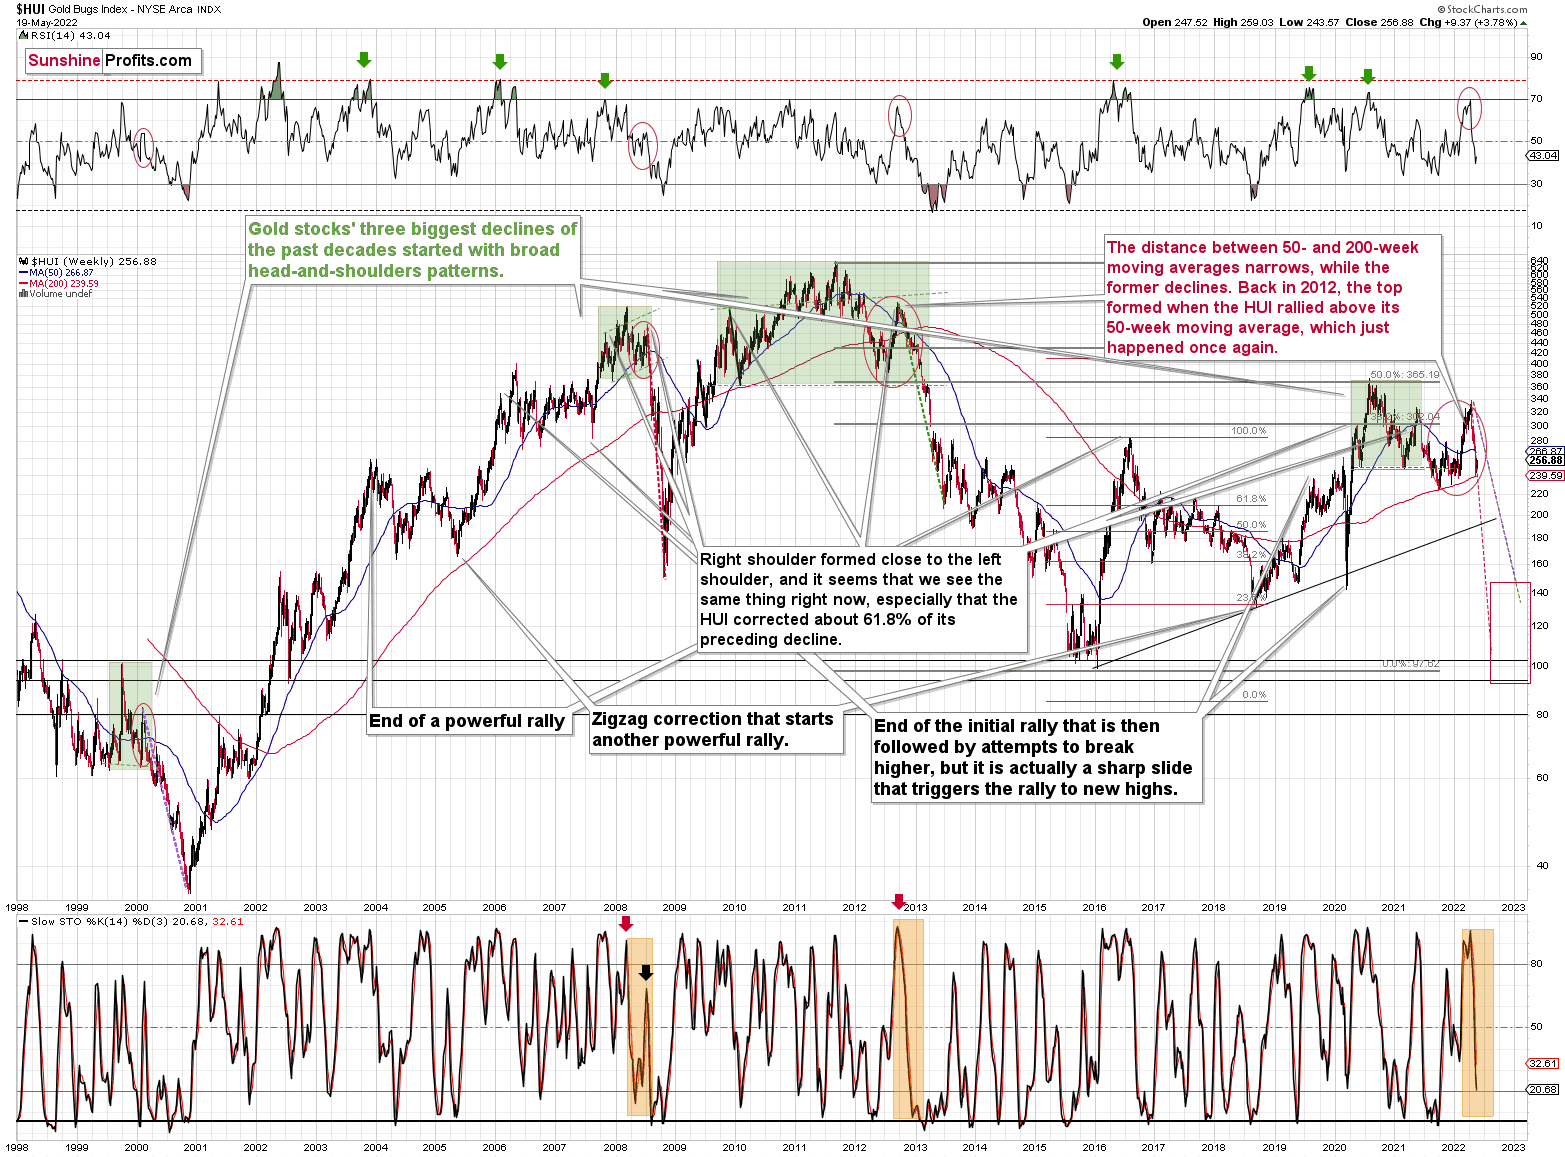
If you look at the areas marked with red circles (especially now, 2012/2013, and 2008), you’ll notice that they are very similar. These are the sizable short-term rallies that we saw after / in the final parts of the broad head-and-shoulders patterns.
The moves were quite sizable – the 2012 rally was even bigger than the current one, even though there was no war in Europe at that time.
Based on how broad the pattern is and the self-similarity present in gold, it seems that the analogy to what happened in 2012 is most important right now.
Looking at the moving averages, we see that the 50-week moving average (blue) and 200-week moving average (red) performed quite specifically in late 2012, and we see the same thing this year.
The distance between 50- and 200-week moving averages is currently narrowing, while the former is declining. Back in 2012, the top formed when the HUI rallied above its 50-week moving average, which just happened once again.
The RSI indicator (above the price chart), based on the HUI Index’s weekly chart, provides us with another confirmation of the analogy, and the same goes for the stochastic indicator (below the price chart). The former was just close to the 70 level – exactly what we saw at the 2012 top, and the latter was above 90 – again, something that we saw at the 2012 top.
As history tends to rhyme, gold stocks are likely to slide, similarly to how they declined in 2012 and 2013.
Still, if the general stock market slides, and that appears likely for the following weeks and months, then we might have a decline that’s actually similar to what happened in 2008. Back then, gold stocks declined profoundly, and they have done so very quickly.
Please note that the sharpness of the recent decline in miners was even bigger than the one that we saw in 2008!
The dashed lines that start from the recent prices are copy-paste versions of the previous declines that started from the final medium-term tops. If the decline is as sharp and as big as what we saw in 2008, gold stocks would be likely to decline sharply, approximately to their 2016 low. If the decline is more moderate, then they could decline “only” to 120-150 or so. Either way, the implications are very, very, very bearish for the following weeks.
Also, we saw a fresh sell signal from the weekly stochastic indicator, which (unlike its 4-hour version) is quite efficient. This is a very bearish development for the medium term. After all, the last two times we saw this signal were at the 2021 and 2020 tops.
Let’s take a brief look at the stock market indices.
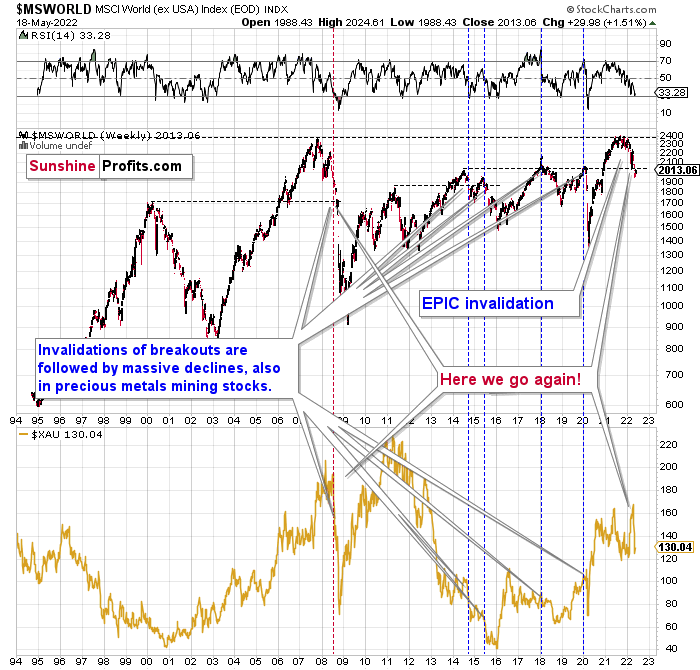
The technical picture in the case of world stocks remains extremely bearish, and my previous comments on it were just confirmed. Here’s what I’ve been writing about the above chart for quite a few weeks now:
World stocks have already begun their decline, and based on the analogy to the previous invalidations, the decline is not likely to be small. In fact, it’s likely to be huge.
For context, I explained the ominous implications on Nov. 30. I wrote:
Something truly epic is happening in this chart. Namely, world stocks tried to soar above their 2007 high, they managed to do so, and… they failed to hold the ground. Despite a few attempts, the breakout was invalidated. Given that there were a few attempts and that the previous high was the all-time high (so it doesn’t get more important than that), the invalidation is a truly critical development.
It's a strong sell signal for the medium - and quite possibly for the long term.
From our – precious metals investors’ and traders’ – point of view, this is also of critical importance. All previous important invalidations of breakouts in world stocks were followed by massive declines in mining stocks (represented by the XAU Index).
Two of the four similar cases are the 2008 and 2020 declines. In all cases, the declines were huge, and the only reason why they appear “moderate” in the lower part of the above chart is that it has a “linear” and not a “logarithmic” scale. You probably still remember how significant and painful (if you were long, that is) the decline at the beginning of 2020 was.
Now, all those invalidations triggered big declines in the mining stocks, and we have “the mother of all stock market invalidations” at the moment, so the implications are not only bearish, but extremely bearish.
World stocks have declined below their recent highs, and when something similar happened in 2008, it meant that both stocks and gold and silver mining stocks (lower part of the chart) were about to slide much further.
The medium-term implications for mining stocks are extremely bearish.
Let’s take a look at the U.S. stock market.
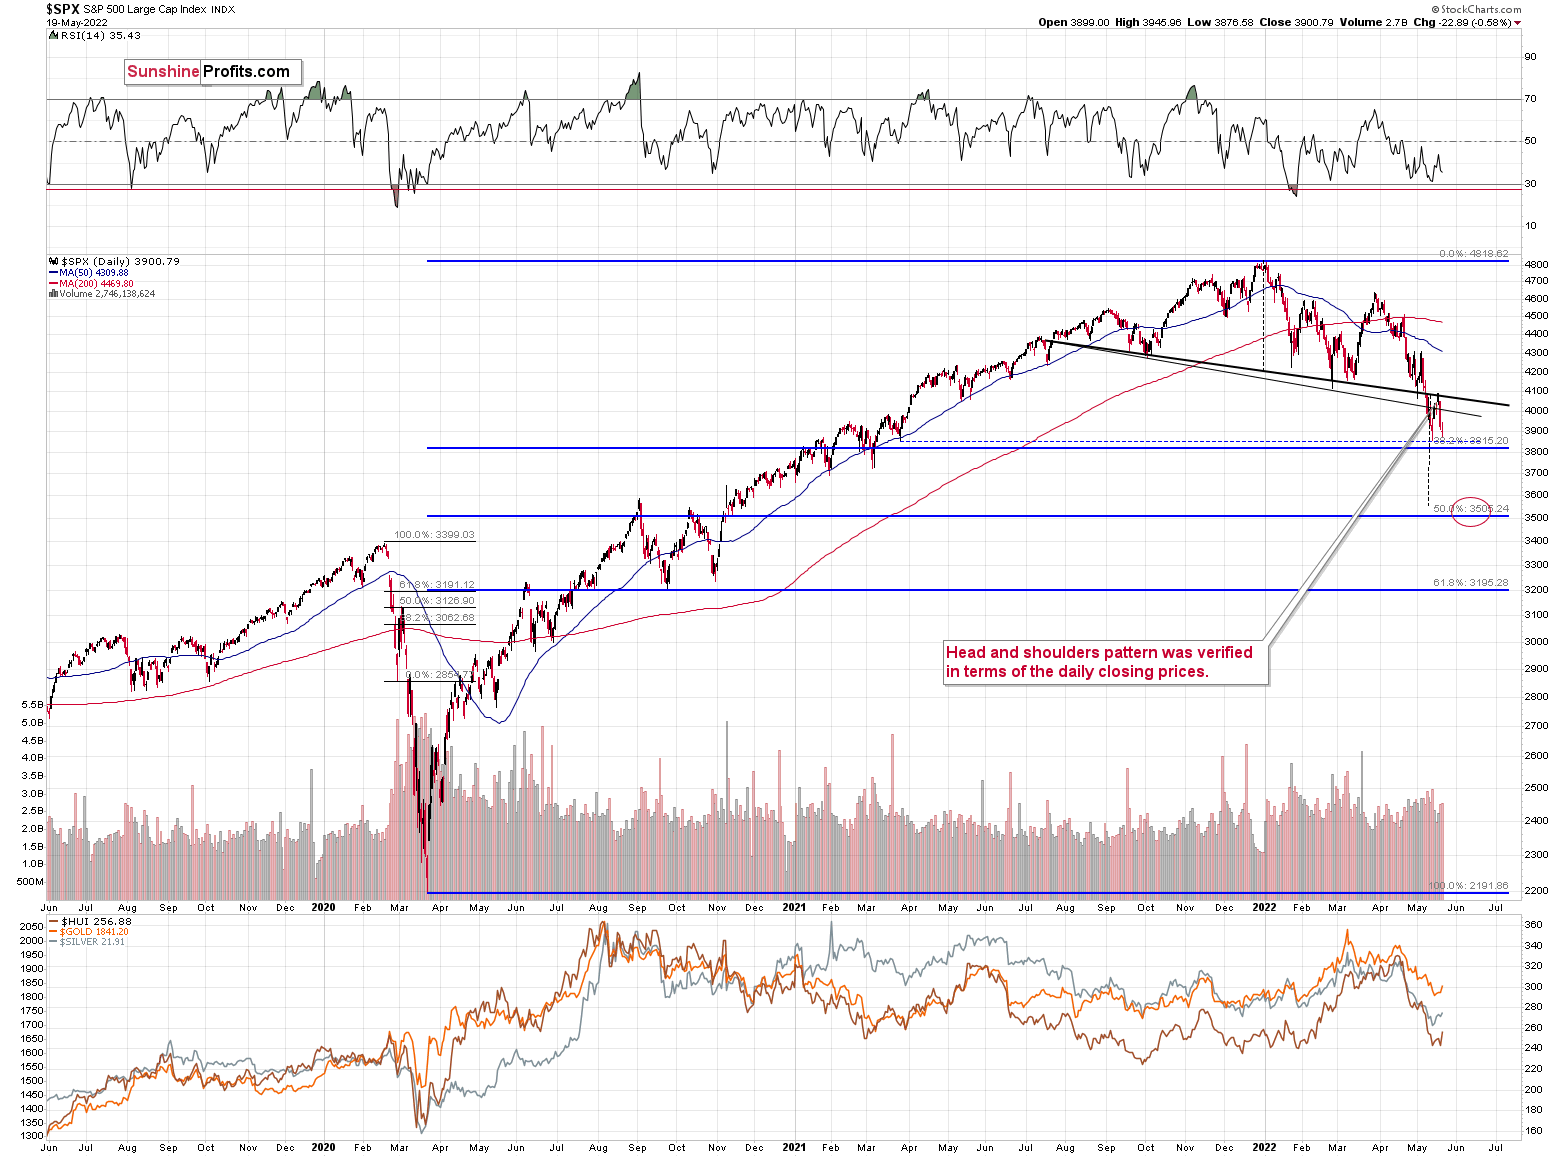
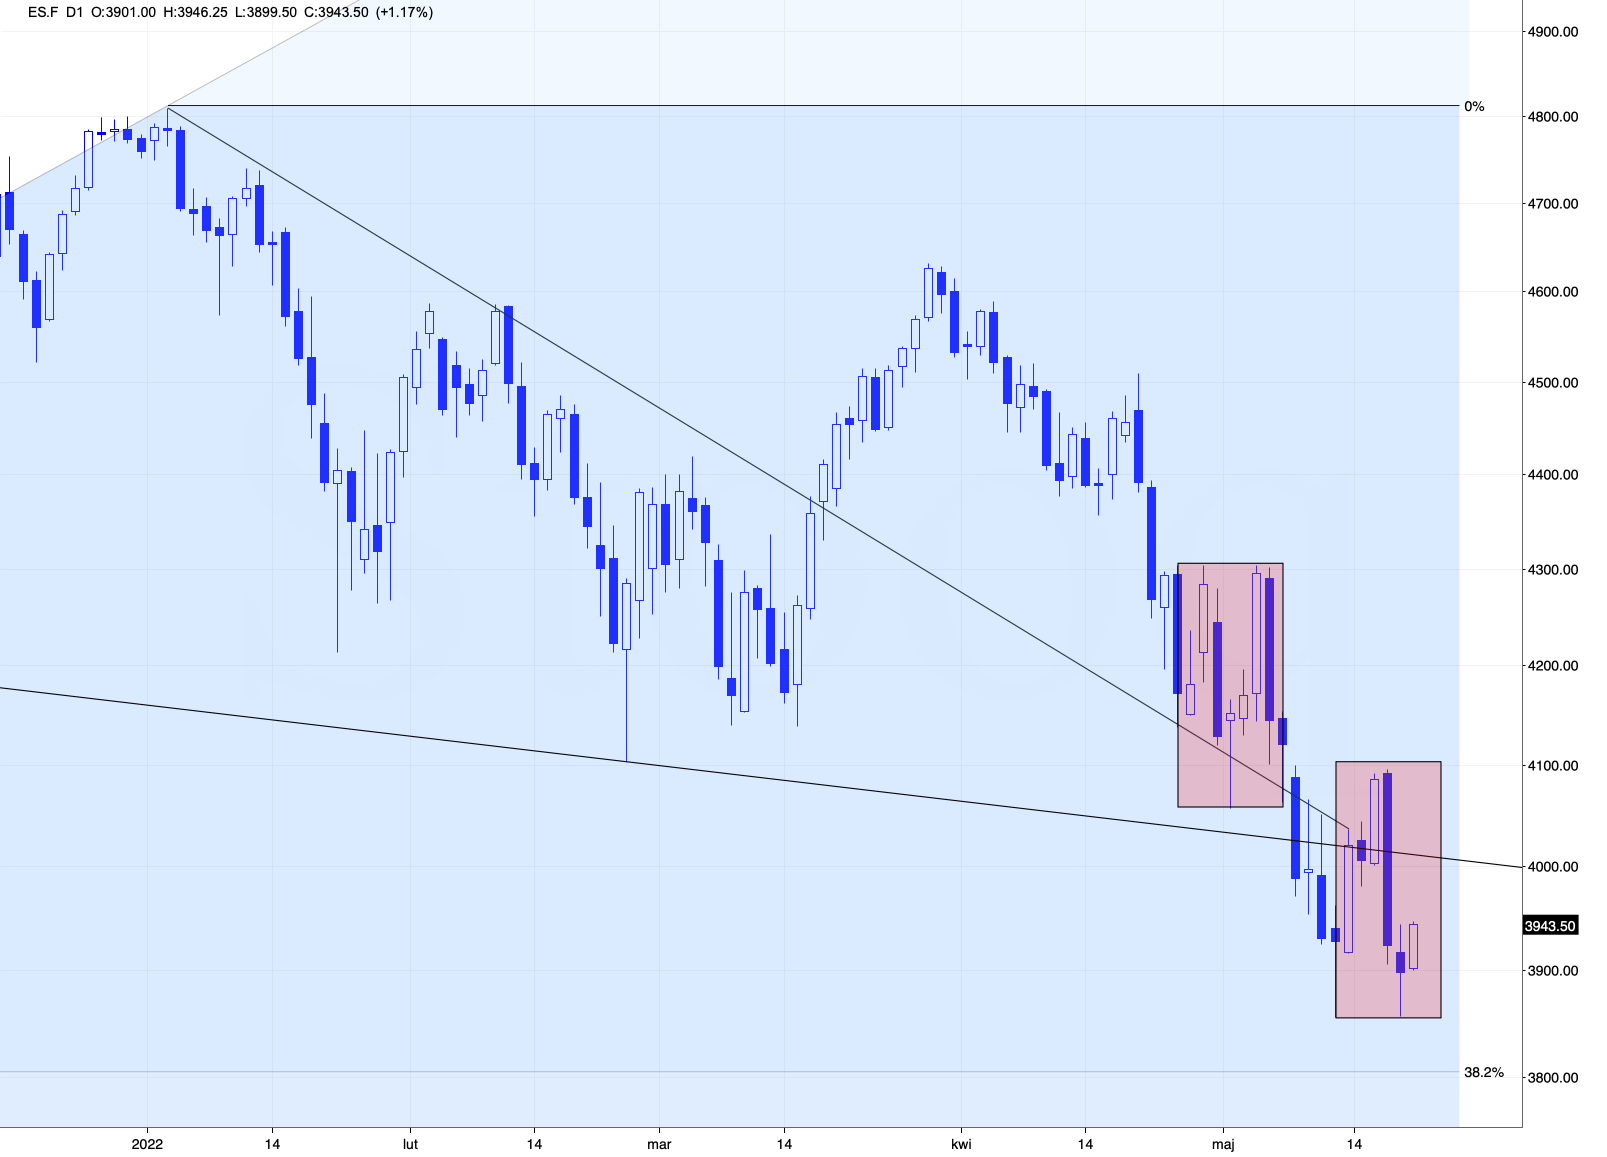
I previously wrote about the head and shoulders pattern in the S&P 500 that had very bearish implications. I also wrote about the invalidation of the pattern, which had bullish implications for the short term. However, all this was based on intraday prices, and therefore the neck level of the formation simply doesn’t appear to provide either strong support or strong resistance.
Consequently, it seems that the formation should be viewed from a different angle – through the lens of daily closing prices.
I added an additional neck level to the above chart – one based on the daily closing prices – and I used a thick black line for it. This line was broken to the downside, and it wasn’t really broken to the upside, despite the recent upswing. Consequently, from this point of view, the formation has already been confirmed.
This fits the very short-term picture for the S&P 500, too. Namely, we could see another move to the neck level after which the decline follows.
This move to the recent short-term high in the S&P 500 could provide us with a great opportunity to take profits off the table and re-enter short positions in junior mining stocks.
From a broader point of view, let’s keep in mind what happened in the previous cases when stocks declined profoundly – in early 2020 and in 2008. Miners and silver declined in a truly epic manner, and yes, the same is likely to take place in the following months, as markets wake up to the reality, which is that the USD Index and real interest rates are going up.
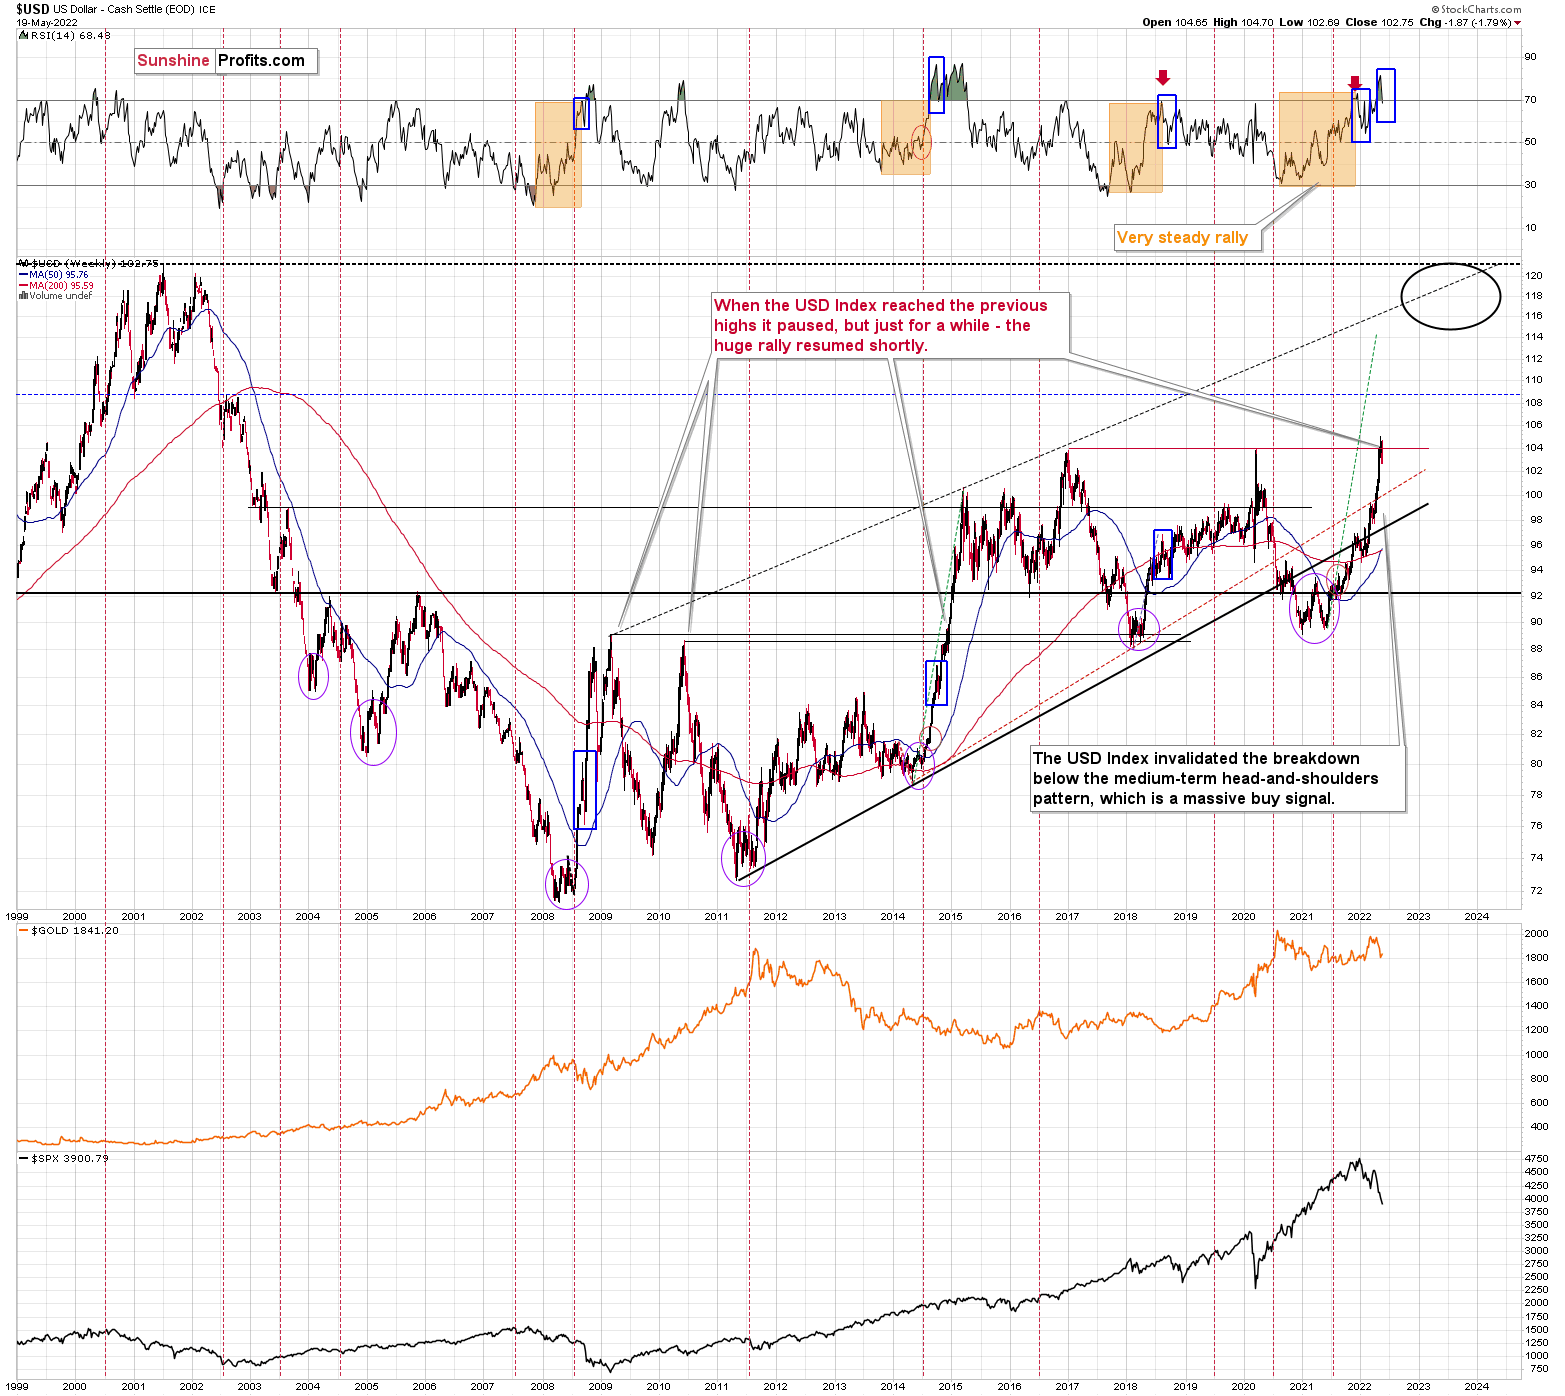
Speaking of the USD Index, after invalidating the breakout below the multi-year head-and-shoulders pattern, the USDX was poised to soar, just like I’ve been expecting it to do for more than a year, and that’s exactly what it did.
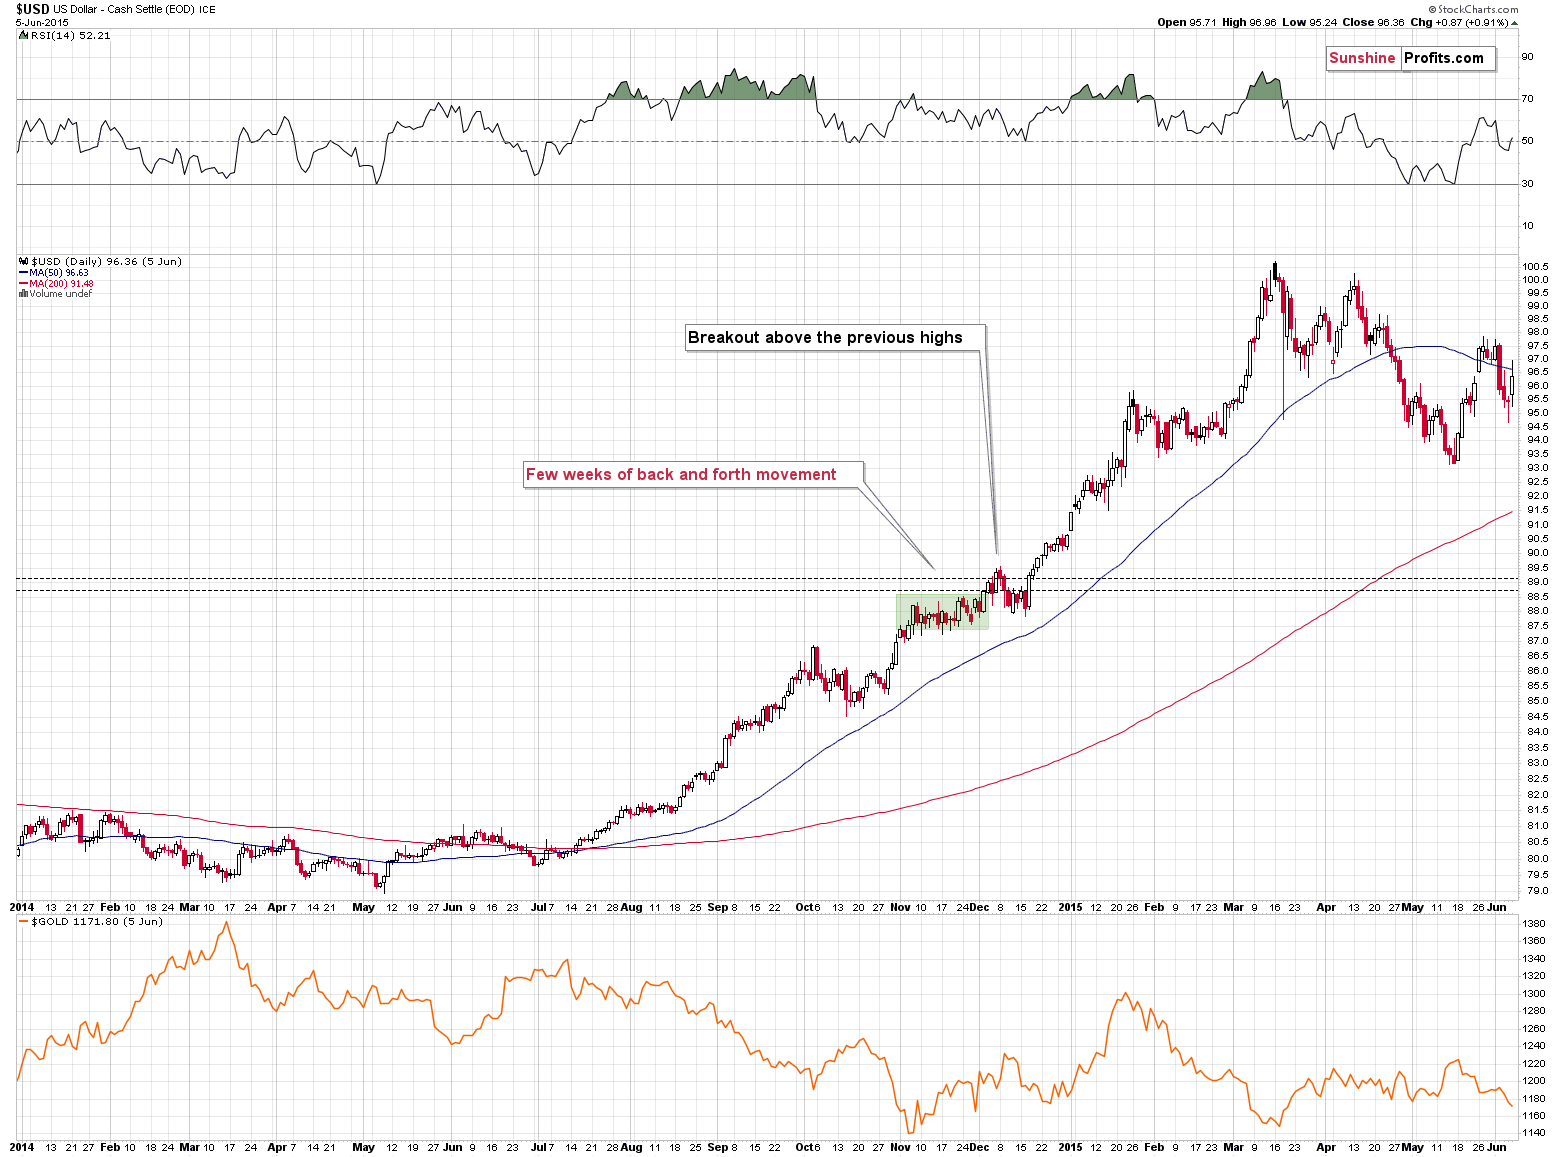
The RSI is currently slightly below 70, but since the USDX is in a medium-term rally and is already after a visible correction, it can rally further. Please note that we saw the same thing in 2008 and 2014. I marked the corrections with blue rectangles.
I previously commented on the USD Index in the following way:
The higher of the recent highs is at 103.96 right now, so if the analogy to 2014 is to remain intact, the USD Index could now top at close to 104.5 or even 105.
That’s exactly what happened recently. On Thursday, the USD Index moved to 104.96, and in Friday’s trading it rallied above 105 (to 105.065) and it invalidated the breakout above this level - which is in perfect tune with what I wrote above. Consequently, it seems that we could now see a move to about 103-103.5, after which USD’s rally could continue.
The opposite is likely to take place in the precious metals sector. Gold, silver, and mining stocks are likely to rally in the near term, and then – after topping at higher levels – their decline would continue.
Given the recent decline to 102.69, we see that the above has indeed taken place. The USDX moved slightly below my target range, but not enough to really invalidate it. The point was that the USD Index was likely to move back inside the previous consolidation pattern, just like what we saw in 2014. And that’s what is happening right now.
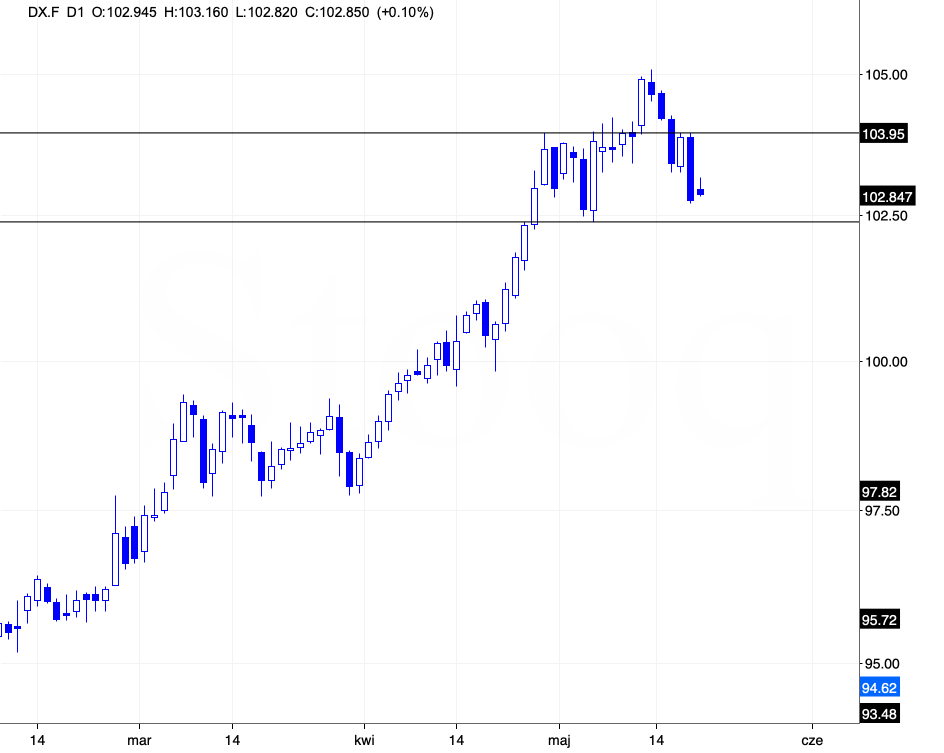
Consequently, it seems that the downside is rather limited in the near term, but I wouldn’t rule out a situation in which the USDX moves back and forth for several days before rallying – after all, that’s what happened in 2014.
Naturally, as always, I’ll keep you – my subscribers – informed.
Overview of the Upcoming Part of the Decline
- It seems to me that the short-term rally in the precious metals market is relatively close to being over, and if not, then at least the easy part of the long trade is getting close to being over.
- After the above-mentioned correction, we’re likely to see another big slide, perhaps close to the 2021 lows ($1,650 - $1,700).
- If we see a situation where miners slide in a meaningful and volatile way while silver doesn’t (it just declines moderately), I plan to – once again – switch from short positions in miners to short positions in silver. At this time, it’s too early to say at what price levels this could take place, and if we get this kind of opportunity at all – perhaps with gold close to $1,600.
- I plan to exit all remaining short positions once gold shows substantial strength relative to the USD Index while the latter is still rallying. This may be the case with gold close to $1,400. I expect silver to fall the hardest in the final part of the move. This moment (when gold performs very strongly against the rallying USD and miners are strong relative to gold after its substantial decline) is likely to be the best entry point for long-term investments, in my view. This can also happen with gold close to $1,400, but at the moment it’s too early to say with certainty.
- The above is based on the information available today, and it might change in the following days/weeks.
You will find my general overview of the outlook for gold on the chart below:
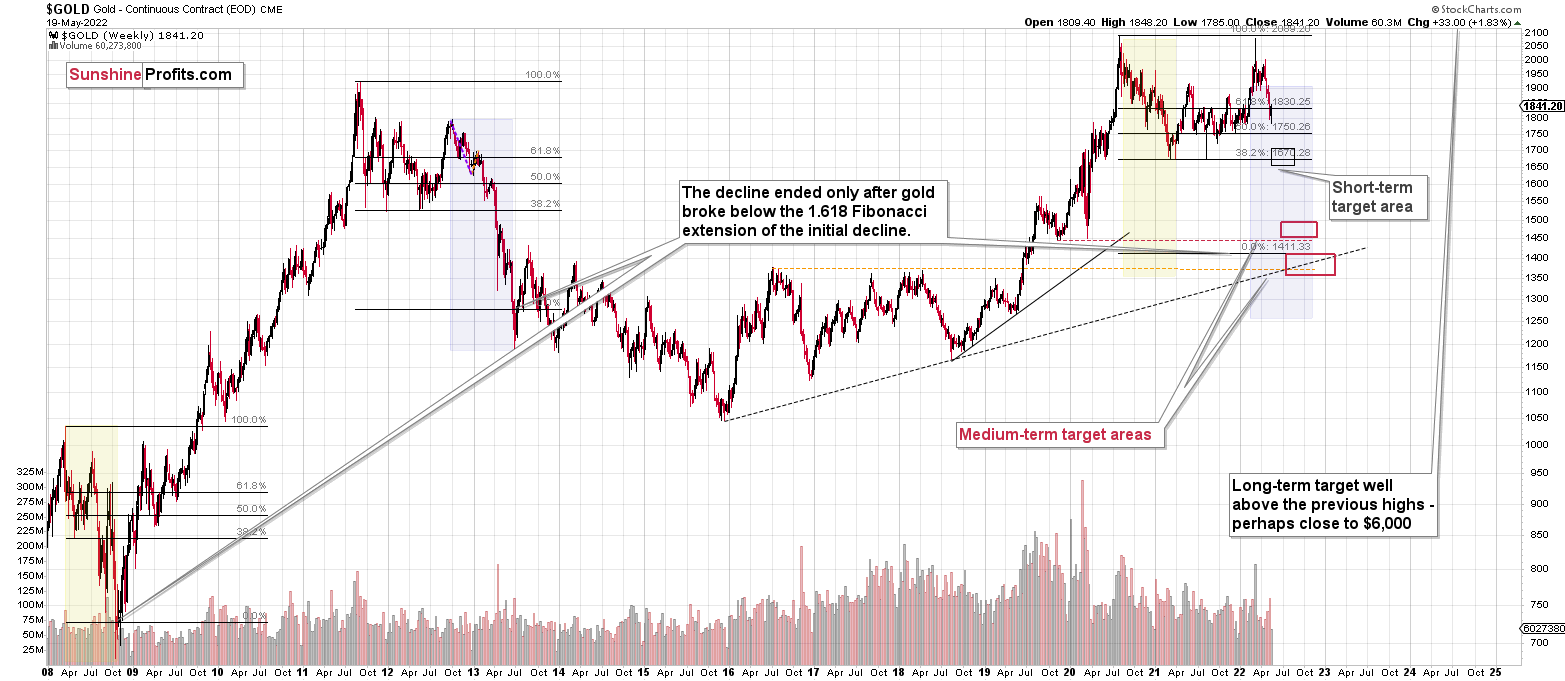
Please note that the above timing details are relatively broad and “for general overview only” – so that you know more or less what I think and how volatile I think the moves are likely to be – on an approximate basis. These time targets are not binding or clear enough for me to think that they should be used for purchasing options, warrants or similar instruments.
Letters to the Editor
Q: Good call on gold miners! Can you answer this for me? What percentage of my total portfolio should constitute the position? I manage 2 Rollovers and a Joint account. Let's say, to make things simple, that the total amount of all 3 accounts is $100,000. We have no debts.
A: Unfortunately, I can’t answer this for you. Much more details are required to provide an answer (willingness and ability to take risk, liquidity requirements, investment horizon, investment goal [capital appreciation, or maybe regular revenue stream, or mix], taxes, etc.), and providing it would be investment advice. I don’t know what would be appropriate for you, specifically. In this research report, you will find information that might help you determine it on your own, especially the parts close to the end in the “Position Sizes” and “Predefined Portfolios” sections.
One rule of thumb is – will taking a single position – and losing it – affect your sleep? If so, keep decreasing the position size until you can answer that it wouldn’t. Can you calmly NOT monitor the markets every hour or minute, checking how your portfolio is doing? If not, then the position might be too big.
Q: Which (short) ETFs for gold, silver and miners in the U.S. and CDN would you recommend for the upcoming reversal? Thank you kindly.
A: I’m making no investment recommendations, just my general opinions (not aimed at any specific individual). Simply shorting GDXJ might be a good idea for many investors / traders, and in case one seeks extra leverage, the JDST ETF might be a good idea.
Other ETFs that one might consider: GLD, SLV (for shorting), ZSL (leveraged for silver), HGD.TO (Canadian inverse leveraged gold stocks ETF), and HZD.TO (Canadian inverse 2x leveraged silver ETF).
Q: When the levels indicated are reached, for this corrective rebound, do you consider it appropriate to automatically move to bearish positions to follow the strategy? I really congratulate you on your successes.
A: In short, yes. And thank you!
Q: I hope you can give me some insight. I have my PM ETF set to the binding exit, and it looks like the SPX is going to jump today. Do you know how high it might go before it reverses downward again?
A: My best estimation is that the S&P 500 might move very close to its very recent high before declining again – as I wrote earlier today. I’m not as certain of this level as I am of the ones in junior mining stocks, though (and, of course, I’m not “certain” – it’s just that I think that they are likely to be reached).
Summary
Summing up, it seems to me that the short-term rally in the precious metals market is relatively close to being over, and if not, then at least the easy part of the long trade is getting close to being over. While our profits on this long trade have grown quickly, it seems that after they grow a bit more and the GDXJ reaches our target ($40.96), it might be a good idea to take them off the table and return to the short positions (300% of the regular position size) in the junior mining stocks (GDXJ).
As we’re now quite close to the exit level in the GDXJ, I’m re-calibrating the target for the JNUG, so it’s now slightly lower (this ETF provides 2x leverage for DAILY price moves, so it’s ultimate target depends on the path of the GDXJ, not just on its price, so it’s impossible to determine the target with 100% accuracy upfront). As the USD Index might be close to its bottom and the general stock market might not be far from its upside target, it seems to be a good idea to adjust targets for gold and silver as well by moving them lower.
The medium-term downtrend is likely to continue shortly (perhaps after a weekly or a few-day long correction). As investors are starting to wake up to reality, the precious metals sector (particularly junior mining stocks) is declining sharply. Here are the key aspects of the reality that market participants have ignored:
- rising real interest rates,
- rising USD Index values.
Both of the aforementioned are the two most important fundamental drivers of the gold price. Since neither the USD Index nor real interest rates are likely to stop rising anytime soon (especially now that inflation has become highly political), the gold price is likely to fall sooner or later. Given the analogy to 2012 in gold, silver, and mining stocks, “sooner” is the more likely outcome.
It seems that our profits from short positions are going to become truly epic in the coming months. And the profits from the current long position are likely to enhance them even further.
After the final sell-off (that takes gold to about $1,350-$1,500), I expect the precious metals to rally significantly. The final part of the decline might take as little as 1-5 weeks, so it's important to stay alert to any changes.
As always, we'll keep you – our subscribers – informed.
To summarize:
Trading capital (supplementary part of the portfolio; our opinion): Full speculative long positions (100% of the full position) in junior mining stocks are justified from the risk to reward point of view with the following binding exit profit-take price levels:
Mining stocks (price levels for the GDXJ ETF): binding profit-take exit price: $40.96; stop-loss: none (the volatility is too big to justify a stop-loss order in case of this particular trade)
Alternatively, if one seeks leverage, we’re providing the binding profit-take levels for the JNUG (2x leveraged). The binding profit-take level for the JNUG: $56.18; stop-loss for the JNUG: none (the volatility is too big to justify a SL order in case of this particular trade).
For-your-information targets (our opinion; we continue to think that mining stocks are the preferred way of taking advantage of the upcoming price move, but if for whatever reason one wants / has to use silver or gold for this trade, we are providing the details anyway.):
Silver futures upside profit-take exit price: $22.28
SLV profit-take exit price: $20.48
AGQ profit-take exit price: $29.96
Gold futures downside profit-take exit price: $1,909
HGU.TO – alternative (Canadian) 2x leveraged gold stocks ETF – the upside profit-take exit price: $17.28
HZU.TO – alternative (Canadian) 2x leveraged silver ETF – the upside profit-take exit price: $11.28
Long-term capital (core part of the portfolio; our opinion): No positions (in other words: cash
Insurance capital (core part of the portfolio; our opinion): Full position
Whether you already subscribed or not, we encourage you to find out how to make the most of our alerts and read our replies to the most common alert-and-gold-trading-related-questions.
Please note that we describe the situation for the day that the alert is posted in the trading section. In other words, if we are writing about a speculative position, it means that it is up-to-date on the day it was posted. We are also featuring the initial target prices to decide whether keeping a position on a given day is in tune with your approach (some moves are too small for medium-term traders, and some might appear too big for day-traders).
Additionally, you might want to read why our stop-loss orders are usually relatively far from the current price.
Please note that a full position doesn't mean using all of the capital for a given trade. You will find details on our thoughts on gold portfolio structuring in the Key Insights section on our website.
As a reminder - "initial target price" means exactly that - an "initial" one. It's not a price level at which we suggest closing positions. If this becomes the case (like it did in the previous trade), we will refer to these levels as levels of exit orders (exactly as we've done previously). Stop-loss levels, however, are naturally not "initial", but something that, in our opinion, might be entered as an order.
Since it is impossible to synchronize target prices and stop-loss levels for all the ETFs and ETNs with the main markets that we provide these levels for (gold, silver and mining stocks - the GDX ETF), the stop-loss levels and target prices for other ETNs and ETF (among other: UGL, GLL, AGQ, ZSL, NUGT, DUST, JNUG, JDST) are provided as supplementary, and not as "final". This means that if a stop-loss or a target level is reached for any of the "additional instruments" (GLL for instance), but not for the "main instrument" (gold in this case), we will view positions in both gold and GLL as still open and the stop-loss for GLL would have to be moved lower. On the other hand, if gold moves to a stop-loss level but GLL doesn't, then we will view both positions (in gold and GLL) as closed. In other words, since it's not possible to be 100% certain that each related instrument moves to a given level when the underlying instrument does, we can't provide levels that would be binding. The levels that we do provide are our best estimate of the levels that will correspond to the levels in the underlying assets, but it will be the underlying assets that one will need to focus on regarding the signs pointing to closing a given position or keeping it open. We might adjust the levels in the "additional instruments" without adjusting the levels in the "main instruments", which will simply mean that we have improved our estimation of these levels, not that we changed our outlook on the markets. We are already working on a tool that would update these levels daily for the most popular ETFs, ETNs and individual mining stocks.
Our preferred ways to invest in and to trade gold along with the reasoning can be found in the how to buy gold section. Furthermore, our preferred ETFs and ETNs can be found in our Gold & Silver ETF Ranking.
As a reminder, Gold & Silver Trading Alerts are posted before or on each trading day (we usually post them before the opening bell, but we don't promise doing that each day). If there's anything urgent, we will send you an additional small alert before posting the main one.
Thank you.
Przemyslaw Radomski, CFA
Founder, Editor-in-chief

