

Briefly: in our opinion, full (100% of the regular position size) speculative long positions in junior mining stocks are justified from the risk/reward point of view at the moment of publishing this Alert.
Precious metals declined yesterday, and so did the general stock market. Is the rally already over?
When I wrote about this rally on May 12, which took place at the same time when I took profits from the short positions and entered the long ones, I mentioned that I planned to hold these long positions for a week or two. Since that was exactly a week ago, the question is: is the top already in?
In short, it probably isn’t. As always, it’s useful to check what happened in the past in similar situations to verify whether what we see is normal or some kind of an outlier that cannot be explained by something that has already happened.
Let’s start with a quote from yesterday’s analysis:
Of course, there will be some back-and-forth movement on an intraday basis, but it doesn’t change anything. Junior miners are likely to rally this week nonetheless. And perhaps not longer than that, as the next triangle-vertex-based reversal is just around the corner – on Friday/Monday.
The previous few days were the “forth” and yesterday was the “back” movement – so far, my comments remain up-to-date. However, comparing the market action with what I wrote previously isn’t what I meant by analogies to past situations. I meant this:
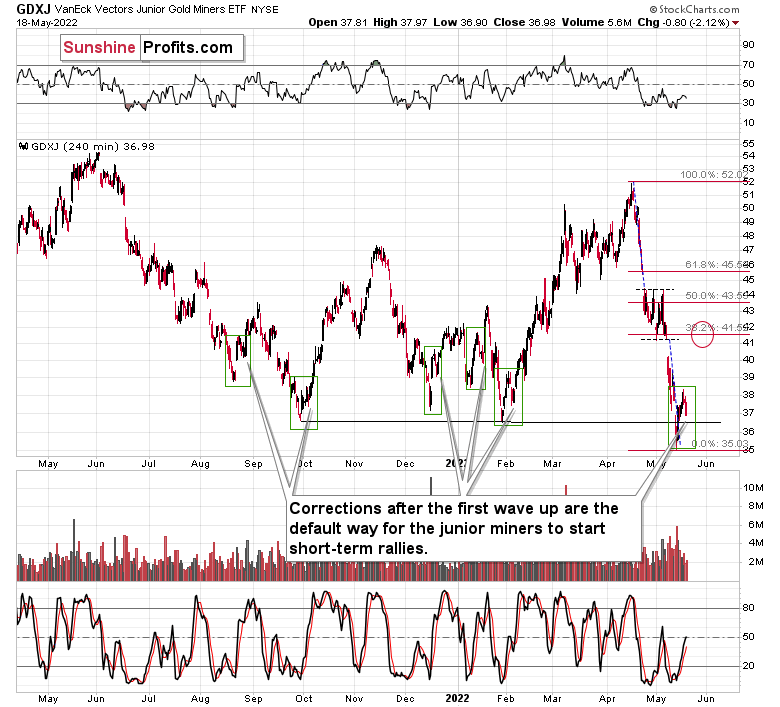
The areas marked with green rectangles are the starting moments of the previous short-term rallies. Some were bigger than others, and yet they all had one thing in common. They all included a corrective downswing after the initial post-bottom rally.
Consequently, what we saw yesterday couldn’t be more normal during a short-term rally. This means that yesterday’s decline is not bearish at all and the profits from our long positions are likely to increase in the following days.
Besides, the general stock market declined by over 4%, while the GDXJ (normally moving more than stocks) ETF – a proxy for junior mining stocks – declined by only about 2%.
If the general stock market continues to decline, junior miners could get a bearish push even if gold prices don’t decline.
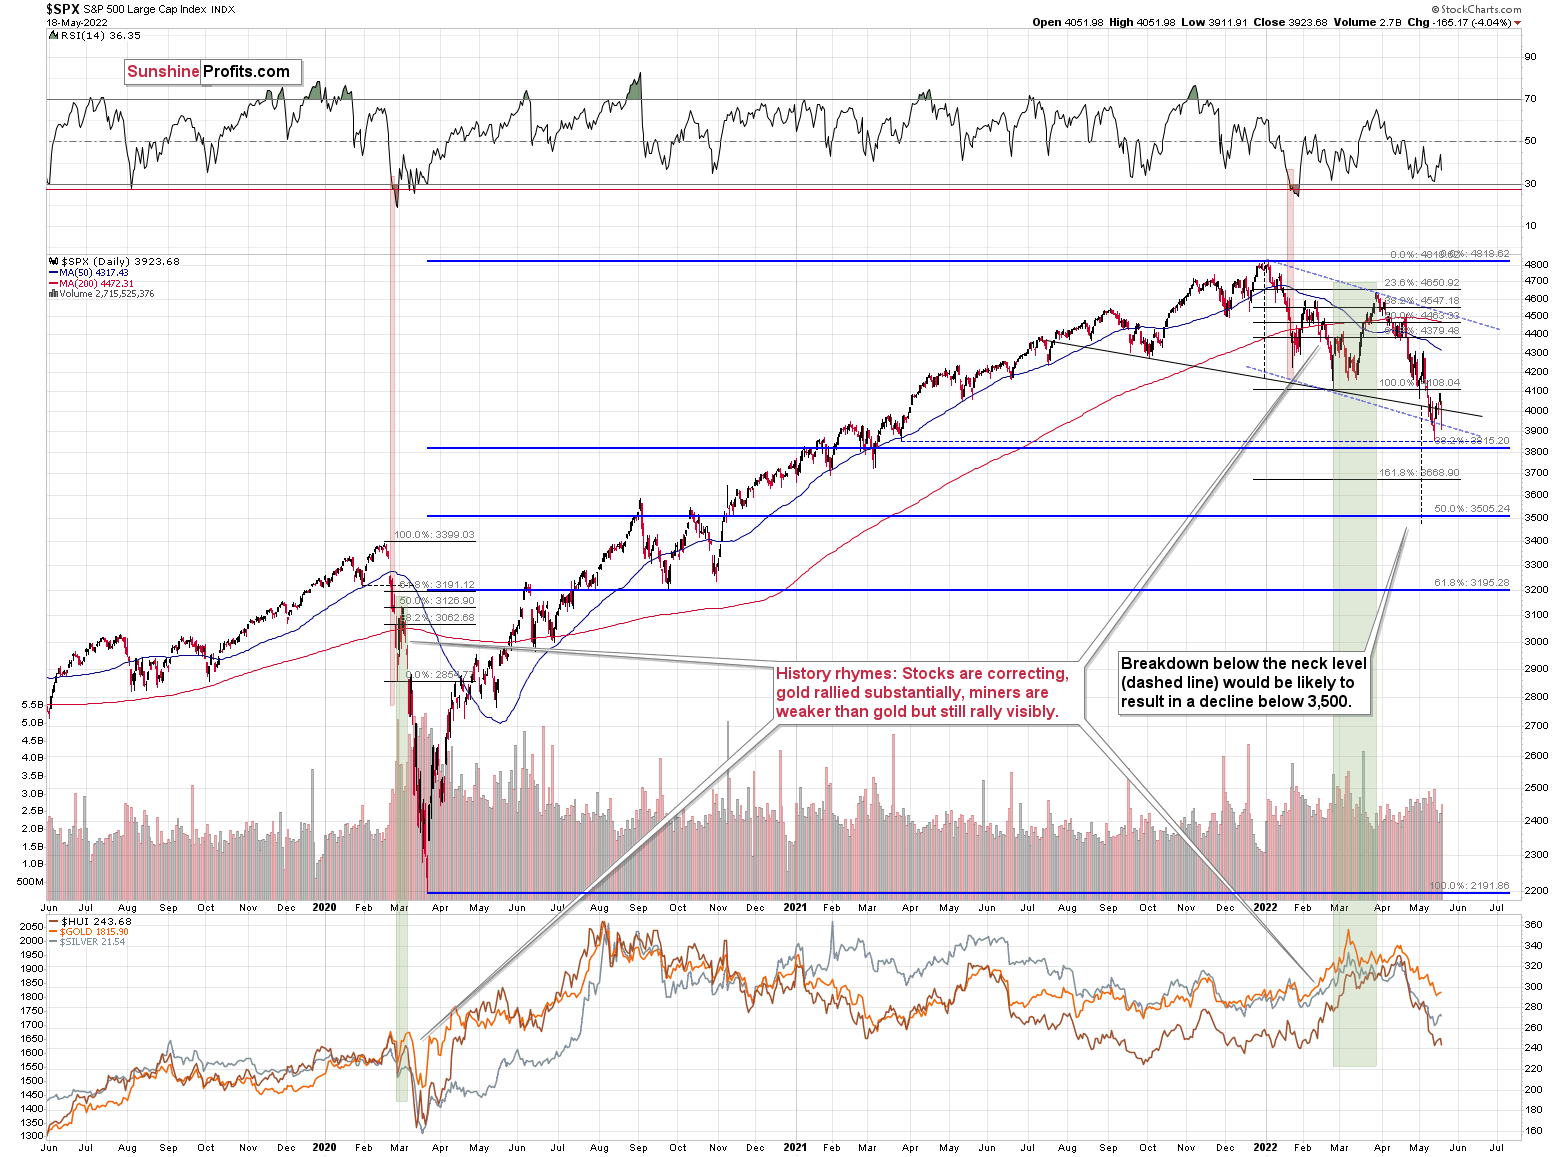
However, let’s keep in mind the fact that miners tend to bottom before stocks do – in fact, we saw that in early 2020. This means that even if the S&P 500 moves to new yearly lows shortly and then bounces back up, the downside for miners could be limited, and the stocks’ rebound could trigger a profound immediate-term rally.
If stocks decline, then they have quite strong support at about 3815 – at their 38.2% Fibonacci retracement level.
Let’s keep in mind that junior miners have triangle-vertex-based reversal over the weekend, so they might form some kind of reversal on Friday or Monday.
Ideally, miners would be after a quick rally that is accompanied by huge volume on Friday. This would serve as a perfect confirmation that the top is in or at hand.
However, we can’t tell the market what it should do – we can only respond to what it does and position ourselves accordingly. Consequently, if stocks take miners lower, it could be the case that Friday or Monday will be the time when they bottom. This seems less likely to me than the previous (short-term bullish) scenario, but I’m prepared for it as well. In this case, we’ll simply… wait. Unless we see some major bearish indications, we will wait for the rally to end, perhaps sometime next week.
Again, a nearby top appears more likely than another bottom, in particular in light of what I wrote about the common post-bottom patterns in the GDXJ.
Naturally, as always, I’ll keep my subscribers informed.
Having said that, let’s take a look at the markets from a fundamental point of view.
The Chorus Continues
While investors still struggle with the notion that the Fed can’t bail them out amid soaring inflation, the S&P 500 and the NASDAQ Composite suffered another reality check on May 18. Moreover, with Fed officials continuing to spread their hawkish gospel, I warned on Apr. 6 that demand destruction does not support higher asset prices. I wrote:
Please remember that the Fed needs to slow the U.S. economy to calm inflation, and rising asset prices are mutually exclusive to this goal. Therefore, officials should keep hammering the financial markets until investors finally get the message.
Moreover, with the Fed in inflation-fighting mode and reformed doves warning that the U.S. economy “could teeter” as the drama unfolds, the reality is that there is no easy solution to the Fed’s problem. To calm inflation, it has to kill demand. And as that occurs, investors should suffer a severe crisis of confidence.
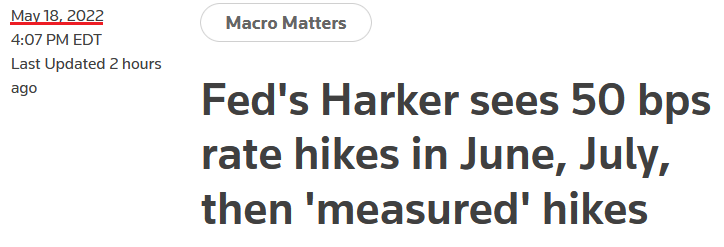
To that point, while the S&P 500 and the NASDAQ Composite plunged on May 18, Fed officials didn't soften their tones. For example, Philadelphia Fed President Patrick Harker said:
"Going forward, if there are no significant changes in the data in the coming weeks, I expect two additional 50 basis point rate hikes in June and July. After that, I anticipate a sequence of increases in the funds rate at a measured pace until we are confident that inflation is moving toward the Committee’s inflation target."
For context, "measured" rate hikes imply quarter-point increments thereafter.
Please see below:
 Source: Reuters
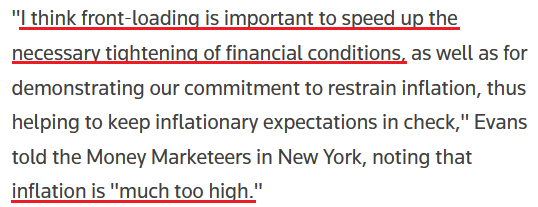
Likewise, Chicago Fed President Charles Evans delivered a similar message on May 17. He said that by December, "we will have completed any 50 [basis point rate hikes] and have put in place at least a few 25 [basis point rate hikes]."
Moreover, "given the current strength in aggregate demand, strong demand for workers, and the supply-side improvements that I expect to be coming,” he added that “I believe a modestly restrictive stance will still be consistent with a growing economy."
Therefore, while their recent rhetoric had Fed officials “expeditiously” marching toward neutral, now the prospect of a “restrictive stance” has entered the equation. For context, a neutral rate neither stimulates nor suffocates the U.S. economy. However, when the federal funds rate rises above neutral (restrictive), the goal is to materially slow economic activity and consumer spending. As such, the medium-term liquidity drain is profoundly bearish for the S&P 500 and the PMs.
Please see below:
 Source: Reuters
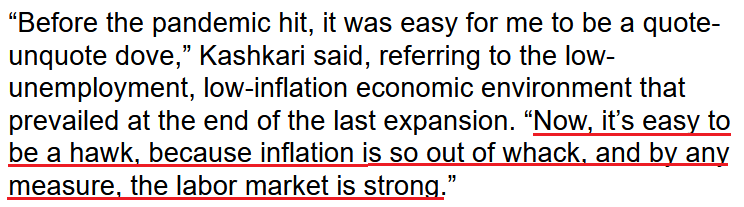
Making three of a kind, Minneapolis Fed President Neel Kashkari (a reformed dove) said on May 17 that “My colleagues and I are going to do what we need to do to bring the economy back into balance…”
“What a lot of economists are scratching their heads and wondering about is: if we really have to bring demand down to get inflation in check, is that going to put the economy into recession? And we don’t know.”
For context, Fed officials initially thought inflation was “transitory,” so don’t hold your breath waiting for that “soft landing.” However, while Kashkari is ~16 months too late to the inflation party, he acknowledged the reality on May 17:
 Source: Bloomberg
As a result, while the S&P 500 and the NASDAQ Composite sell-off in their search for medium-term support, Fed officials haven’t flinched in their hawkish crusade. As such, I’ve long warned that Americans’ living standards take precedence over market multiples.
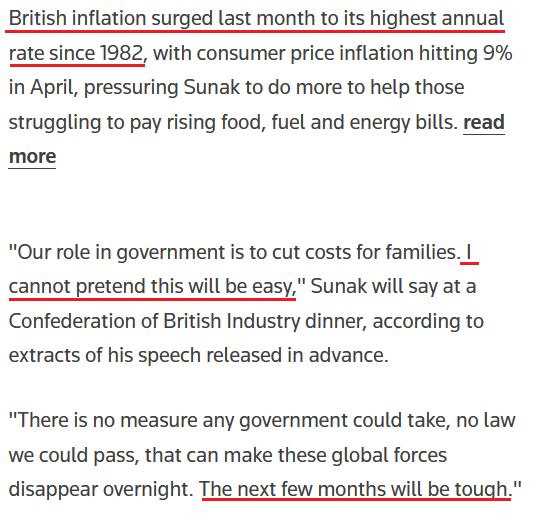
To that point, the U.K. headline Consumer Price Index (CPI) hit 9% year-over-year (YoY) on May 18. For the sake of objectivity, the results underperformed economists’ consensus estimates (the middle column below).
 Source: Investing.com
However, while investors may take solace in the miss, they should focus on the fact that the U.K. output Producer Price Index (PPI) materially outperformed expectations and often leads the headline CPI. As a result, the inflation story is much more troublesome than it seems on the surface.
Please see below:
 Source: Investing.com
In addition, British Finance Minister Rishi Sunak warned of a cost of living crisis on May 18, saying that “as the situation evolves our response will evolve” and “we stand ready to do more.”
Please see below:
 Source: Reuters
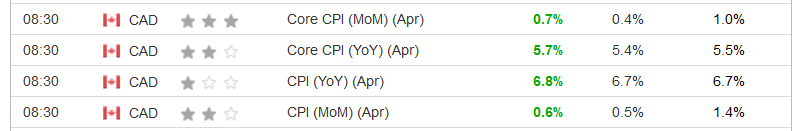
Even more revealing, I’ve noted on numerous occasions that Canada is the best comparison to the U.S. due to its geographical proximity and its reliance on the U.S. to purchase Canadian exports. Therefore, with Canadian inflation outperforming across the board on May 18, the data paints an ominous portrait of the challenges confronting North American central banks.
Please see below:
 Source: Investing.com
To that point, the official report stated:
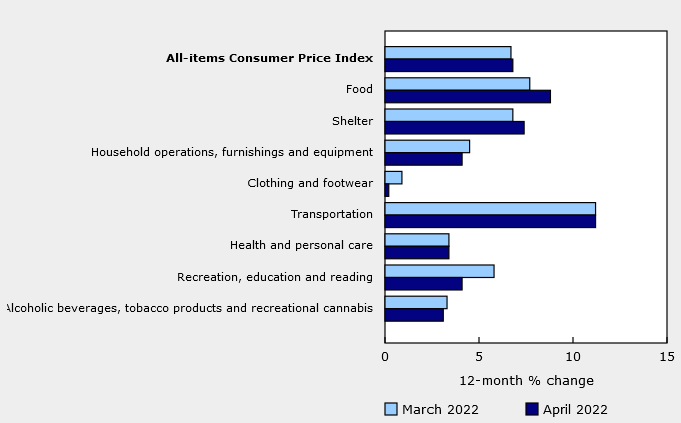
“Canadians paid 9.7% more in April for food purchased from stores compared with April 2021. This increase, which exceeded 5% for the fifth month in a row, was the largest increase since September 1981. For comparison, from 2010 to 2020, there were five months when prices for food purchased from stores increased at a rate of 5% or higher….
“Basics, such as fresh fruit (+10.0%), fresh vegetables (+8.2%) and meat (+10.1%), were all more expensive in April compared with a year earlier. Prices for starchy foods such as bread (+12.2%), pasta (+19.6%), rice (+7.4%) and cereal products (+13.9%) also increased. Additionally, a cup of coffee (+13.7%) cost more in April 2022 than in April 2021.”
Moreover, “in April, shelter costs rose 7.4% year over year, the fastest pace since June 1983, following a 6.8% increase in March.” Therefore, the data is nearly synonymous with the U.S., and I’ve been warning for months that rent inflation would prove much stickier than investors expected.
Please see below:
 Source: Statistics Canada
Finally, the investors awaiting a dovish pivot from the Fed assume that growth will overpower inflation. In a nutshell: the U.S. economy will sink into a deep recession in the next couple of months (some believe that we are already in one), and the Fed will resume QE. Moreover, they assume that the inflationary backdrop has left consumers destitute and that we’re a quarter away from famine.
However, I couldn’t disagree more. With Home Depot – which primarily sells discretionary items – noting that consumers are showing no signs of slowing down, I warned on May 18 that investors don’t realize that the Fed’s war with inflation would be one of attrition.
Please see below:
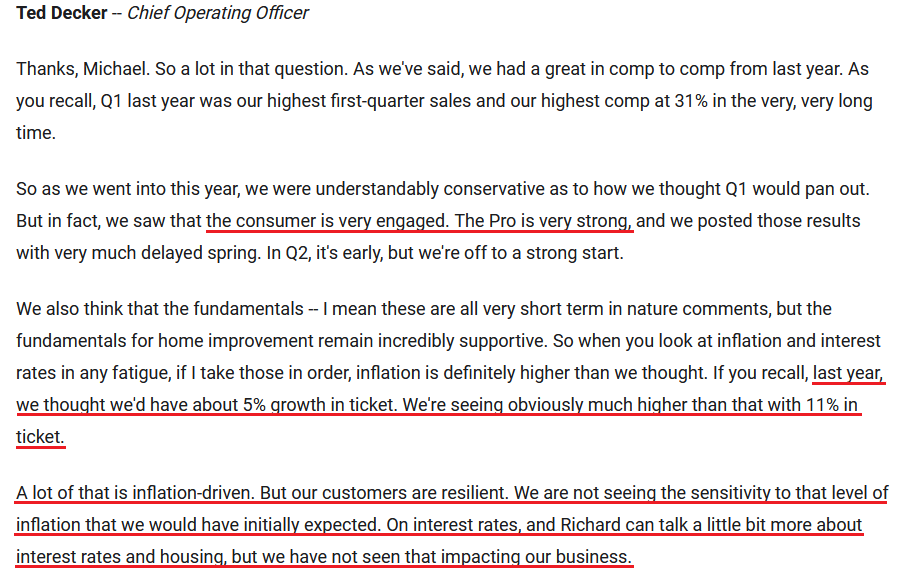 Source: Home Depot/The Motley Fool
For context, the National Retail Federation (NRF) listed Home Depot as the fourth-largest retailer in the U.S. in its 2021 report. As a result, the company's performance is a reliable indicator of U.S. consumer spending.
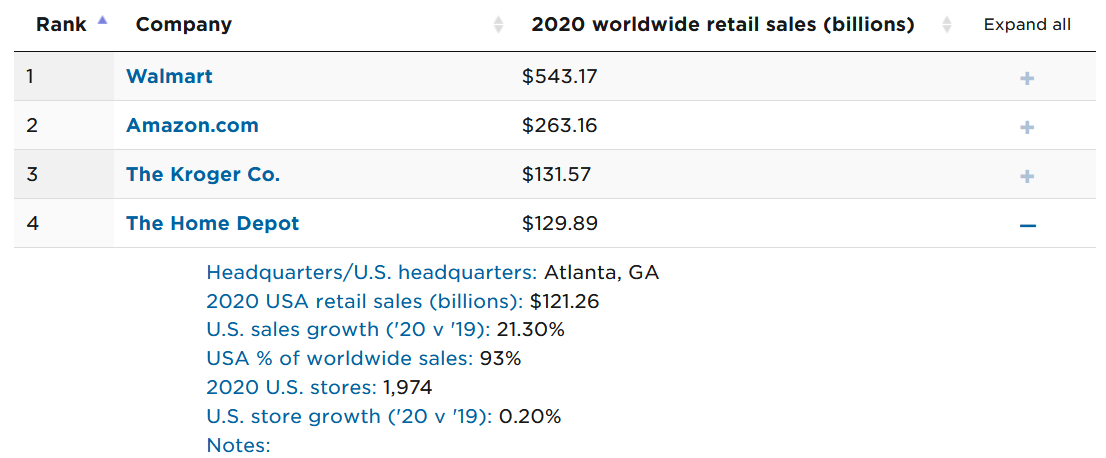 Source: NRF
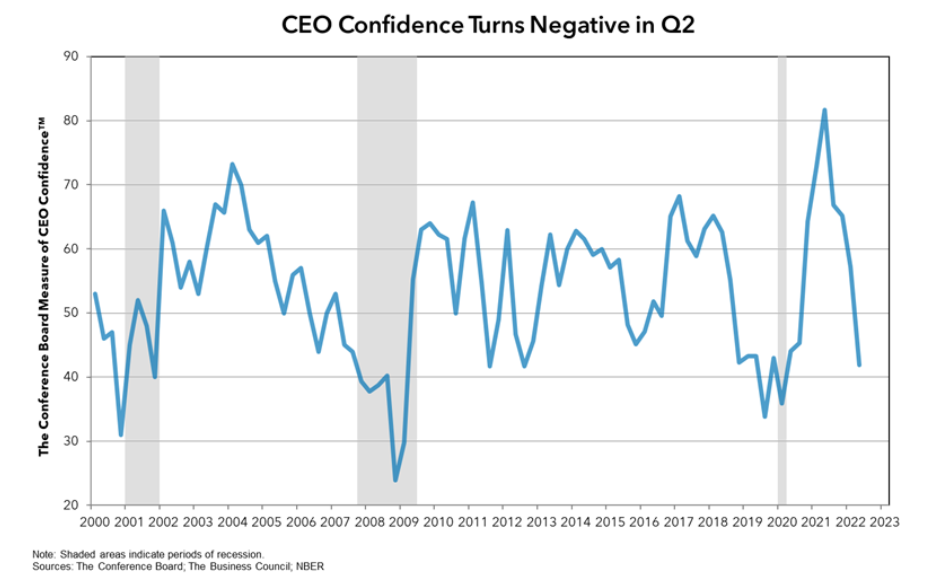
To that point, The Confidence Board released its U.S. CEO Confidence survey on May 18. The report revealed:
CEO confidence “declined for the fourth consecutive quarter in Q2 2022. The measure now stands at 42, down from 57 in Q1. The measure has fallen into negative territory and is at levels not seen since the onset of the pandemic. (A reading below 50 points reflects more negative than positive responses.)”
Please see below:
However, the devil is in the details and the details are what matter to the Fed. For example:
“More than half (54%) of CEOs said they were effectively managing rising input costs by passing along costs to customers, while 13% said they had no major issues with input costs.”
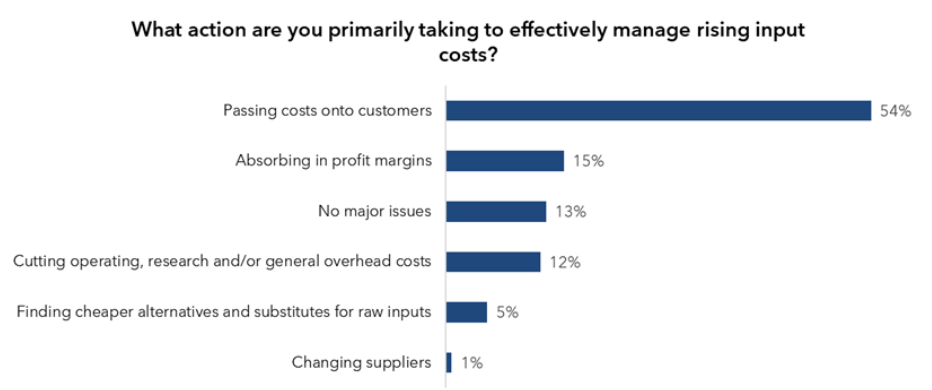 Source: The Confidence Board
Second:
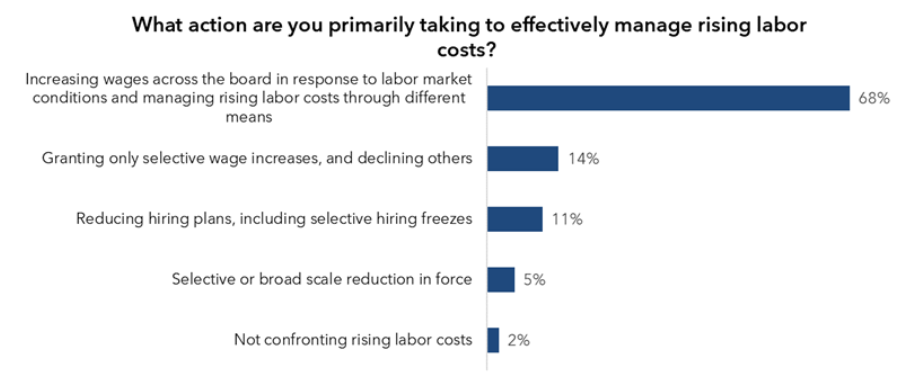
“More than two-thirds of CEOs said they are increasing wages across the board in response to labor market conditions and managing rising labor costs through different means.”
 Source: The Confidence Board
More importantly, though:
 Source: The Confidence Board
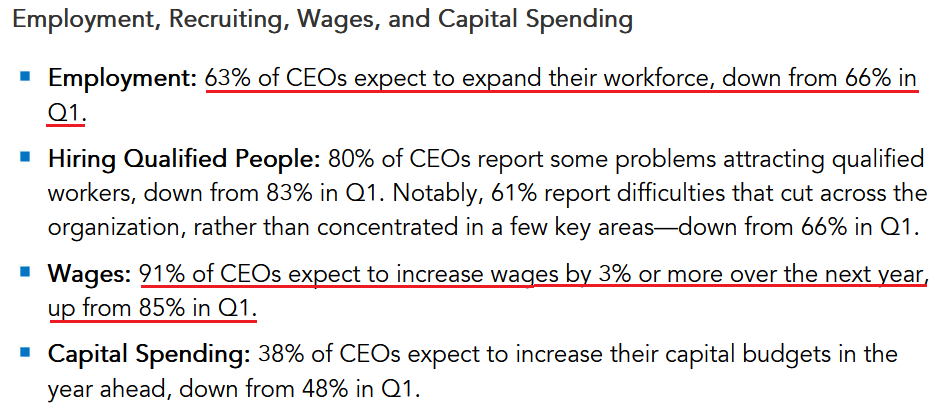
Therefore, while consolidated CEO confidence has crashed to “levels not seen since the onset of the pandemic,” nearly two-thirds of CEOs plan to increase their workforce and more than nine out of 10 plan to increase wages. As a result, would major U.S. corporations be adding employees and paying them more if demand has fallen off a cliff? Of course not. Moreover, when considering the 15-point drop in consolidated CEO confidence, the three-point decline in employment expectations is largely immaterial.
The bottom line? While investors keep using the post-GFC script as their roadmap for when the Fed turns dovish, they don’t realize that 1970s/1980s-like inflation is a completely different animal. Thus, what I wrote on May 18 should prove prescient in the coming months:
While Powell keeps warning investors of what’s to come, a decade of dovish pivots has a generation of investors believing that the central bank is all talk and no action. However, with inflation at levels unseen in 40+ years, Powell is not out of ammunition, and the Fed followers should suffer profound disappointment as the drama unfolds.
In conclusion, the PMs declined on May 18, as risk-off sentiment returned to the financial markets. However, since fits and starts are always expected along the way, the GDXJ ETF should have more upside in the coming days, and profits from our long position should increase. The medium-term outlook for the mining stocks remains bearish, though.
Overview of the Upcoming Part of the Decline
- It seems to me that the short-term decline in the precious metals market is over and we’re currently seeing a rebound.
- After the above-mentioned correction, we’re likely to see another big slide, perhaps close to the 2021 lows ($1,650 - $1,700).
- If we see a situation where miners slide in a meaningful and volatile way while silver doesn’t (it just declines moderately), I plan to – once again – switch from short positions in miners to short positions in silver. At this time, it’s too early to say at what price levels this could take place, and if we get this kind of opportunity at all – perhaps with gold close to $1,600.
- I plan to exit all remaining short positions once gold shows substantial strength relative to the USD Index while the latter is still rallying. This may be the case with gold close to $1,400. I expect silver to fall the hardest in the final part of the move. This moment (when gold performs very strongly against the rallying USD and miners are strong relative to gold after its substantial decline) is likely to be the best entry point for long-term investments, in my view. This can also happen with gold close to $1,400, but at the moment it’s too early to say with certainty.
- The above is based on the information available today, and it might change in the following days/weeks.
You will find my general overview of the outlook for gold on the chart below:
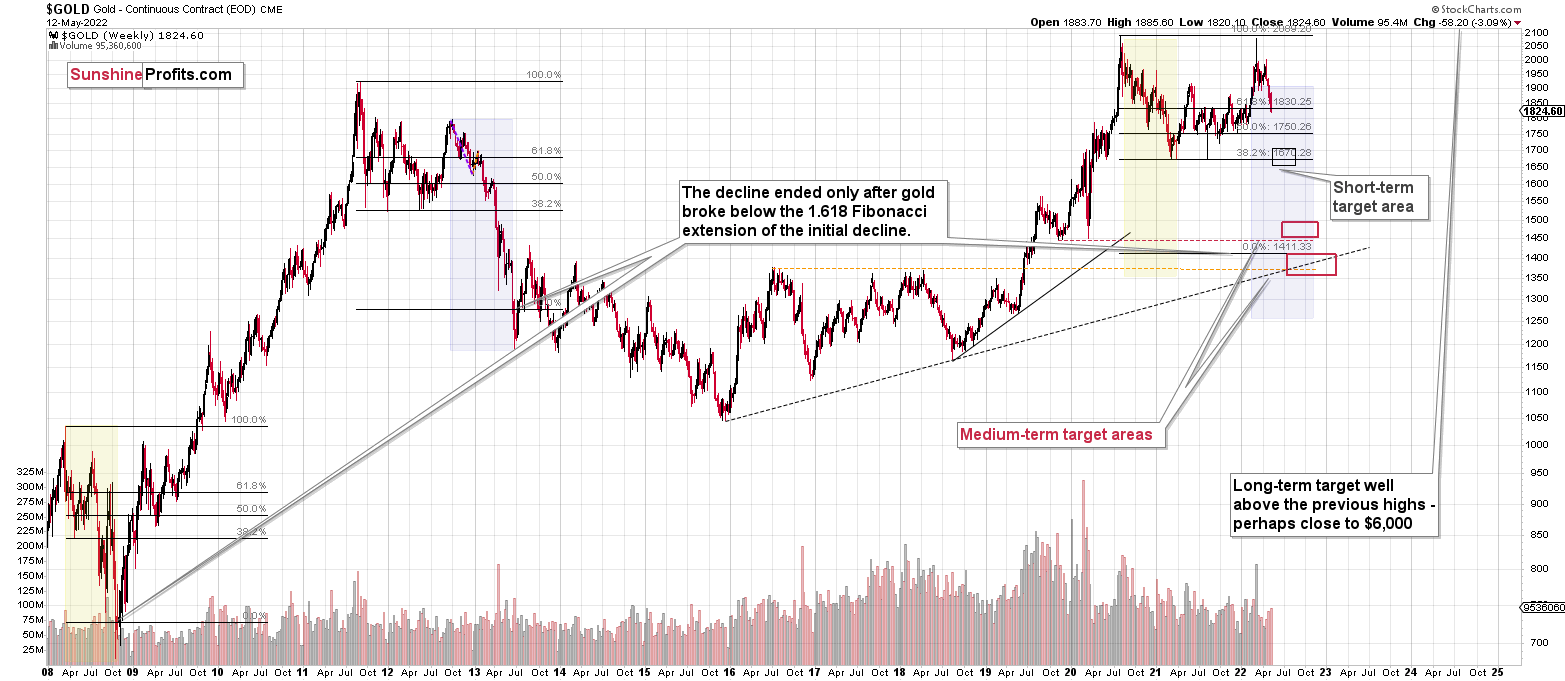
Please note that the above timing details are relatively broad and “for general overview only” – so that you know more or less what I think and how volatile I think the moves are likely to be – on an approximate basis. These time targets are not binding or clear enough for me to think that they should be used for purchasing options, warrants or similar instruments.
Summary
Summing up, it seems that we are about to see a short-term corrective upswing in the precious metals sector (perhaps before the end of this week), even though the medium-term trend remains clearly down.
The medium-term downtrend is likely to continue shortly (perhaps after a weekly or a few-day long correction). As investors are starting to wake up to reality, the precious metals sector (particularly junior mining stocks) is declining sharply. Here are the key aspects of the reality that market participants have ignored:
- rising real interest rates,
- rising USD Index values.
Both of the aforementioned are the two most important fundamental drivers of the gold price. Since neither the USD Index nor real interest rates are likely to stop rising anytime soon (especially now that inflation has become highly political), the gold price is likely to fall sooner or later. Given the analogy to 2012 in gold, silver, and mining stocks, “sooner” is the more likely outcome.
It seems that our profits from short positions are going to become truly epic in the coming months. And the profits from the current long position are likely to enhance them even further.
After the final sell-off (that takes gold to about $1,350-$1,500), I expect the precious metals to rally significantly. The final part of the decline might take as little as 1-5 weeks, so it's important to stay alert to any changes.
As always, we'll keep you – our subscribers – informed.
To summarize:
Trading capital (supplementary part of the portfolio; our opinion): Full speculative long positions (100% of the full position) in junior mining stocks are justified from the risk to reward point of view with the following binding exit profit-take price levels:
Mining stocks (price levels for the GDXJ ETF): binding profit-take exit price: $40.96; stop-loss: none (the volatility is too big to justify a stop-loss order in case of this particular trade)
Alternatively, if one seeks leverage, we’re providing the binding profit-take levels for the JNUG (2x leveraged). The binding profit-take level for the JNUG: $56.68; stop-loss for the JNUG: none (the volatility is too big to justify a SL order in case of this particular trade).
For-your-information targets (our opinion; we continue to think that mining stocks are the preferred way of taking advantage of the upcoming price move, but if for whatever reason one wants / has to use silver or gold for this trade, we are providing the details anyway.):
Silver futures downside profit-take exit price: $22.88
SLV profit-take exit price: $21.28
AGQ profit-take exit price: $32.18
Gold futures downside profit-take exit price: $1,909
HGU.TO – alternative (Canadian) 2x leveraged gold stocks ETF – the upside profit-take exit price: $19.68
HZU.TO – alternative (Canadian) 2x leveraged silver ETF – the upside profit-take exit price: $12.09
Long-term capital (core part of the portfolio; our opinion): No positions (in other words: cash
Insurance capital (core part of the portfolio; our opinion): Full position
Whether you already subscribed or not, we encourage you to find out how to make the most of our alerts and read our replies to the most common alert-and-gold-trading-related-questions.
Please note that we describe the situation for the day that the alert is posted in the trading section. In other words, if we are writing about a speculative position, it means that it is up-to-date on the day it was posted. We are also featuring the initial target prices to decide whether keeping a position on a given day is in tune with your approach (some moves are too small for medium-term traders, and some might appear too big for day-traders).
Additionally, you might want to read why our stop-loss orders are usually relatively far from the current price.
Please note that a full position doesn't mean using all of the capital for a given trade. You will find details on our thoughts on gold portfolio structuring in the Key Insights section on our website.
As a reminder - "initial target price" means exactly that - an "initial" one. It's not a price level at which we suggest closing positions. If this becomes the case (like it did in the previous trade), we will refer to these levels as levels of exit orders (exactly as we've done previously). Stop-loss levels, however, are naturally not "initial", but something that, in our opinion, might be entered as an order.
Since it is impossible to synchronize target prices and stop-loss levels for all the ETFs and ETNs with the main markets that we provide these levels for (gold, silver and mining stocks - the GDX ETF), the stop-loss levels and target prices for other ETNs and ETF (among other: UGL, GLL, AGQ, ZSL, NUGT, DUST, JNUG, JDST) are provided as supplementary, and not as "final". This means that if a stop-loss or a target level is reached for any of the "additional instruments" (GLL for instance), but not for the "main instrument" (gold in this case), we will view positions in both gold and GLL as still open and the stop-loss for GLL would have to be moved lower. On the other hand, if gold moves to a stop-loss level but GLL doesn't, then we will view both positions (in gold and GLL) as closed. In other words, since it's not possible to be 100% certain that each related instrument moves to a given level when the underlying instrument does, we can't provide levels that would be binding. The levels that we do provide are our best estimate of the levels that will correspond to the levels in the underlying assets, but it will be the underlying assets that one will need to focus on regarding the signs pointing to closing a given position or keeping it open. We might adjust the levels in the "additional instruments" without adjusting the levels in the "main instruments", which will simply mean that we have improved our estimation of these levels, not that we changed our outlook on the markets. We are already working on a tool that would update these levels daily for the most popular ETFs, ETNs and individual mining stocks.
Our preferred ways to invest in and to trade gold along with the reasoning can be found in the how to buy gold section. Furthermore, our preferred ETFs and ETNs can be found in our Gold & Silver ETF Ranking.
As a reminder, Gold & Silver Trading Alerts are posted before or on each trading day (we usually post them before the opening bell, but we don't promise doing that each day). If there's anything urgent, we will send you an additional small alert before posting the main one.
Thank you.
Przemyslaw Radomski, CFA
Founder, Editor-in-chief

