

Briefly: in our opinion, full (300% of the regular position size) speculative short positions in junior mining stocks are justified from the risk/reward point of view at the moment of publishing this Alert.
The precious metals corrected some of their gains yesterday, but overall, not much changed in them. However, quite a lot happened in crude oil, and in today’s analysis we’ll focus on what it implies for the precious metals market and, in particular – for mining stocks.
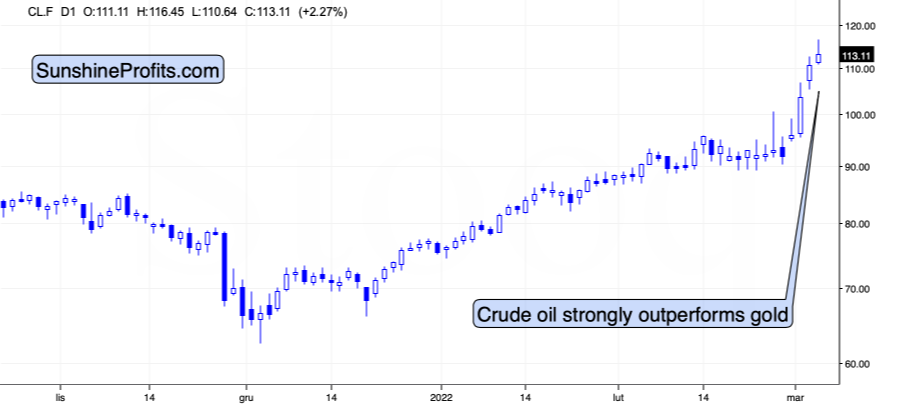
As you may have noticed, crude oil shot up recently in a spectacular manner. This seems normal, as it’s a market with rather inflexible supply and demand, so disruptions in supply or threats thereof can impact the price in a substantial way. With Russia as one of the biggest crude oil producers, its invasion of Ukraine, and a number of sanctions imposed on the attacking country (some of them involving oil directly), it’s natural that crude oil reacts in a certain manner. The concern-based rally in gold is also understandable.
However, the relationship between wars, concerns, and prices of assets is not as straightforward as “there’s a war, so gold and crude oil will go up.” In order to learn more about this relationship, let’s examine the most similar situation in recent history to the current one, when oil supplies were at stake.
The war that I’m mentioning is the one between Iraq and the U.S. that started almost 20 years ago. Let’s see what happened in gold, oil, and gold stocks at that time.
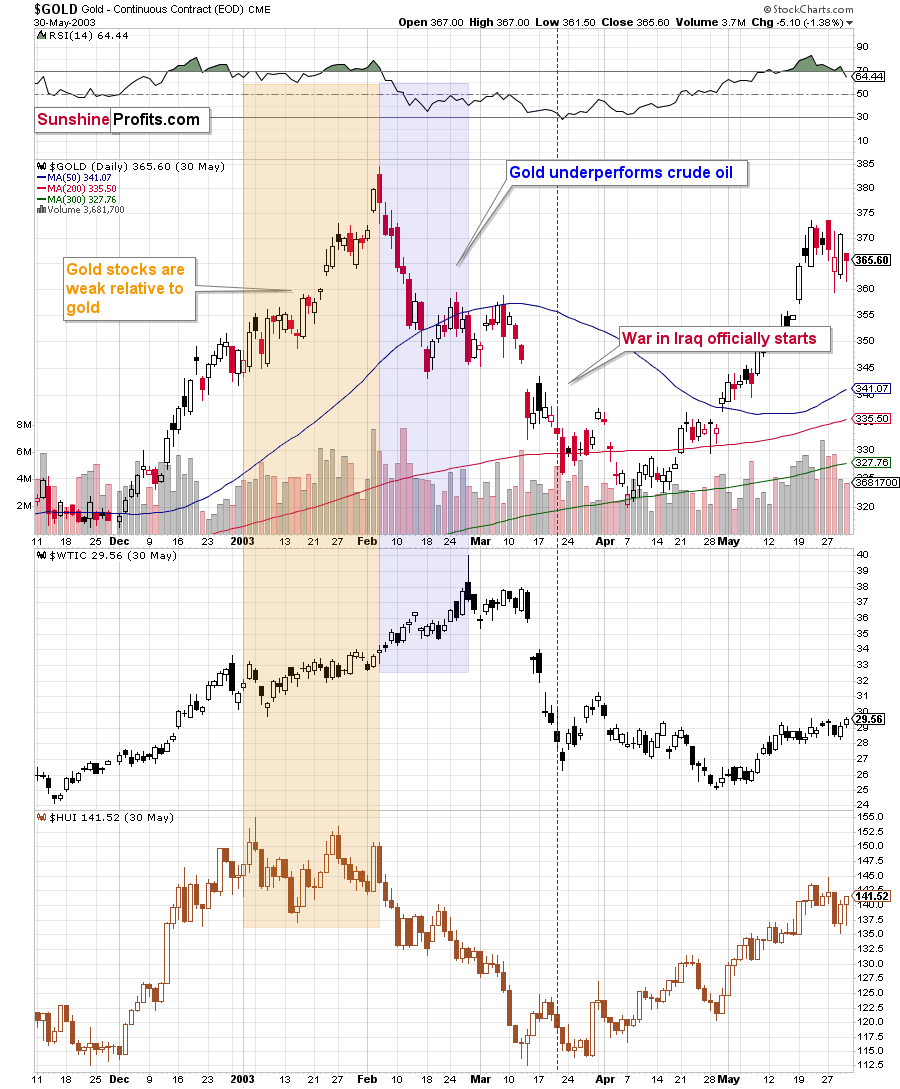
The most interesting thing is that when the war officially started, the above-mentioned markets were already after a decline. However, that’s not that odd, when one considers the fact that back then, the tensions were building for a long time, and it was relatively clear in advance that the U.S. attack was going to happen. This time, Russia claimed that it wouldn’t attack until the very last minute before the invasion.
The point here, however, is that the markets rallied while the uncertainty and concerns were building up, and then declined when the situation was known and “stable.” I don’t mean that “war” was seen as stable, but rather that the outcome and how it affected the markets was rather obvious.
The other point is the specific way in which all three markets reacted to the war and the timing thereof.
Gold stocks rallied initially, but then were not that eager to follow gold higher, but that’s something that’s universal in the final stages of most rallies in the precious metals market. What’s most interesting here is that there was a time when crude oil rallied substantially, while gold was already declining.
Let me emphasize that once again: gold topped first, and then it underperformed while crude oil continued to soar substantially.
Fast forward to the current situation. What has happened recently?
Gold moved above $1,970 (crude oil peaked at $100.54 at that time), and then it declined heavily. It’s now trying to move back to this intraday high, but it was not able to do so. At the moment of writing these words, gold is trading at about $1,930, while crude oil is trading at about $114.
In other words, while gold declined by $30, crude oil rallied by about $14. That’s a repeat of what we saw in 2003!
What happened next in 2003? Gold declined, and the moment when crude oil started to visibly outperform gold was also the beginning of a big decline in gold stocks.
That makes perfect sense on the fundamental level too. Gold miners’ share prices depend on their profits (just like it’s the case with any other company). Crude oil at higher levels means higher costs for the miners (the machinery has to be fueled, the equipment has to be transported, etc.). When costs (crude oil could be viewed as a proxy for them) are rising faster than revenues (gold could be viewed as a proxy for them), miners’ profits appear to be in danger; and investors don’t like this kind of danger, so they sell shares. Of course, there are many more factors that need to be taken into account, but I just wanted to emphasize one way in which the above-mentioned technical phenomenon is justified. The above doesn’t apply to silver as it’s a commodity, but it does apply to silver stocks.
Back in 2004, gold stocks wiped out their entire war-concern-based rally, and the biggest part of the decline took just a bit more than a month. Let’s remember that back then, gold stocks were in a very strong medium- and long-term uptrend. Right now, mining stocks remain in a medium-term downtrend, so their decline could be bigger – they could give away their war-concern-based gains and then decline much more.
Mining stocks are not declining profoundly yet, but let’s keep in mind that history rhymes – it doesn’t repeat to the letter. As I emphasized previously today, back in 2003 and 2002, the tensions were building for a longer time and it was relatively clear in advance that the U.S. attack was going to happen. This time, Russia claimed that it wouldn’t attack until the very last minute before the invasion. Consequently, the “we have to act now” is still likely to be present, and the dust hasn’t settled yet – everything appears to be unclear, and thus the markets are not returning to their previous trends. Yet.
However, as history shows, that is likely to happen. Either immediately, or shortly, as crude oil is already outperforming gold.
Investing and trading are difficult. If it was easy, most people would be making money – and they’re not. Right now, it’s most difficult to ignore the urge to “run for cover” if you physically don’t have to. The markets move on “buy the rumor and sell the fact.” This repeats over and over again in many (all?) markets, and we have direct analogies to similar situations in gold itself. Junior miners are likely to decline the most, also based on the massive declines that are likely to take place (in fact, they have already started) in the stock markets.
Having said that, let’s take a look at the markets from a more fundamental point of view.
Fear, Uncertainty, and Doubt (FUD)
While the FUD mantra is often reserved for cryptocurrency enthusiasts, the idiom applies to today’s gold market as well. For example, with the Russia-Ukraine conflict increasing investors’ anxiety and asset prices swinging violently after every positive and negative headline, ‘the world is or is not coming to an end’ trade has gripped Wall Street.
Moreover, with the PMs often material beneficiaries of geopolitical conflict, they’ve been among the best-performing assets. However, while sentiment and fundamentals head in opposite directions, peak fear may already be upon us.
For example, I included a chart in yesterday’s analysis to showcase how safe-haven flows have helped prop up the PMs. For context, I wrote:
When crises erupt, investors follow a familiar playbook. And with another re-enactment on full display, the unwinding of these positions will likely have a drastic impact over the medium term.
Please see below:
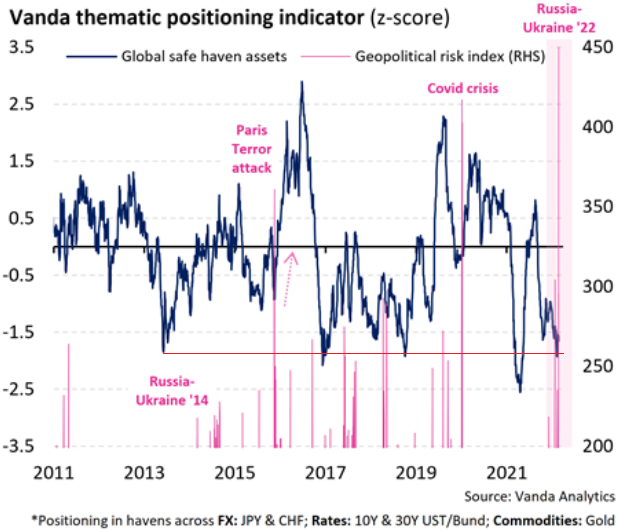
To explain, the blue line above tracks investors’ positioning in global safe-haven assets. For context, the basket includes risk-off currencies, bonds, and of course, gold. However, if you analyze the right side of the chart, you can see that the dark blue line is roughly two standard deviations from its average. As a result, the implied probability of further bullish positioning is roughly 2.5%.
To that point, while some confusion has arisen since the chart depicts safe-haven positioning as two standard deviations below the average, the logical explanation is that fear has led to more safe-haven flows, not less. Below, I will provide more evidence.
For example, while prophecies of $2,500 gold are now making the rounds, excessive bullishness is often a reliable contrarian indicator. Since market participants largely expect a continued run to higher prices, gold’s peak may be here or about to materialize soon.
Please see below:

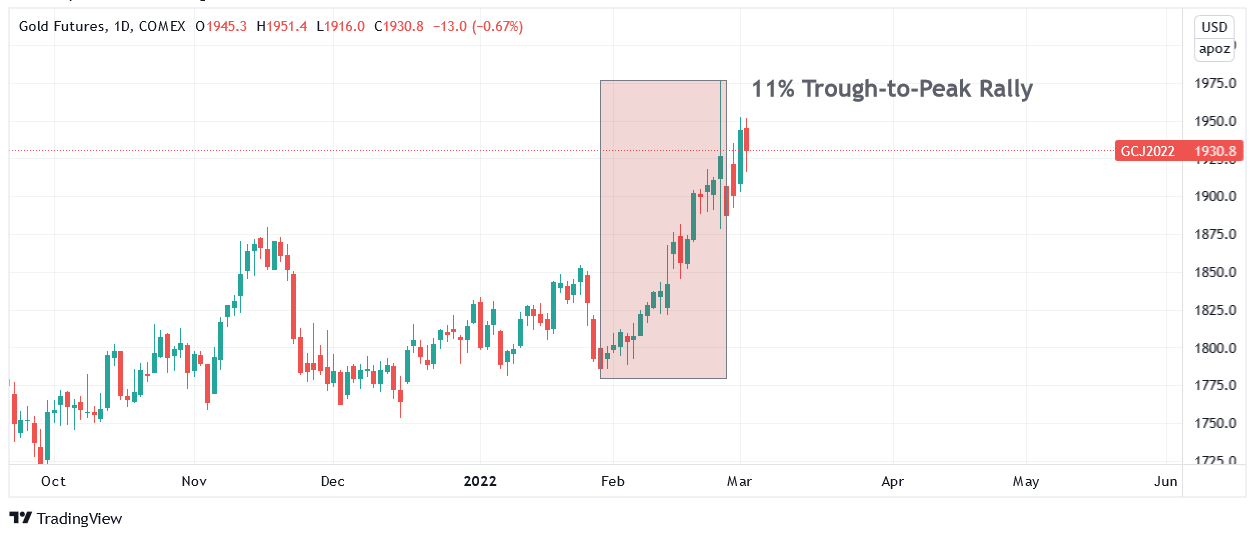
To explain, the chart above tracks the gold futures price in 2014. If you analyze the shaded purple box, you can see that in the buildup to and during Russia’s invasion of Ukraine in 2014, gold recorded an intraday trough-to-peak rally of 12.5%. However, as the chart demonstrates, the good times didn’t last, and gold eventually sank to new lows.
Now, this time around, gold has recorded an intraday trough-to-peak rally of 11%, and with the spike-high-close-lower candle from Feb. 24 still holding as the intraday high, the yellow metal may have already reached its precipice.
Please see below:
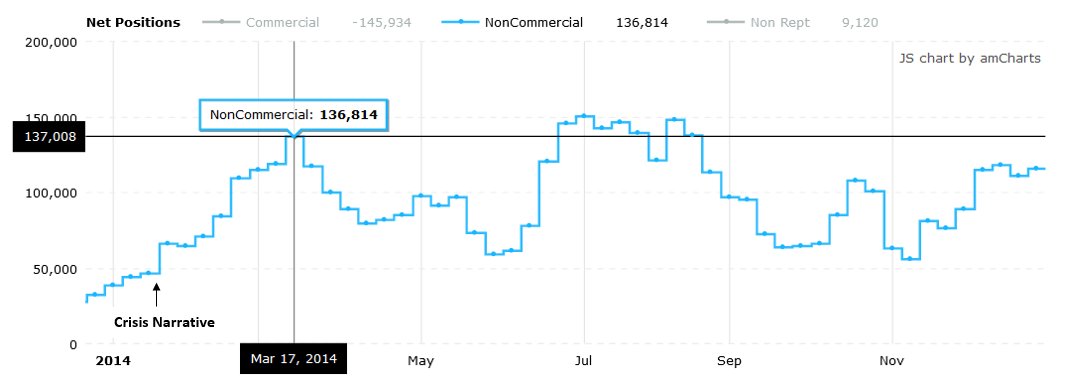
However, what good is price without the sentiment indicators to back it up? Well, also mirroring their behavior from 2014, non-commercial (speculative) futures traders were feverishly buying gold futures during the Russia-Ukraine conflict in 2014. Surprise, surprise: the gold futures price peaked on Mar. 17, 2014, and speculative net-futures positioning also peaked on Mar. 17, 2014.
As a result, it's important to remember that investors are often the most bullish at the top and the most bearish at the bottom. Because human nature doesn't change, is this time really different?
Please see below:
 Source: Commitment of Traders (COT) report
To that point, let's analyze how the price action and positioning in 2014 compares to 2022. As mentioned, gold futures' intraday trough-to-peak rallies are quite similar. Moreover, the behavior of speculative futures traders is nearly identical. For example, with investors tripping over themselves to go long the yellow metal, speculative net-futures positioning has spiked since the beginning of February. Since momentum begets momentum, the crisis narrative has investors piling into gold futures like in 2014.
Moreover, with peak speculative positioning coinciding with peak gold back then, it's another indicator that we're likely much closer to the top than the bottom (if it hasn't already topped).
For context, the data below depicts speculators' positioning as of the week ended Feb 25. Since Russian commercial banks were sanctioned and cut off from SWIFT, and the Russian central bank was isolated from the global monetary system during the weekend of Feb. 26-27, speculators' net positions could be even higher now.
However, the important point is that positioning is a contrarian indicator that highlights how it's often a bearish development when investors race to board gold's train.
Please see below:
 Source: COT report
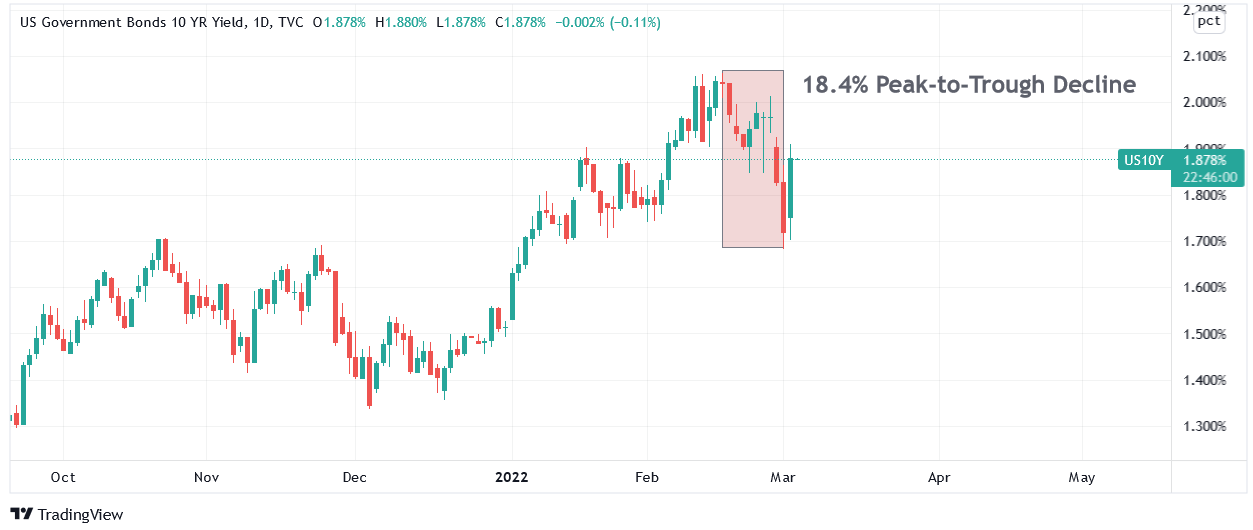
As another fear gauge, U.S. Treasuries are the ultimate safe-haven asset, and when risks materialize, bond values increase and interest rates decrease. As such, when Russia annexed Crimea in 2014, the U.S. 10-Year Treasury yield recorded an intraday peak-to-trough decline of 15.4%.
For context, the benchmark yield continued its descent later in 2014. However, that was for other fundamental reasons. Conversely, if you analyze the shaded purple box below, you can see that after the U.S. 10-Year Treasury yield bottomed, it traded roughly sideways, recording higher highs and higher lows for the next several weeks.
As a result, the initial low in February 2014 was mainly due to geopolitical fears.
Please see below:
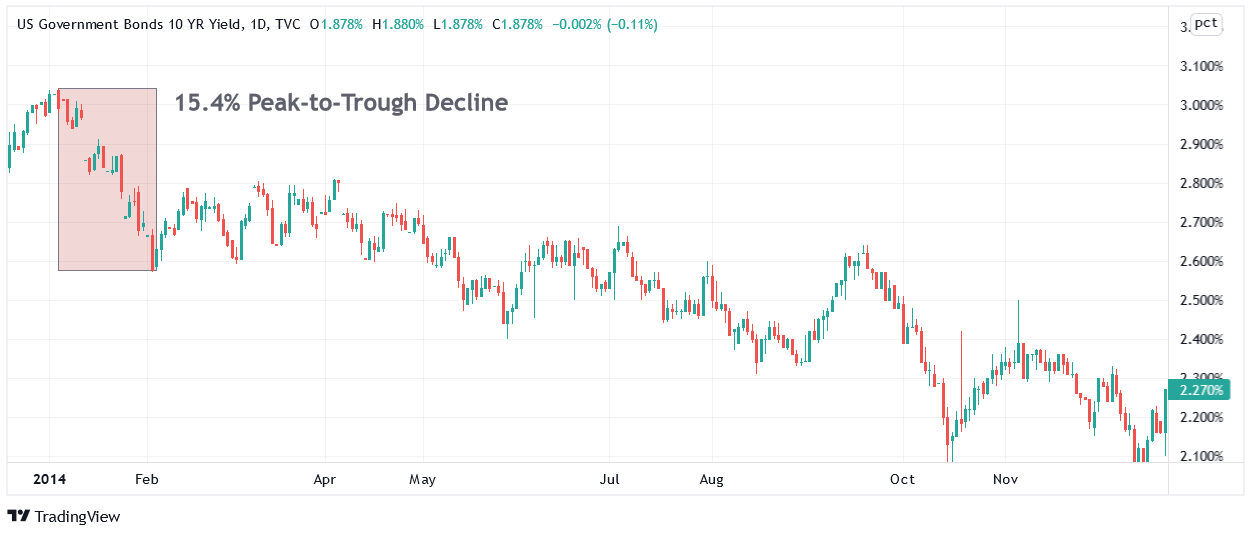
This time around, it’s a similar story. While the Russia-Ukraine conflict elicited a safe-haven bid for U.S. Treasuries, the U.S. 10-Year Treasury yield recorded an intraday peak-to-trough decline of 18.4%, and on Mar. 2, the yield benchmark rallied by 8.14% and closed above 1.85%. As a result, it’s another indicator that peak fear may have already materialized.
Please see below:
Continuing the theme, shaken stock market investors are experiencing the opposite emotions of overzealous gold investors. For example, each time a war escalation headline hits, gold rallies and stocks sell-off. Conversely, when cooler heads prevail, stocks rally and gold sells off.
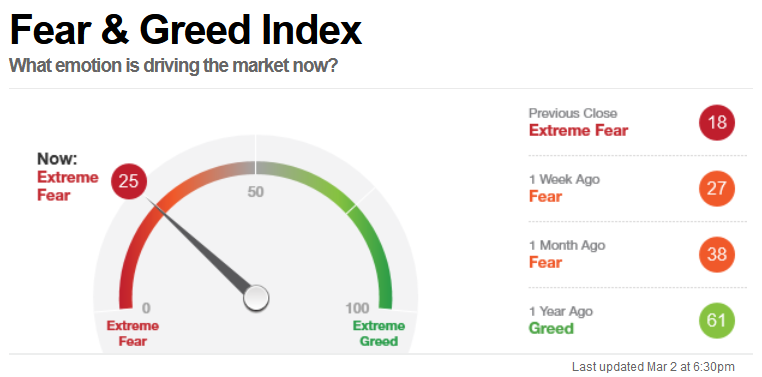
To that point, with the crisis narrative spreading across all corners of Wall Street, CNN’s Fear & Greed Index signals “extreme fear” in the stock market. Moreover, the signal was still present after the rally on Mar. 2.
Please see below:
 Source: CNN
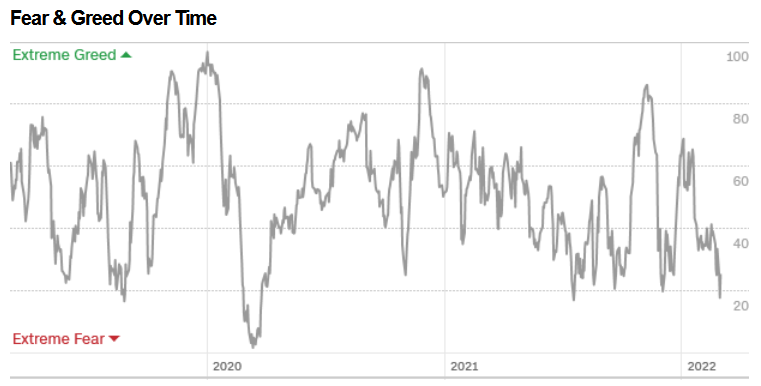
To that point, when you compare the reading of 18 on Mar. 1 to recent history, CNN’s Fear & Greed Index shows that investors are extremely skittish about the Russia-Ukraine conflict. With lower levels rarely witnessed outside of the COVID-19 crash, is it wise to expect more fear to materialize and propel the PMs higher?
 Source: CNN
For context, CNN’s Fear & Greed Index accounts for junk bond spreads, safe-haven flows, put/call ratios, stocks’ high-low ratios, market momentum, volatility, and breadth.
Regarding safe-haven flows, the Mar. 2 report revealed:
“Stocks and bonds have provided similar returns during the last 20 trading days. However, this has been among the weakest periods for stocks relative to bonds in the past two years and indicates investors are fleeing risky stocks for the safety of bonds.”
What about put/call ratios?
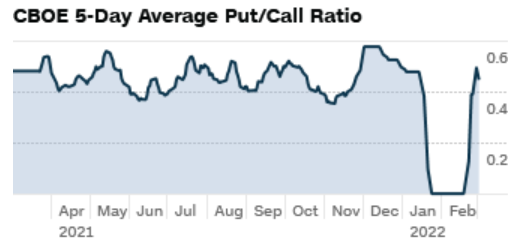
“During the last five trading days, volume in put options has lagged volume in call options by 55.34% as investors make bullish bets in their portfolios. However, this is still among the highest levels of put buying seen during the last two years, indicating fear on the part of investors.”
Please see below:
 Source: CNN
To explain, investors buy put options when they think the stock market will fall, and they buy call options when they believe the stock market will rise. When the line above is rising, it means that investors are buying more put options than call options.
Thus, if you analyze the right side of the chart, notice the sharp surge that’s occurred over the last few weeks? Moreover, with the ratio declining slightly over the previous five days, it’s another indicator that peak fear may have already materialized.
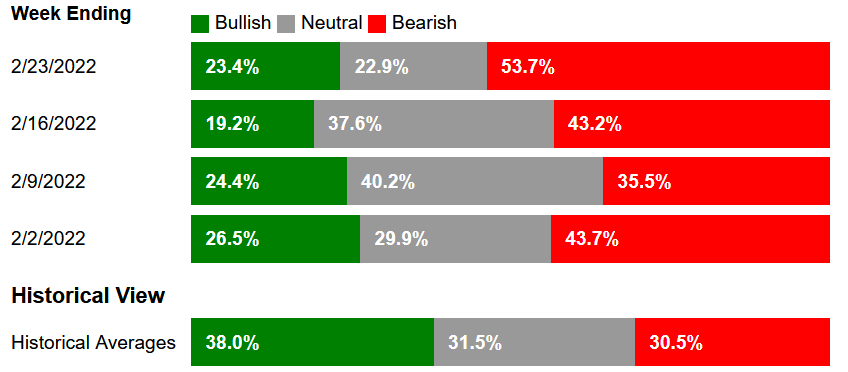
Finally, the latest American Association of Individual Investors (AAII) survey shows that 53.7% of AAII members are bearish on the stock market, versus a historical average of 30.5%.
Please see below:
 Source: AAII
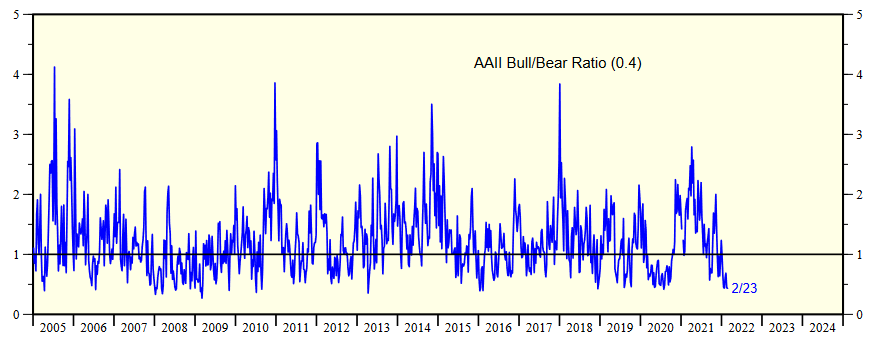
Likewise, the AAII’s bull/bear ratio of 0.4 is among the lowest readings that we’ve witnessed in the last ~17 years.
 Source: AAII/Ed Yardeni
The bottom line? It’s important to view things from a contrarian perspective. When everyone is positioned for the PMs to surge, the opposite often materializes. Moreover, when everyone is positioned for the stock market to crash, the opposite (for now) often materializes.
Remember, the PMs don’t soar to new highs when everyone is bullish. Likewise, the stock market doesn’t crash when everyone is bearish. In contrast, these events often unfold when most investors aren’t expecting them. As a result, with 2014 showcasing that Russia-Ukraine fears ended with stocks recovering and the PMs falling, peak fear may flip the switch sooner rather than later.
In conclusion, the PMs declined on Mar. 2, as geopolitical concerns calmed for the time being. Moreover, in the absence of escalation headlines, the PMs have little or no high-grade fuel to move higher. With several metrics supporting the notion that peak fear is already priced in, the PMs may find the rest of 2022 extremely unkind – at least it’s first half.
Overview of the Upcoming Part of the Decline
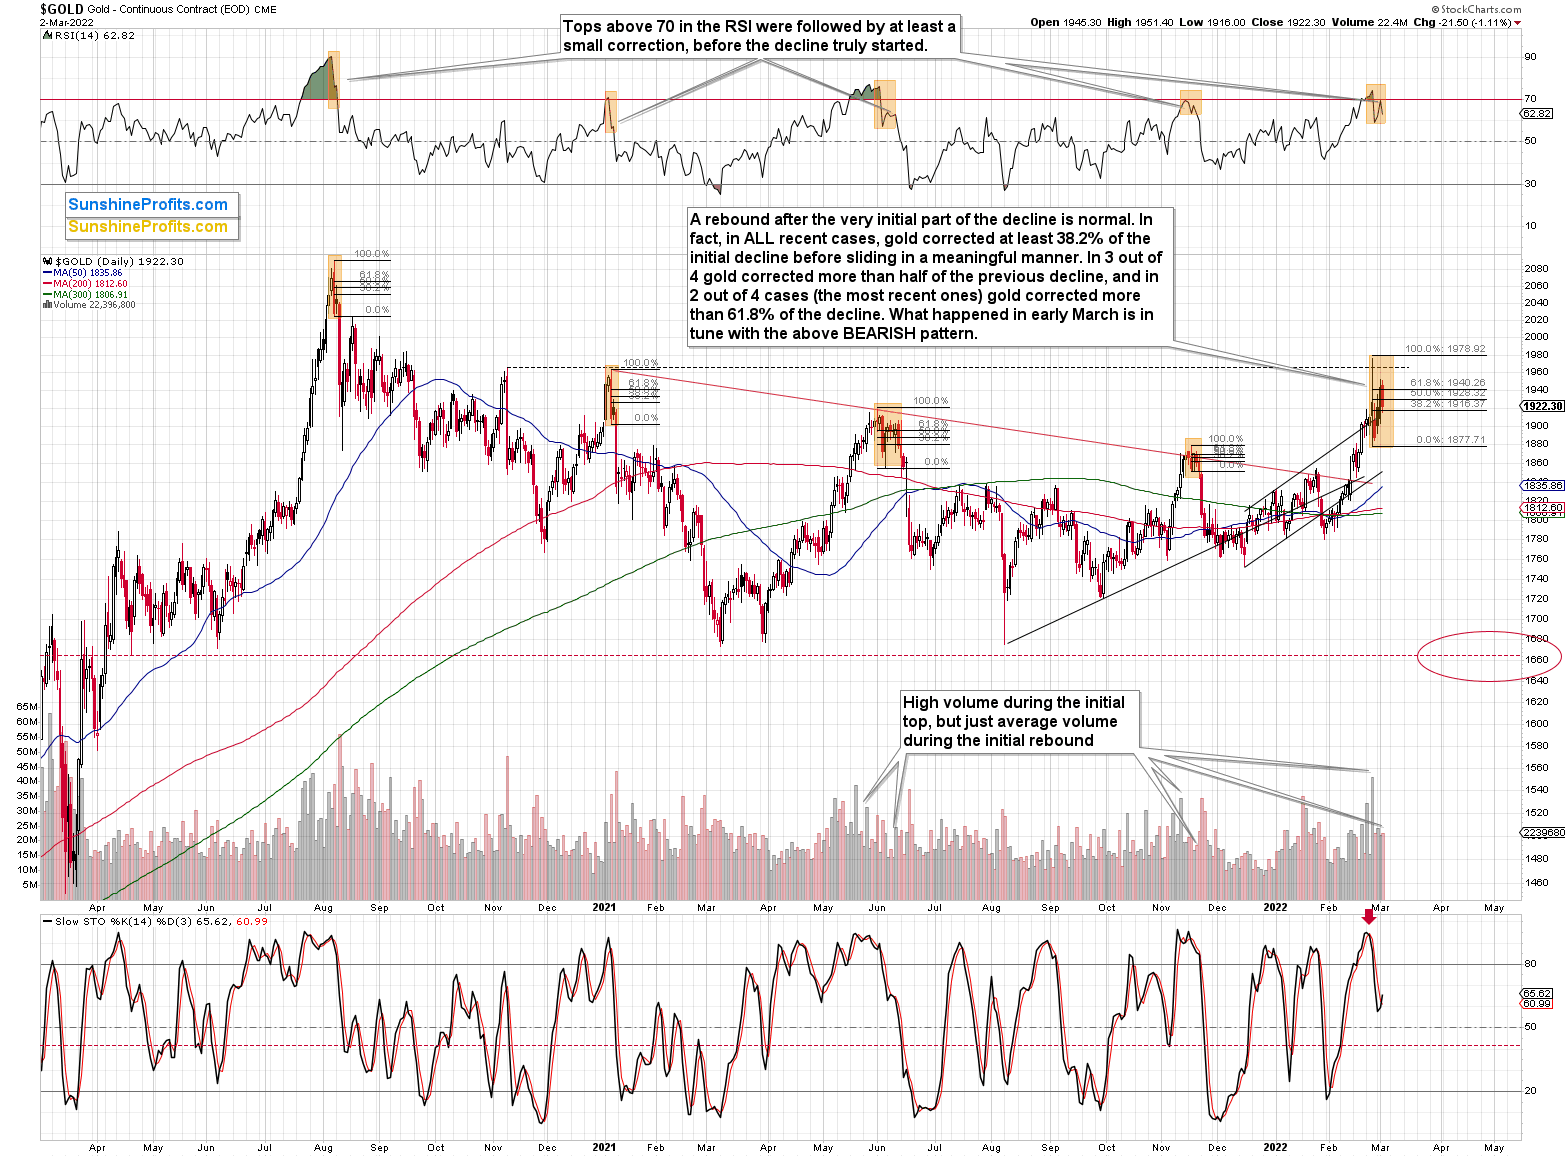
- It seems to me that the corrective upswing is now over or very close to being over , and that gold, silver, and mining stocks are now likely to continue their medium-term decline.
- It seems that the first (bigger) stop for gold will be close to its previous 2021 lows, slightly below $1,700. Then it will likely correct a bit, but it’s unclear if I want to exit or reverse the current short position based on that – it depends on the number and the nature of the bullish indications that we get at that time.
- After the above-mentioned correction, we’re likely to see a powerful slide, perhaps close to the 2020 low ($1,450 - $1,500).
- If we see a situation where miners slide in a meaningful and volatile way while silver doesn’t (it just declines moderately), I plan to – once again – switch from short positions in miners to short positions in silver. At this time, it’s too early to say at what price levels this could take place, and if we get this kind of opportunity at all – perhaps with gold close to $1,600.
- I plan to exit all remaining short positions once gold shows substantial strength relative to the USD Index while the latter is still rallying. This may be the case with gold close to $1,350 - $1,400. I expect silver to fall the hardest in the final part of the move. This moment (when gold performs very strongly against the rallying USD and miners are strong relative to gold after its substantial decline) is likely to be the best entry point for long-term investments, in my view. This can also happen with gold close to $1,375, but at the moment it’s too early to say with certainty.
- As a confirmation for the above, I will use the (upcoming or perhaps we have already seen it?) top in the general stock market as the starting point for the three-month countdown. The reason is that after the 1929 top, gold miners declined for about three months after the general stock market started to slide. We also saw some confirmations of this theory based on the analogy to 2008. All in all, the precious metals sector is likely to bottom about three months after the general stock market tops.
- The above is based on the information available today, and it might change in the following days/weeks.
You will find my general overview of the outlook for gold on the chart below:
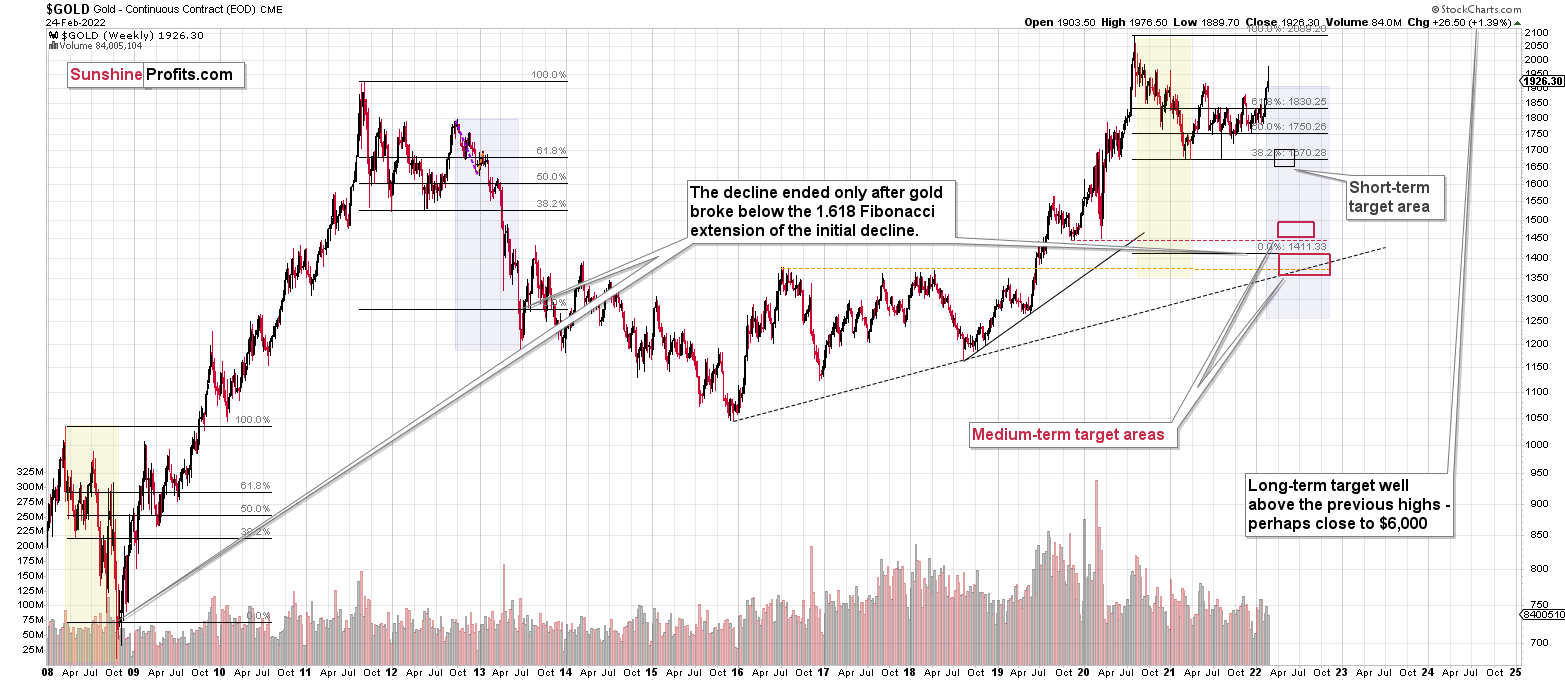
Please note that the above timing details are relatively broad and “for general overview only” – so that you know more or less what I think and how volatile I think the moves are likely to be – on an approximate basis. These time targets are not binding or clear enough for me to think that they should be used for purchasing options, warrants or similar instruments.
Summary
Summing up, despite last week’s rally in gold, the outlook for junior mining stocks remains exactly as I described previously.
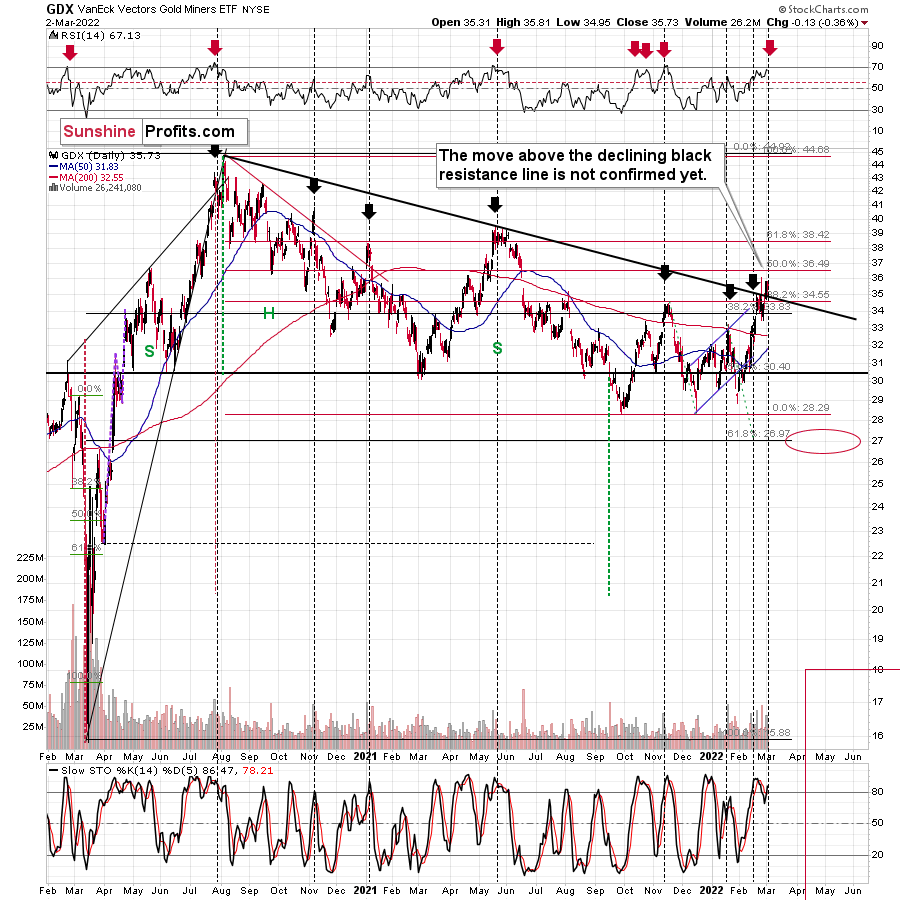
Gold was up about $200 from its late-2021 low, just like how much it rallied in 2014 when Russia took over Crimea. When that happened, junior miners moved about 3% above their previous highs (this remains true also in light of the March 1 rally), and we saw something very similar in last week’s GDXJ trading. Both gold and junior miners declined then, despite the obvious fundamental reasons for their rally.
It looks like “peak uncertainty” and “peak gold” are already here or very, very close. It’s even more likely that the top in junior mining stocks is in.
Investing and trading are difficult. If it was easy, most people would be making money – and they’re not. Right now, it’s most difficult to ignore the urge to “run for cover” if you physically don’t have to. The markets move on “buy the rumor and sell the fact”. This repeats over and over again in many (all?) markets, and we have direct analogies to similar situations in gold itself. Junior miners are likely to decline the most, also based on the massive declines that are likely to take place (in fact, they have already started) in the stock markets.
From the medium-term point of view, the two key long-term factors remain the analogy to 2013 in gold and the broad head and shoulders pattern in the HUI Index. They both suggest much lower prices ahead.
It seems that our profits from the short positions are going to become truly epic in the coming months.
After the sell-off (that takes gold to about $1,350 - $1,500), I expect the precious metals to rally significantly. The final part of the decline might take as little as 1-5 weeks, so it's important to stay alert to any changes.
Most importantly, please stay healthy and safe. We made a lot of money last March and this March, and it seems that we’re about to make much more on the upcoming decline, but you have to be healthy to enjoy the results.
As always, we'll keep you - our subscribers - informed.
To summarize:
Trading capital (supplementary part of the portfolio; our opinion): Full speculative short positions (300% of the full position) in junior mining stocks are justified from the risk to reward point of view with the following binding exit profit-take price levels:
Mining stocks (price levels for the GDXJ ETF): binding profit-take exit price: $34.63; stop-loss: none (the volatility is too big to justify a stop-loss order in case of this particular trade)
Alternatively, if one seeks leverage, we’re providing the binding profit-take levels for the JDST (2x leveraged) and GDXD (3x leveraged – which is not suggested for most traders/investors due to the significant leverage). The binding profit-take level for the JDST: $14.98; stop-loss for the JDST: none (the volatility is too big to justify a SL order in case of this particular trade); binding profit-take level for the GDXD: $25.48; stop-loss for the GDXD: none (the volatility is too big to justify a SL order in case of this particular trade).
For-your-information targets (our opinion; we continue to think that mining stocks are the preferred way of taking advantage of the upcoming price move, but if for whatever reason one wants / has to use silver or gold for this trade, we are providing the details anyway.):
Silver futures downside profit-take exit price: $19.12
SLV profit-take exit price: $17.72
ZSL profit-take exit price: $38.28
Gold futures downside profit-take exit price: $1,683
HGD.TO – alternative (Canadian) inverse 2x leveraged gold stocks ETF – the upside profit-take exit price: $11.79
HZD.TO – alternative (Canadian) inverse 2x leveraged silver ETF – the upside profit-take exit price: $29.48
Long-term capital (core part of the portfolio; our opinion): No positions (in other words: cash
Insurance capital (core part of the portfolio; our opinion): Full position
Whether you already subscribed or not, we encourage you to find out how to make the most of our alerts and read our replies to the most common alert-and-gold-trading-related-questions.
Please note that we describe the situation for the day that the alert is posted in the trading section. In other words, if we are writing about a speculative position, it means that it is up-to-date on the day it was posted. We are also featuring the initial target prices to decide whether keeping a position on a given day is in tune with your approach (some moves are too small for medium-term traders, and some might appear too big for day-traders).
Additionally, you might want to read why our stop-loss orders are usually relatively far from the current price.
Please note that a full position doesn't mean using all of the capital for a given trade. You will find details on our thoughts on gold portfolio structuring in the Key Insights section on our website.
As a reminder - "initial target price" means exactly that - an "initial" one. It's not a price level at which we suggest closing positions. If this becomes the case (like it did in the previous trade), we will refer to these levels as levels of exit orders (exactly as we've done previously). Stop-loss levels, however, are naturally not "initial", but something that, in our opinion, might be entered as an order.
Since it is impossible to synchronize target prices and stop-loss levels for all the ETFs and ETNs with the main markets that we provide these levels for (gold, silver and mining stocks - the GDX ETF), the stop-loss levels and target prices for other ETNs and ETF (among other: UGL, GLL, AGQ, ZSL, NUGT, DUST, JNUG, JDST) are provided as supplementary, and not as "final". This means that if a stop-loss or a target level is reached for any of the "additional instruments" (GLL for instance), but not for the "main instrument" (gold in this case), we will view positions in both gold and GLL as still open and the stop-loss for GLL would have to be moved lower. On the other hand, if gold moves to a stop-loss level but GLL doesn't, then we will view both positions (in gold and GLL) as closed. In other words, since it's not possible to be 100% certain that each related instrument moves to a given level when the underlying instrument does, we can't provide levels that would be binding. The levels that we do provide are our best estimate of the levels that will correspond to the levels in the underlying assets, but it will be the underlying assets that one will need to focus on regarding the signs pointing to closing a given position or keeping it open. We might adjust the levels in the "additional instruments" without adjusting the levels in the "main instruments", which will simply mean that we have improved our estimation of these levels, not that we changed our outlook on the markets. We are already working on a tool that would update these levels daily for the most popular ETFs, ETNs and individual mining stocks.
Our preferred ways to invest in and to trade gold along with the reasoning can be found in the how to buy gold section. Furthermore, our preferred ETFs and ETNs can be found in our Gold & Silver ETF Ranking.
As a reminder, Gold & Silver Trading Alerts are posted before or on each trading day (we usually post them before the opening bell, but we don't promise doing that each day). If there's anything urgent, we will send you an additional small alert before posting the main one.
Thank you.
Przemyslaw Radomski, CFA
Founder, Editor-in-chief

