

Briefly: in our opinion, full (300% of the regular position size) speculative short positions in junior mining stocks are justified from the risk/reward point of view at the moment of publishing this Alert. Note: I’m moving the profit-take level for the GDXJ lower, and I’m adjusting profit targets for leveraged instruments.
The Fed decided, and the Fed spoke. And what happened, happened in tune with the trends and with my previous expectations. Since yesterday’s session was most likely driven by the above, let’s start with the more fundamental approach.
Powell’s Payback
While I've been warning for months that the Fed isn't bluffing when it comes to interest rate hikes, Chairman Jerome Powell provided another dose of reality on Jan. 26. For context, the FOMC's monetary policy statement was held roughly constant: as expected, the committee kept interest rates unchanged and maintained the current pace of its tapering process.
However, in a materially hawkish shift, the FOMC released its "Principles for Reducing the Size of the Federal Reserve's Balance Sheet". Moreover, while the report stated the obvious when it highlighted that "the Committee views changes in the target range for the federal funds rate as its primary means of adjusting the stance of monetary policy," officials outlined their framework for quantitative tightening (QT).
Please see below:
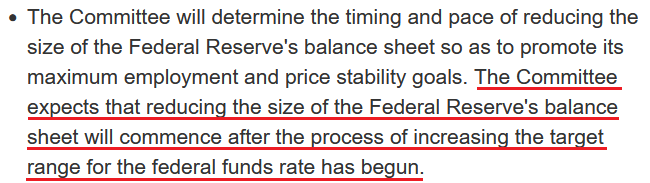 Source: U.S. Fed
As a result, QT could begin as early as March, and interest rate hikes combined with QT is a profoundly bearish scenario for the PMs. To that point, when the news hit the wire at 2 p.m. ET, the GDXJ ETF and the U.S. 10-Year Treasury yield struggled to digest the narrative. However, with Powell’s press conference leaving little doubt, the bond market’s fundamental impact on the PMs is material.
Please see below:
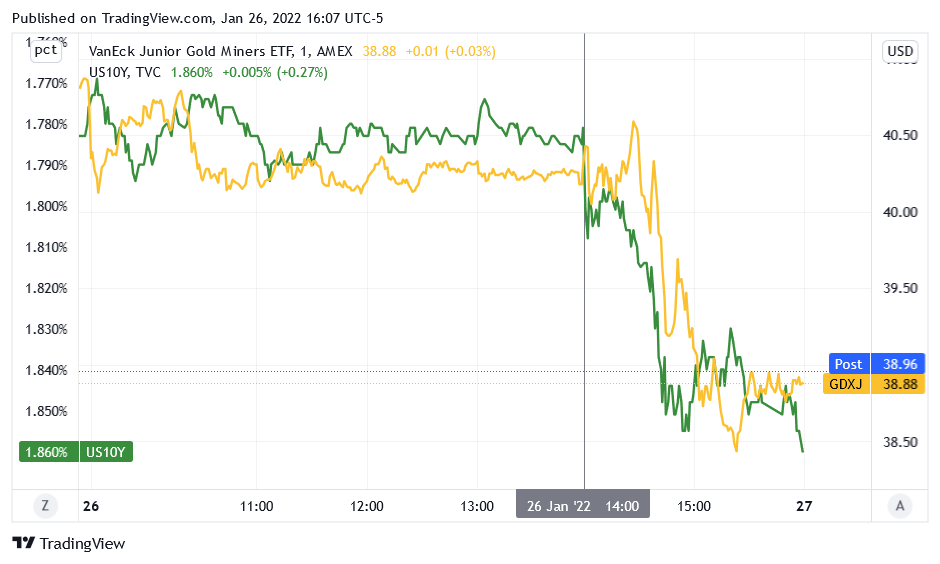
To explain, the gold line above tracks the one-minute movement of the GDXJ ETF, while the green line above tracks the inverted one-minute movement of the U.S. 10-Year Treasury yield. For context, inverted means that the latter’s scale is flipped upside down, and that a rising green line represents a falling U.S. 10-Year Treasury yield, while a falling green line represents a rising U.S. 10-Year Treasury yield.
Moreover, while the pair were relatively subdued leading up to the event, volatility increased when the FOMC released its statement. Furthermore, while the GDXJ ETF initially jumped, Powell’s hawkish press conference (which I’ll cover in detail shortly) helped sink the junior miners. As a result, the bearish fundamentals that I warned about were on full display on Jan. 26.
To that point, while the U.S. 10-Year Treasury yield’s rally is depicted on the chart above, the entire U.S. yield curve soared on Jan. 26. In addition, with the USD Index also rising sharply, the two-headed monster was extremely unkind to the PMs.
Please see below:
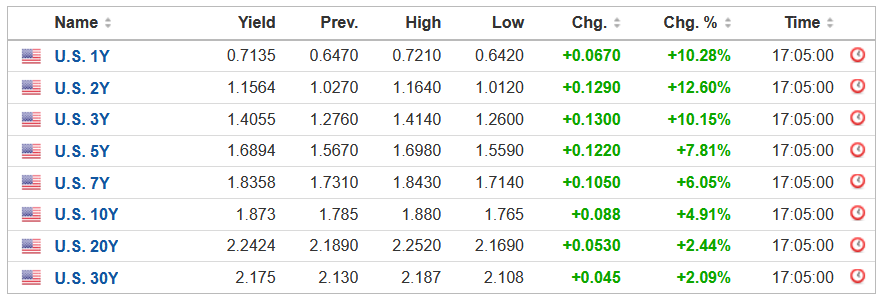 Source: Investing.com
Now, to break down all of the important details from Powell’s press conference, he admitted what I warned about throughout all of 2021. He said:
“Inflation risks are still to the upside in the views of most FOMC participants, and certainly in my view as well. There’s a risk that the high inflation we are seeing will be prolonged. There’s a risk that it will move even higher. So, we don’t think that’s the base case, but, you asked what the risks are, and we have to be in a position with our monetary policy to address all of the plausible outcomes.”
Moreover:
“Wages have also risen briskly, and we are attentive to the risks that persistent real wage growth in excess of productivity could put upward pressure on inflation.”
On top of that, he added:
“The balance sheet is substantially larger than it needs to be. There’s a substantial amount of shrinkage in the balance sheet to be done. That’s going to take some time. We want that process to be orderly and predictable.”
In addition, while I’ve warned on numerous occasions that the U.S. economy remains resilient, Powell cited a “very, very strong” labor market as one of the reasons to hike interest rates in the coming months.
Please see below:
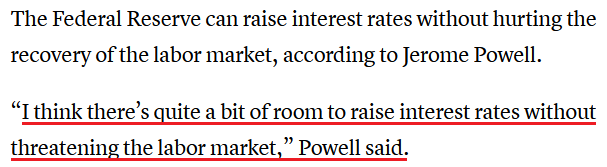 Source: CNBC
When could liftoff commence? Well, with all signs pointing to the FOMC’s March monetary policy meeting, Powell said:
“We’ll make a decision whether to raise the Federal Funds Rate. I would say that the committee is of a mind to raise the Federal Funds Rate at the March meeting, assuming that conditions are appropriate for doing so.”
As a result, while some market participants assumed that the Fed would let inflation run wild, and gold, silver and mining stocks would be material beneficiaries, I warned that the prospect was much more semblance than substance. Moreover, in four months, we went from maybe one rate hike to “there’s quite a bit of room to raise interest rates.”
To explain, I wrote on Sep. 27:
FOMC participants are split 50/50 when it comes to a 2022 rate hike. However, if the inflationary rush continues and Powell’s accelerated taper fails to quell the momentum, another pull-forward of the FOMC’s ‘dot plot’ could result in another sell-off of the PMs.
Moreover, with the pricing pressures poised to persist for much longer than he expects, the FOMCs 2022 PCE Index projection could be revised upward again in the coming months. More importantly, though, if investors fear that Powell has lost control of inflation, several assets, including the PMs, could suffer mightily.
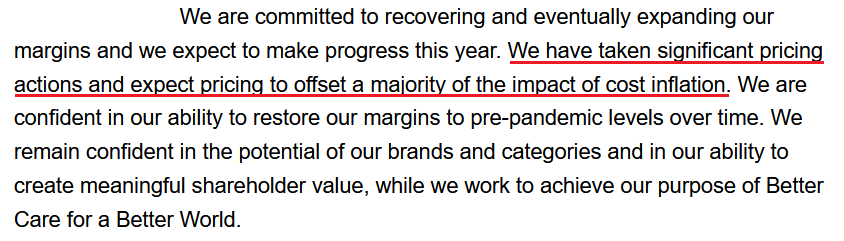
Finally, as we look ahead, U.S. companies are still dealing with the inflationary onslaught, and Powell has to take an active approach to calm inflation’s fervor. For example, Kimberly-Clark – a multinational personal care company – reported its fourth-quarter earnings on Jan. 26. With inflation still a material problem, CFO Maria Henry said:
“Let me spend a minute on our inflation outlook for 2022. As you just mentioned, it continues to have volatility around it. For perspective, if we had given you our outlook on the October call, we would have been $300 million lower than the outlook that we are providing today. So, it’s been quite volatile. And we are kind of calling it at a tough part of the cycle, hence, the range around it.”
How is the company dealing with these issues?
 Source: Kimberly-Clark/Seeking Alpha
The bottom line? While it may seem counterintuitive, I warned for months that surging inflation was actually bearish for the PMs. With consumers only able to handle so much, and the Fed’s reaction function often uplifting the USD Index and U.S. Treasury yields, investors underestimated the challenges confronting the PMs.
Moreover, with investors also underestimating Powell’s willingness to handle the situation, they don’t realize that inflation has become political. With U.S. President Joe Biden’s re-election hopes about to die on a hill of surging inflation, calming the pricing pressures is his main objective. As such, higher precious metals prices are mutually exclusive to his goal, and 2022 should prove as challenging as 2021.
In conclusion, the PMs declined on Jan. 26, and the GDXJ ETF was a noticeable underperformer. With both the USD Index and the U.S. 10-Year Treasury yield seeking higher ground, the PMs’ main fundamental adversaries spoiled their party once again. Moreover, with Powell hawked up and surging inflation unlikely to abate on its own, interest rate hikes should commence sooner rather than later. As a result, the PMs’ fundamental outlooks remain extremely treacherous, and lower lows will likely confront gold, silver and mining stocks over the medium term.
The above might sound like a gloom and doom scenario for precious metals investors, but I view it as particularly favorable. Why? Because:
- This situation allows us to profit on the upcoming decline in the precious metals sector through trading capital.
- This situation allows us to detect a great buying entry point in the future. When gold has everything against it and then it manages to remain strong – it will be exactly the moment to buy it. To be more precise: to buy into the precious metals sector (I plan to focus on purchasing mining stocks first as they tend to be strongest during initial parts of major rallies). At that moment PMs will be strong and the situation will be so bad that it can only improve from there – thus contributing to higher PM prices in the following months.
- Most market participants have not realized the above. “Gold and (especially) silver can only go higher!” is still a common narrative on various forums.
Having said that, let’s take a look at the short-term charts.
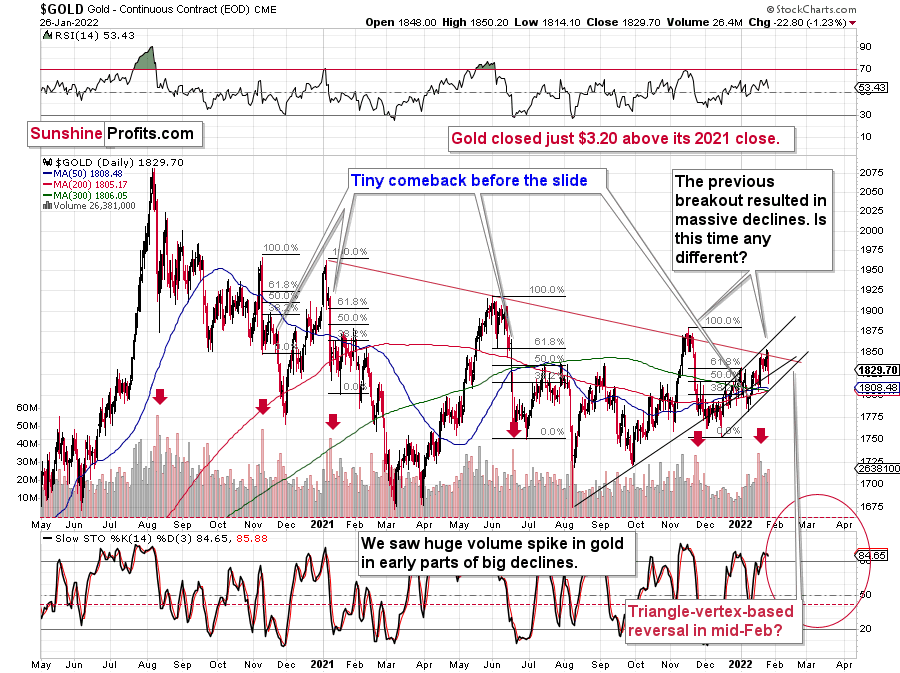
In short, gold declined significantly, and it’s now trading once again below the rising support / resistance line, the declining red resistance line, and back below 2021 closing price (taking also today’s pre-market decline into account).
In other words:
- All important short-term breakouts were just invalidated.
- The 2022 is once again a down year for gold.
Is this as bearish as it gets for gold? Well, there could be some extra bearish things that could happen, but it’s already very, very bearish right now.
For example, gold market could catch-up with its reactions to USD Index’s strength.
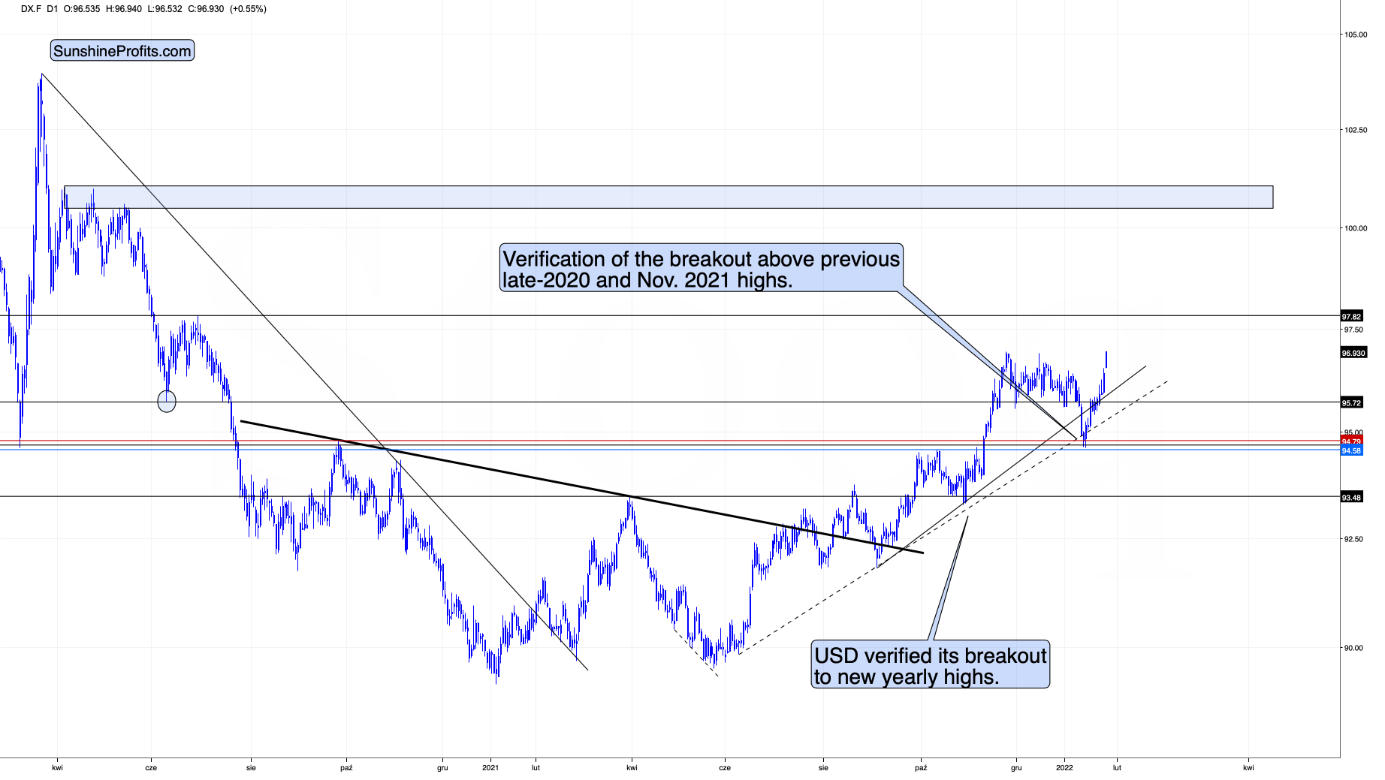
The U.S. currency just moved above its previous 2022 and 2021 highs, while gold is not at its 2021 lows.
Yet.
I wouldn’t view gold’s performance as true strength against the USD Index at this time just yet. Why? Because of the huge consolidation that gold has been trading in.
The strength that I want to see in gold is its ability not to fall or soar back up despite everything thrown against it, not because it’s stuck in a trading range.
In analogy, you’ve probably seen someone, who’s able to hold their ground, and not give up despite the world throwing every harm and obstacle at them. They show their character. They show their strength. Inaction could represent greater wisdom and/or love and focus on one’s goal that was associated with the lack of action. You probably know someone like that. You might be someone like that.
The above “inaction” is very different from “inaction” resulting from someone not knowing what to do, not having enough energy, or willpower.
Since markets are ultimately created by people (or algorithms that were… ultimately still created by people) is it any surprise that markets tend to work in the same way? One inaction doesn’t equal another inaction, and – as always – context matters.
However, wasn’t gold strong against the USD Index’s strength in 2021?
It was, but it was very weak compared to the ridiculous amounts of money that were printed in 2020 and 2021 and given the global pandemic. These are the circumstances, where gold “should be” soaring well above its 2011 highs, not invalidating the breakout above it. The latter, not the former, happened. Besides, the “strength” was present practically only in gold. Silver and miners remain well below their 2011 highs – they are not even close to them and didn’t move close to them at any point in 2020 or 2021.
Gold has been consolidating for many months now, just like it’s been the case between 2011 and 2013.
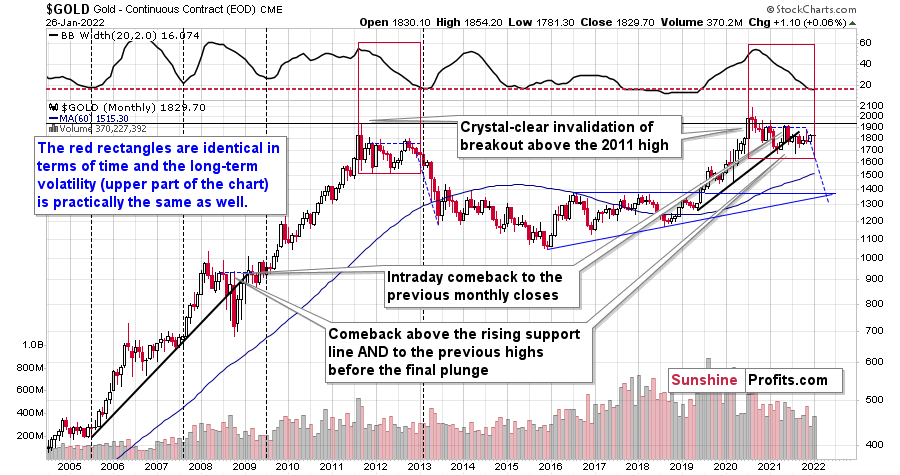
The upper part of the above chart features the width of the Bollinger Bands – I didn’t mark them on the chart to keep it clear, but the important detail is that whenever their width gets very low, it means that the volatility has been very low in the previous months, and that it’s about to change.
I marked those cases with vertical dashed lines when the big declines in the indicator took it to or close to the horizontal, red, dashed line. In particular, the 2011 – 2013 decline is similar to the current situation.
What does it mean? It means that gold wasn’t really showing strength – it was stuck. Just like 2012 wasn’t a pause before a bigger rally, the 2021 performance of gold shouldn’t be viewed as such.
What happened yesterday showed that gold can and will likely react to hawkish comments from the Fed, that the USD Index is likely to rally and so are the interest rates. The outlook for gold in the medium term is not bullish, but very bearish.
The above is a positive for practically everyone interested in the precious metals market (except for those who sell at the bottom that is), as it will allow one to add to their positions (or start building them) at much lower prices.
While gold had just been at its new 2022 highs, yesterday, junior gold miners moved to new intraday 2022 lows.
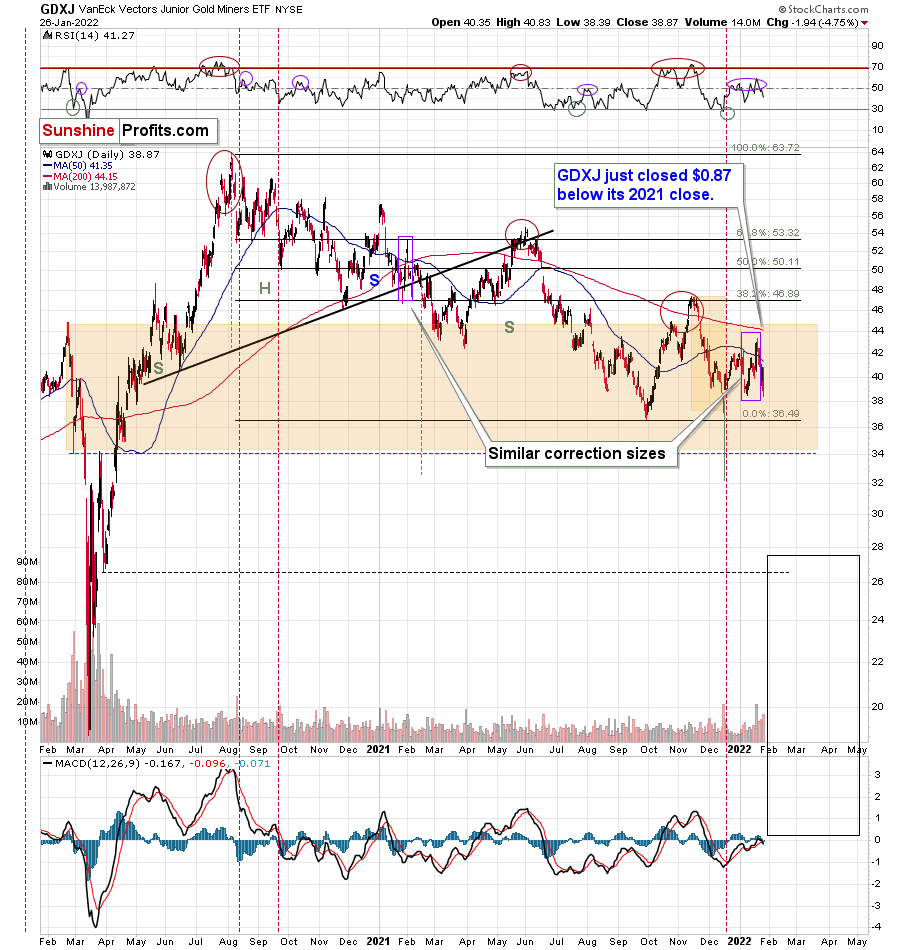
In the pre-market trading GDXJ is down by another $0.64 (1.65%), so it could be the case the miners close at new 2022 lows today.
The initial downside target for the GDXJ ETF based on the above chart remains up-to-date.
Please note the broad orange rectangle that I placed on the above chart. It’s there to illustrate the size of the initial 2020 decline.
Yes, junior miners are already below the price levels from which the 2020 started, and if they simply decline as much as they declined back then (so, I’m not asking for anything “completely new” to happen), they could be at $34 in a matter of days.
Perhaps (no guarantees; there could always be delays) the markets will fall quite soon – once they get the next portion of information from the Fed. Consequently, it could be a matter of hours, not necessarily days or weeks.
Still, since gold is so high right now, while junior miners are so low, it seems that updating of our downside trading targets would be a good idea. After all, they are likely to bottom either at the same time, or close to each other.
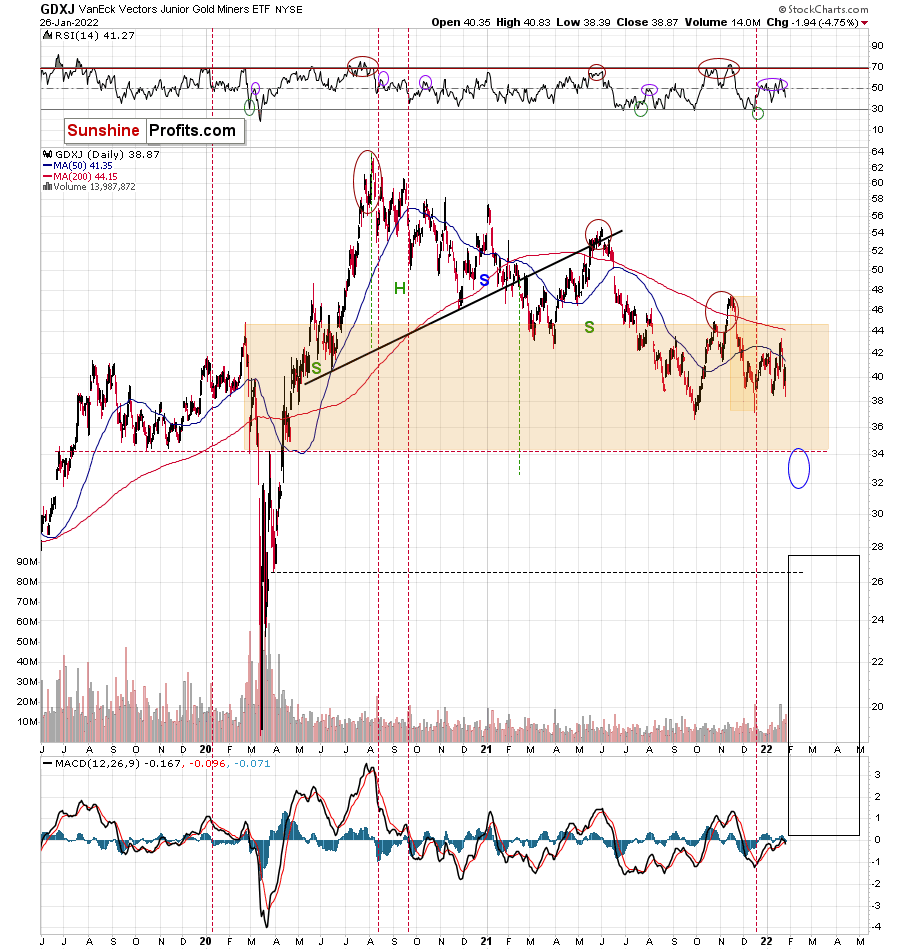
Based on what’s going on in the general stock market, it seems that gold miners might suffer even more than they did in 2013 (perhaps somewhat in tune with what happened in 2008 and 2020), but overall, the price patterns are similar to what happened in 2013, so time-wise it seems that using the 2013 performance as the key analogy is the most justified approach.
In other words, instead of seeing a flash-crash of 2020, we might see “just” an extreme crash of 2013, but perhaps to an even greater extent.
One good way to take all this into account is to use one forecast (here: gold is likely to pause / form a short-term bottom at its 2021 low or close to it) and then translate it to the world of junior mining stocks using the ratio between the two.
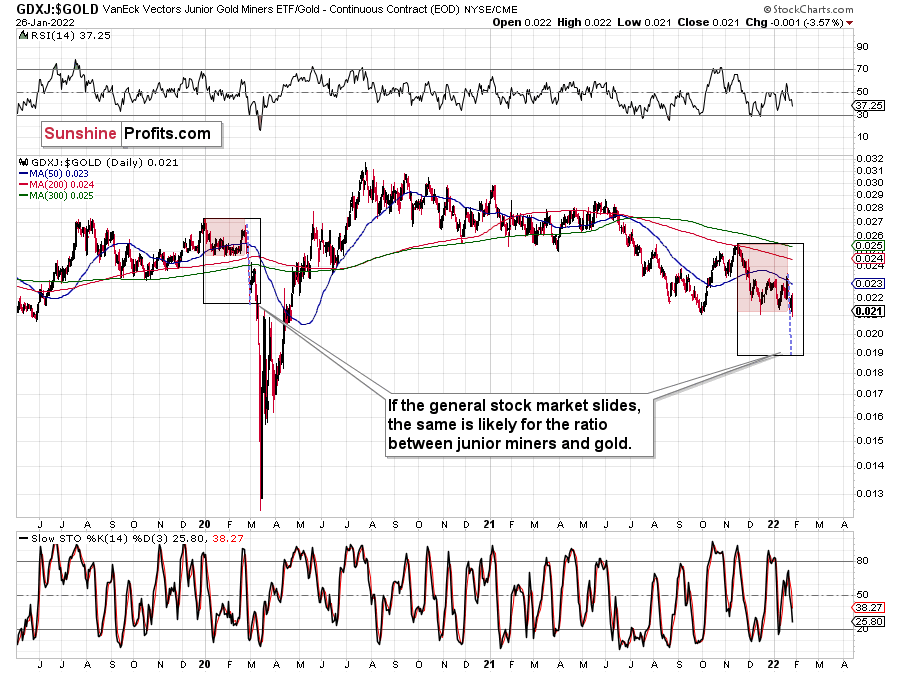
If the general stock market slides, the same is likely for the ratio between junior miners and gold.
History doesn’t have to repeat itself to the letter, but looking at how a similar situation developed in the past is still the best insight that we can have into the future, at least using conventional means.
I marked the similar situations with black and red rectangles. If the ratio declines from its recent top just as it did in 2020, then we could see a slide in the ratio to about 0.019.
If gold moves to about $1,680 and the ratio to 0.019, then GDXJ could move to $1,680*0.019 = about $32.
Let’s check for the nearby support levels.
The proximity of the $34 level stopped the rally in mid-2019, the declines several times in late 2019 and then it triggered a rebound in early 2020.
Consequently, even though the ratio-based math suggests a move to even $32 without a bigger correction, it seems that we might actually get a corrective upswing from $34 or slightly above it.
Therefore, I’m changing the profit-take exit level for the current short position in the GDXJ and I’m updating other targets.
Naturally, please keep in mind that I might switch from this position to a short position in silver if the miners decline substantially first but silver doesn’t (silver tends to catch up during final parts of given price moves). It’s been the case recently, but not extremely enough for me to make this switch.
Overview of the Upcoming Part of the Decline
- It seems to me that the corrective upswing is over or close to being over, and that gold, silver, and mining stocks are now likely to continue their medium-term decline.
- It seems that the first (bigger) stop for gold will be close to its previous 2021 lows, slightly below $1,700. Then it will likely correct a bit, but it’s unclear if I want to exit or reverse the current short position based on that – it depends on the number and the nature of the bullish indications that we get at that time.
- After the above-mentioned correction, we’re likely to see a powerful slide, perhaps close to the 2020 low ($1,450 - $1,500).
- If we see a situation where miners slide in a meaningful and volatile way while silver doesn’t (it just declines moderately), I plan to – once again – switch from short positions in miners to short positions in silver. At this time, it’s too early to say at what price levels this could take place, and if we get this kind of opportunity at all – perhaps with gold close to $1,600.
- I plan to exit all remaining short positions once gold shows substantial strength relative to the USD Index while the latter is still rallying. This may be the case with gold close to $1,350 - $1,400. I expect silver to fall the hardest in the final part of the move. This moment (when gold performs very strongly against the rallying USD and miners are strong relative to gold after its substantial decline) is likely to be the best entry point for long-term investments, in my view. This can also happen with gold close to $1,375, but at the moment it’s too early to say with certainty.
- As a confirmation for the above, I will use the (upcoming or perhaps we have already seen it?) top in the general stock market as the starting point for the three-month countdown. The reason is that after the 1929 top, gold miners declined for about three months after the general stock market started to slide. We also saw some confirmations of this theory based on the analogy to 2008. All in all, the precious metals sector is likely to bottom about three months after the general stock market tops.
- The above is based on the information available today, and it might change in the following days/weeks.
You will find my general overview of the outlook for gold on the chart below:
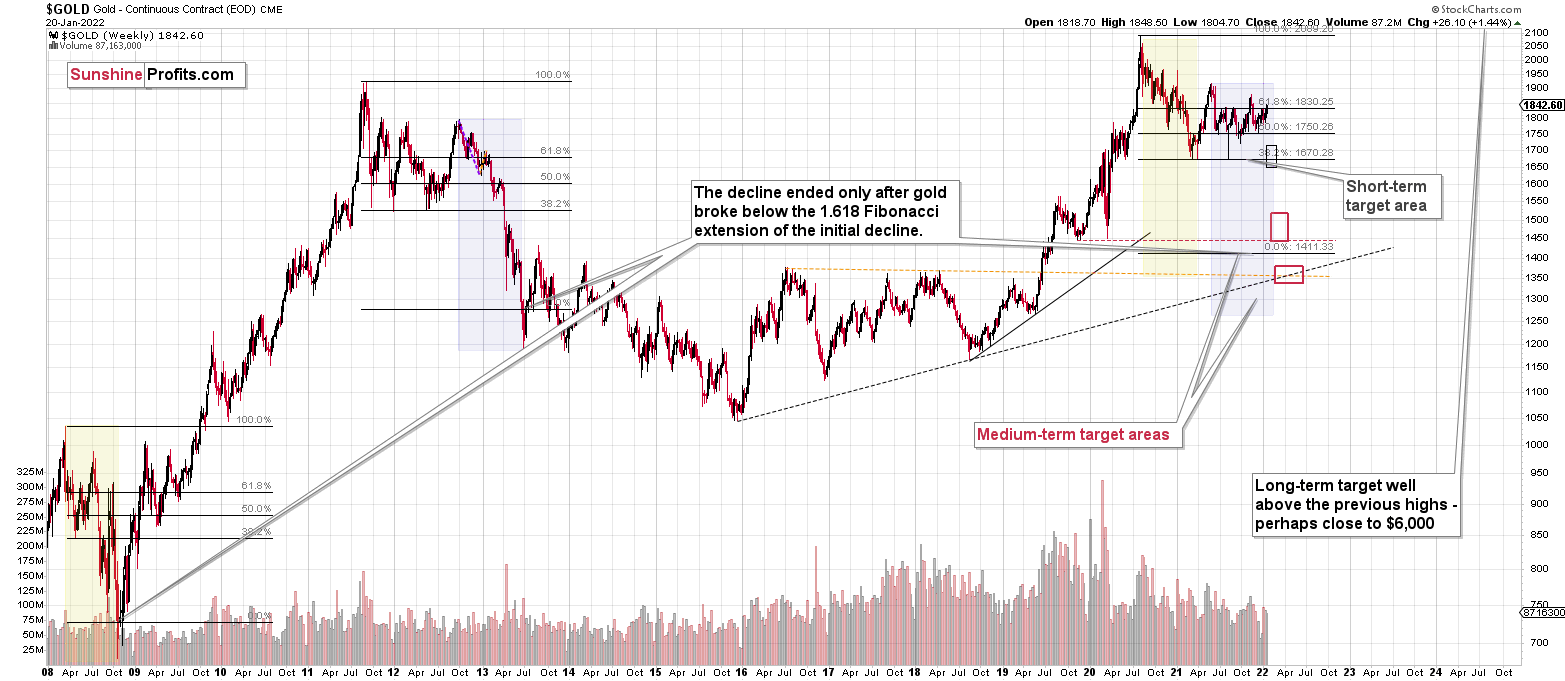
Please note that the above timing details are relatively broad and “for general overview only” – so that you know more or less what I think and how volatile I think the moves are likely to be – on an approximate basis. These time targets are not binding or clear enough for me to think that they should be used for purchasing options, warrants or similar instruments.
Letters to the Editor
Q: I read your answer to the letter to the editor about GDXD with interest. In light of the information that GDXD is only 25% in junior mining stocks, do you recommend terminating that position and buying JDST?
A: Before I provide my reply, I’d like to clarify that I’m providing no recommendations for any trades. I don’t know and can’t know what’s most appropriate for you. However, in each Alert, I’ve been quoting the same thing about GDXD – “3x leveraged – which is not suggested for most traders/investors due to the significant leverage.”
GDXD is a sophisticated and leveraged instrument, and it should not be used by anyone other than advanced / experienced traders who know and accept the risks. I consider myself to be quite knowledgeable in this area, and I chose not to use this tool, but to use JDST instead.
While this is not a recommendation or even really a reply, my observation here would be that if you have to ask, GDXD is probably not right, and it’s better to move out of it.
Summary
Summing up, it seems to me that the corrective upswing is over, and that gold, silver, and mining stocks are now likely to continue their medium-term decline.
Please note that if last week’s rally was indeed based on supposedly increased tensions regarding Ukraine, then it’s likely that this rally is not going to be significant, and it might already be over. The “supposedly shocking” news already hit the market, and without any real follow-up (material) action, like Russian troops marching across the border with Ukraine, it seems that there’s nothing additional that markets could rally on. The market already “knows” that the tensions are very high and the chance for military conflict is high, regardless of whether that’s true or not. There’s not much more that can be said to increase that even further – only real action is likely to do it – and seeing such action is very unlikely in my view.
I continue to think that junior mining stocks are currently likely to decline the most out of all parts of the precious metals sector.
From the medium-term point of view, the key two long-term factors remain the analogy to 2013 in gold and the broad head and shoulders pattern in the HUI Index. They both suggest much lower prices ahead.
It seems that our profits from the short positions are going to become truly epic in the following months.
After the sell-off (that takes gold to about $1,350 - $1,500), I expect the precious metals to rally significantly. The final part of the decline might take as little as 1-5 weeks, so it's important to stay alert to any changes.
Most importantly, please stay healthy and safe. We made a lot of money last March and this March, and it seems that we’re about to make much more on the upcoming decline, but you have to be healthy to enjoy the results.
As always, we'll keep you - our subscribers - informed.
To summarize:
Trading capital (supplementary part of the portfolio; our opinion): Full speculative short positions (300% of the full position) in junior mining stocks are justified from the risk to reward point of view with the following binding exit profit-take price levels:
Mining stocks (price levels for the GDXJ ETF): binding profit-take exit price: $34.63; stop-loss: none (the volatility is too big to justify a stop-loss order in case of this particular trade)
Alternatively, if one seeks leverage, we’re providing the binding profit-take levels for the JDST (2x leveraged) and GDXD (3x leveraged – which is not suggested for most traders/investors due to the significant leverage). The binding profit-take level for the JDST: $14.98; stop-loss for the JDST: none (the volatility is too big to justify a SL order in case of this particular trade); binding profit-take level for the GDXD: $25.48; stop-loss for the GDXD: none (the volatility is too big to justify a SL order in case of this particular trade).
For-your-information targets (our opinion; we continue to think that mining stocks are the preferred way of taking advantage of the upcoming price move, but if for whatever reason one wants / has to use silver or gold for this trade, we are providing the details anyway.):
Silver futures downside profit-take exit price: $19.12
SLV profit-take exit price: $17.72
ZSL profit-take exit price: $38.28
Gold futures downside profit-take exit price: $1,683
HGD.TO – alternative (Canadian) inverse 2x leveraged gold stocks ETF – the upside profit-take exit price: $11.79
HZD.TO – alternative (Canadian) inverse 2x leveraged silver ETF – the upside profit-take exit price: $29.48
Long-term capital (core part of the portfolio; our opinion): No positions (in other words: cash
Insurance capital (core part of the portfolio; our opinion): Full position
Whether you already subscribed or not, we encourage you to find out how to make the most of our alerts and read our replies to the most common alert-and-gold-trading-related-questions.
Please note that we describe the situation for the day that the alert is posted in the trading section. In other words, if we are writing about a speculative position, it means that it is up-to-date on the day it was posted. We are also featuring the initial target prices to decide whether keeping a position on a given day is in tune with your approach (some moves are too small for medium-term traders, and some might appear too big for day-traders).
Additionally, you might want to read why our stop-loss orders are usually relatively far from the current price.
Please note that a full position doesn't mean using all of the capital for a given trade. You will find details on our thoughts on gold portfolio structuring in the Key Insights section on our website.
As a reminder - "initial target price" means exactly that - an "initial" one. It's not a price level at which we suggest closing positions. If this becomes the case (like it did in the previous trade), we will refer to these levels as levels of exit orders (exactly as we've done previously). Stop-loss levels, however, are naturally not "initial", but something that, in our opinion, might be entered as an order.
Since it is impossible to synchronize target prices and stop-loss levels for all the ETFs and ETNs with the main markets that we provide these levels for (gold, silver and mining stocks - the GDX ETF), the stop-loss levels and target prices for other ETNs and ETF (among other: UGL, GLL, AGQ, ZSL, NUGT, DUST, JNUG, JDST) are provided as supplementary, and not as "final". This means that if a stop-loss or a target level is reached for any of the "additional instruments" (GLL for instance), but not for the "main instrument" (gold in this case), we will view positions in both gold and GLL as still open and the stop-loss for GLL would have to be moved lower. On the other hand, if gold moves to a stop-loss level but GLL doesn't, then we will view both positions (in gold and GLL) as closed. In other words, since it's not possible to be 100% certain that each related instrument moves to a given level when the underlying instrument does, we can't provide levels that would be binding. The levels that we do provide are our best estimate of the levels that will correspond to the levels in the underlying assets, but it will be the underlying assets that one will need to focus on regarding the signs pointing to closing a given position or keeping it open. We might adjust the levels in the "additional instruments" without adjusting the levels in the "main instruments", which will simply mean that we have improved our estimation of these levels, not that we changed our outlook on the markets. We are already working on a tool that would update these levels daily for the most popular ETFs, ETNs and individual mining stocks.
Our preferred ways to invest in and to trade gold along with the reasoning can be found in the how to buy gold section. Furthermore, our preferred ETFs and ETNs can be found in our Gold & Silver ETF Ranking.
As a reminder, Gold & Silver Trading Alerts are posted before or on each trading day (we usually post them before the opening bell, but we don't promise doing that each day). If there's anything urgent, we will send you an additional small alert before posting the main one.
Thank you.
Przemyslaw Radomski, CFA
Founder, Editor-in-chief

