

Briefly: in our opinion, full (300% of the regular position size) speculative short positions in mining stocks are justified from the risk/reward point of view at the moment of publishing this Alert.
Gold rallied visibly yesterday (May. 3) as the USD Index gave away some of Friday’s gains, sparking questions about whether this is actually bullish for gold. And rightfully so, after all, if a given market reacts to what it shouldn’t react to, it often tells us that the market wants to move in a certain direction. Let’s start with one of the questions I received:
Hi,
Thanks very much for your detailed reports. Just have a few observations and queries. On Friday we had the USD going up and Gold dropping a few dollars. Today we have again the USD continuing to go up, which is what you have been saying in your reports, but we also have Gold up $10. If you could help me understand why this is happening and how it fits into Gold going down as the USD goes up.
Thanks very much.
Let’s imagine that you’re about to go fishing with your friends, but you can’t ignore the fact that one of your friend’s behavior is odd, to say the least. While they are usually fine with your selection of the fishing spot and the time you arrived, today they are annoyed by both. They don’t even like the road that your GPS system set for the drive, not to mention your driving skills. Whatever you say, it makes them complain. You might be tempted to think that this person is actually not that friendly at all and perhaps this friendship’s status has changed.
But… What actually happened was they were up all night as their heater broke, spilling water on the entire apartment, and since it was this friend that insisted on mounting it themselves, they didn’t want to brag about this result. They also didn’t have time to eat anything before they met with you this morning.
What is obvious based on the context might have been very misleading without it.
It seems to me that we have the same kind of situation in gold right now. The context here is that it’s the very final part of the consolidation – the right shoulder of a broad head-and-shoulders pattern, and, at such tops, markets can behave erratically.
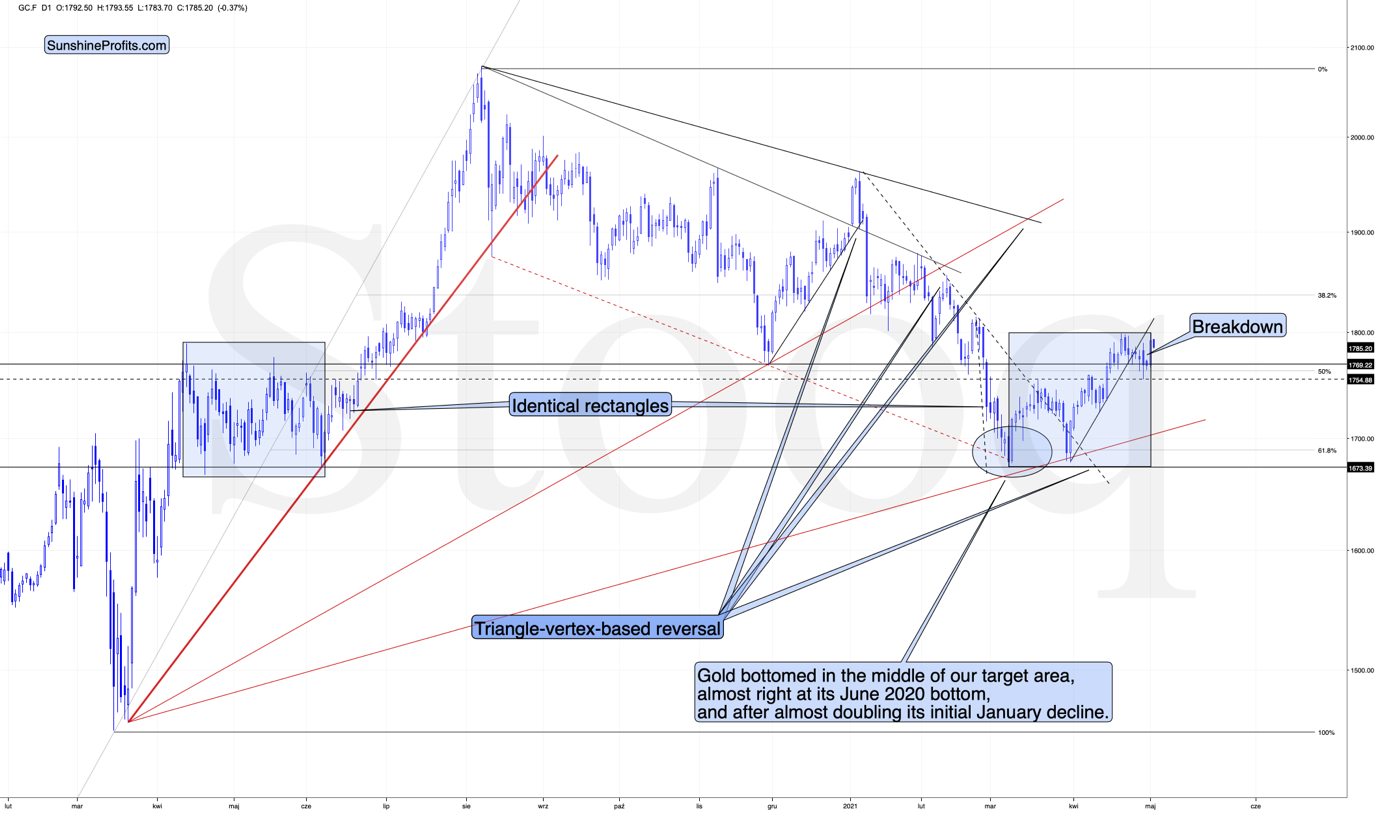
Based on the identical blue rectangles, it seems that we might have seen the end of the correction.
The breakdown below the short-term support line – along with its confirmation – provides us with bearish indications as well.
Did gold manage to break to new highs yesterday? No. So, did it change anything from the technical point of view? No, once again.
The only thing that might seem bullish here is gold’s performance relative to the USD Index, but if it is indeed the very end of the correction, then this kind of performance might be understandable. After all, that’s where the emotions are at the zenith.
Moreover, let’s keep in mind that yesterday was a bank holiday in some parts of the world, including one of the world’s financial centers – London. If there are any days during the year when the markets are much more likely to behave erratically than on other days, it’s during market holidays and options’ expiration days. We had the former yesterday.
The performance of some stock market indices seems to confirm that. For example, the Nasdaq (the previous strong leader) declined yesterday, while the broad market ended the day slightly higher (yesterday’s session in the S&P 500 was another daily reversal, though).
And how could that fit the situation in the USD Index?
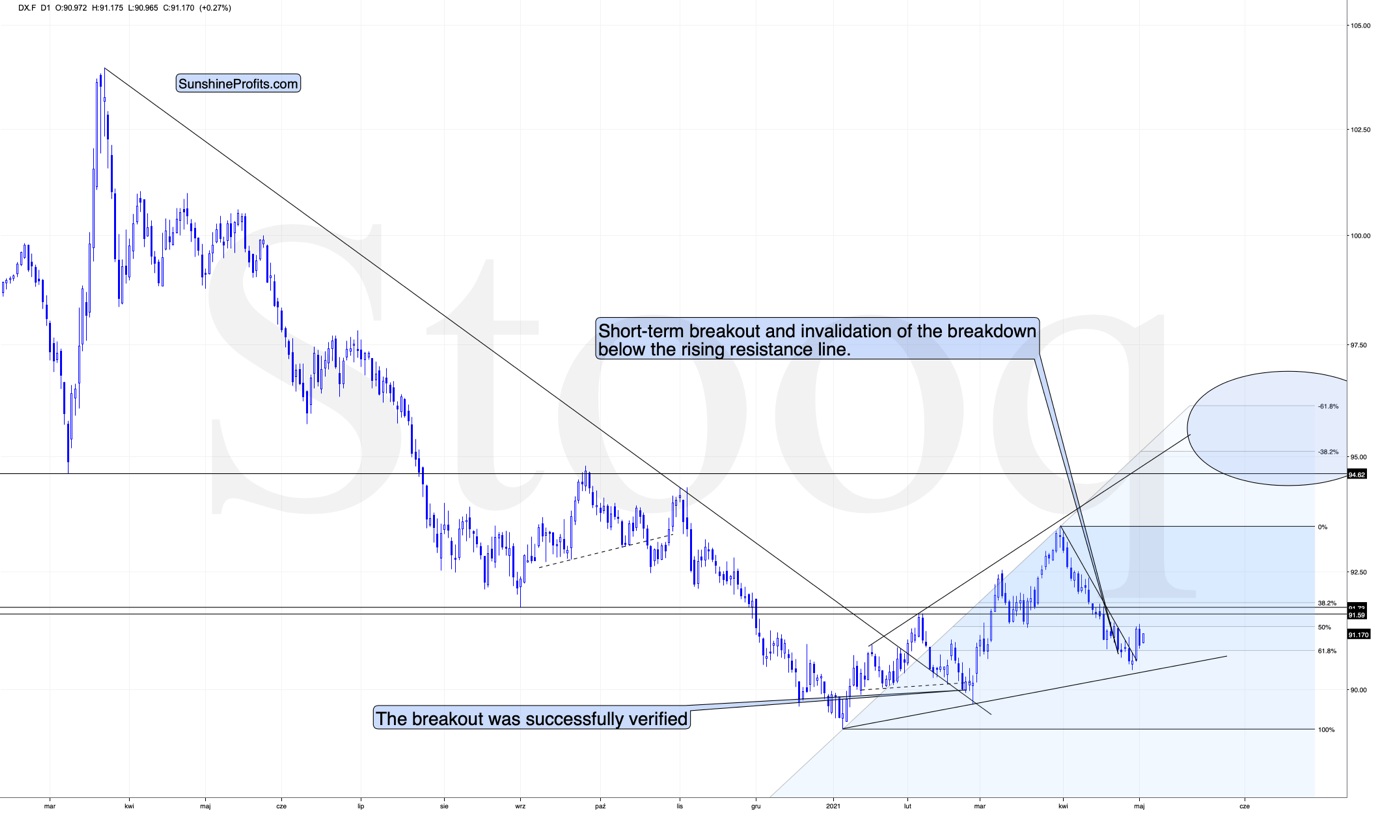
Well, the USDX is after a massive breakout, which means that it’s no wonder it corrected the move yesterday. And as it did, it’s also no wonder that gold traders assumed the USD’s rally was over. But the interpretation of the situation is likely to change as the USDX is moving back up today, and it seems that it’s about to confirm its breakout.
Now, if the USD Index keeps rallying for days and gold continues to show strength for days, we might be on to something bullish here. For now, it’s too early to say that.
Moreover, the gold-USD dynamic is not the only one that matters. While the links between gold and the USD Index as well as between gold and gold stocks often require confirmations, silver’s outperformance of gold is something that we usually see on a very short-term basis, and it’s an important sell signal without additional confirmations.
And while gold moved close to the recent highs but didn’t exceed them, silver moved visibly above them.
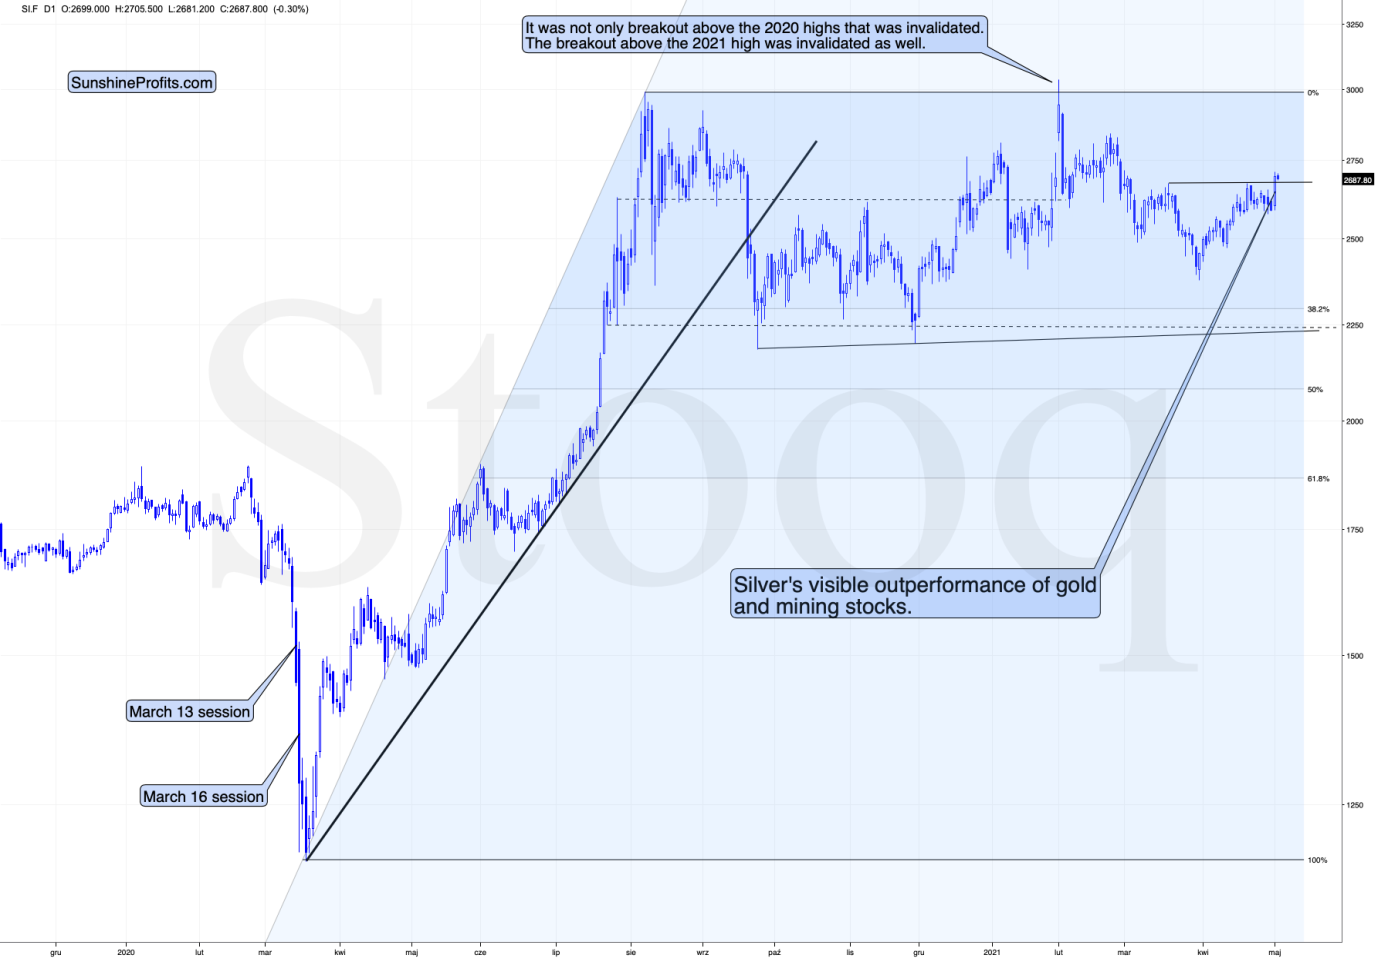
The silver price just outperformed gold on a very short-term basis, which is a great confirmation that yesterday’s session could have been the emotional peak – or a session that’s very close to such a peak.
While silver outperformed, miners underperformed.
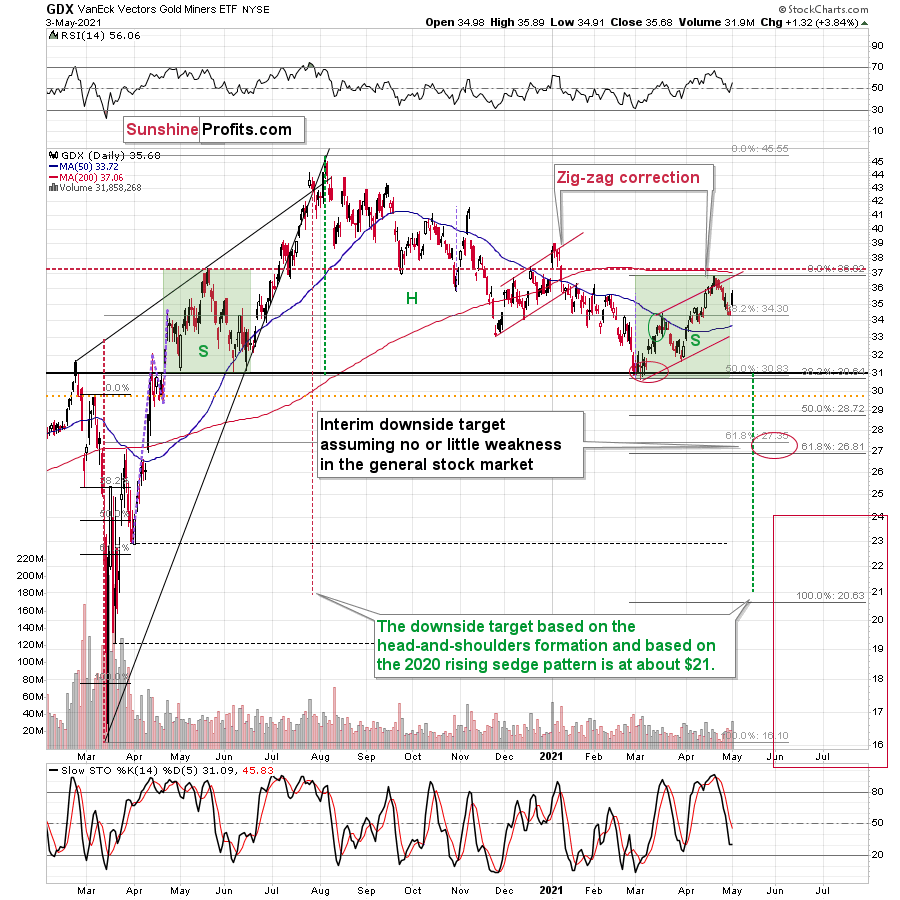
Silver moved above its recent high, gold moved very close to it without breaking higher, and mining stocks didn’t move close back to the said highs. Consequently, gold stocks have underperformed gold.
Overall, the implications from the relative performance appear more bearish than bullish at this time, and they support other bearish factors that I’ve been discussing in my previous analyses.
Having said that, let’s take a look at the markets from a more fundamental angle.
Nothing to See Here
With the EUR/USD pumping, dumping, and then pumping once again, the currency pair’s volatility highlights the fundamental frailty that’s underpinned its recent strength. After surging above its declining resistance line on Apr. 29 – following what investors perceived as dovish inaction by the U.S. Federal Reserve (FED) – the EUR/USD gave back all of those gains and then some more on Apr. 30.
And with battle lines drawn once again, the EUR/USD – which accounts for nearly 58% of the movement of the USD Index – is still struggling to prove its self-worth.
Please see below:
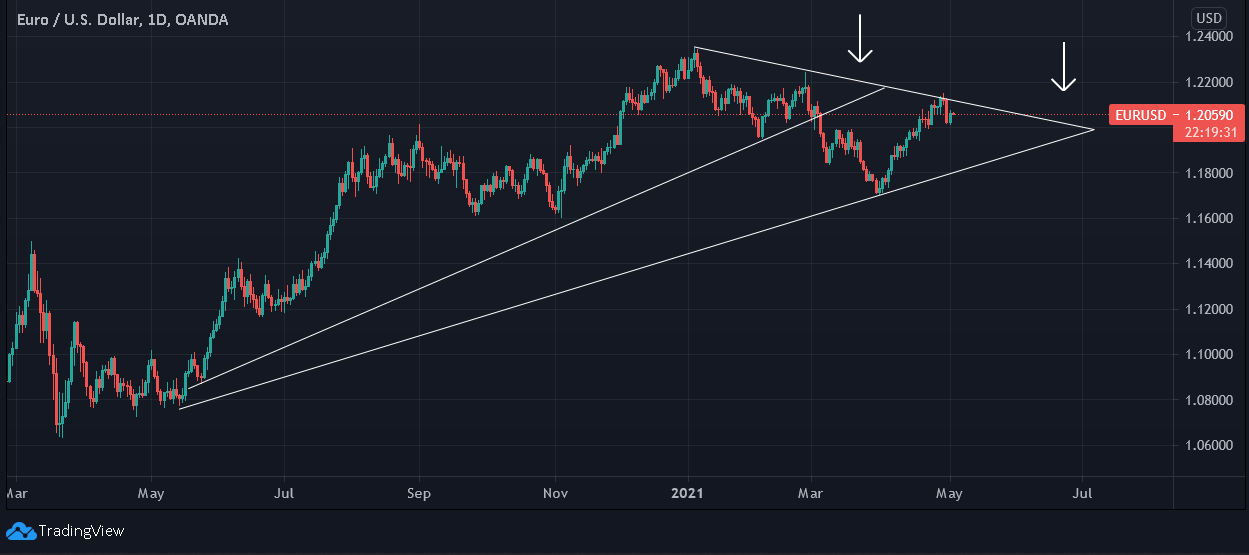
To explain, after attempting to break above its declining resistance line in February, the EUR/USD eventually rolled over and broke below its rising support line. Similarly, after bolting above its declining resistance line on Apr. 29, investors quickly sold the rally and the currency pair plunged by 0.82% on Apr. 30. As a result, with the EUR/USD rising on hope and falling on reality, history has shown that the latter is likely to reign supreme over the medium term.
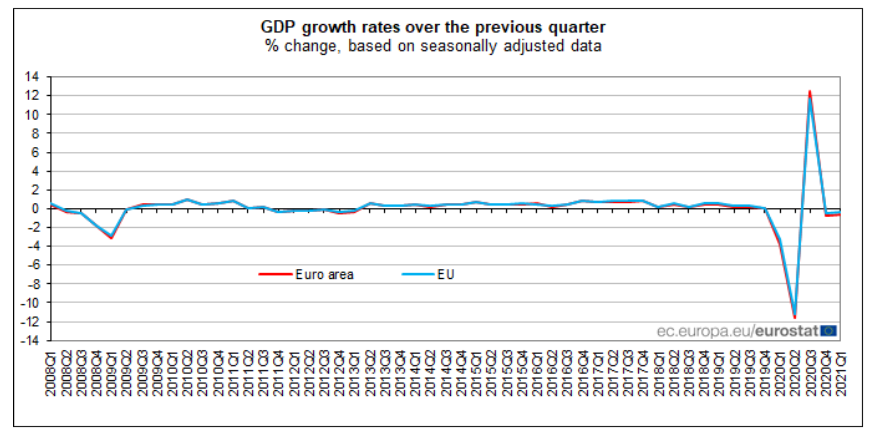
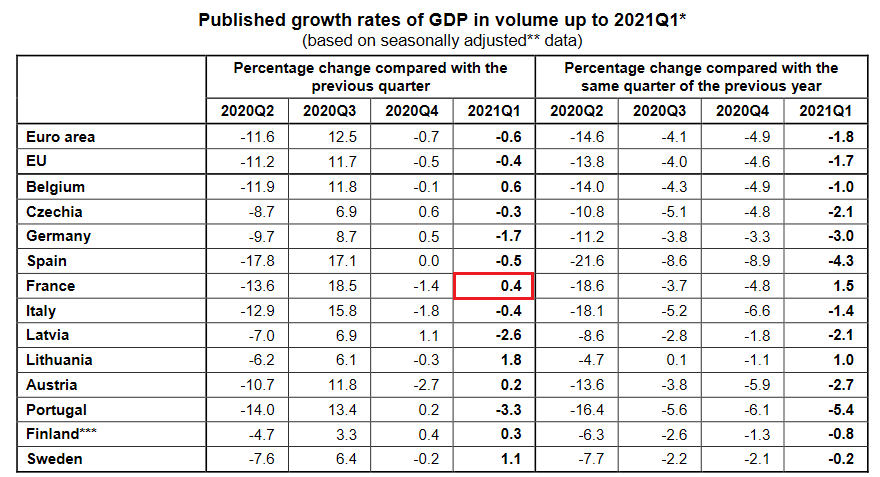
Headlining the EUR/USD’s sudden crisis of confidence, Eurozone GDP (released on Apr. 30) declined by 0.60% in the first quarter.
Please see below:
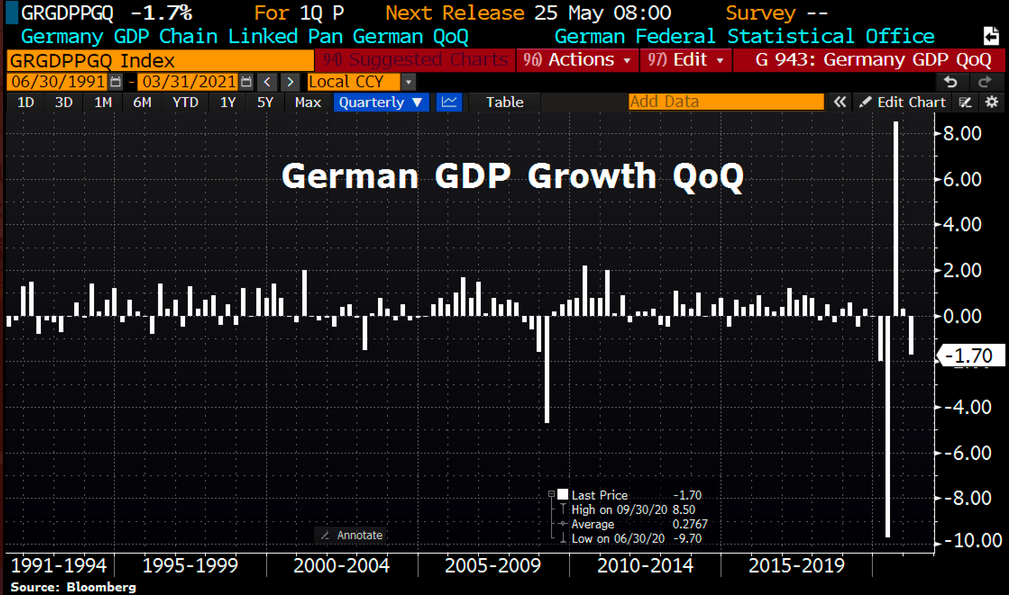
More importantly, though, German GDP (the Eurozone’s largest economy) declined by 1.70% in Q1, underperforming the bloc average and suffering the third-worst performance among member states. In addition, the – 1.70% print came in below economists’ consensus estimate of – 1.50%, and the milestone marked the third-worst quarter-over-quarter (QoQ) contraction since 2008.
Please see below:
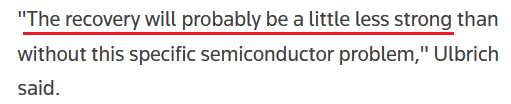
On top of that, with the semiconductor shortage weighing heavily on the German economy, automakers and electronics companies have slashed production and have been forced to recalibrate their supply chains. “We expect the problem with semiconductor shortages to worsen somewhat in the second quarter,” said Jens Ulbrich, chief economist at The Deutsche Bundesbank (the German central bank).
And according to Ulbrich, how will this affect the German economy in Q2?
 Source: Reuters
Eurozone Goes Its Own Way
If that wasn’t enough, France (Europe’s second-largest economy) was projected by the European Commission (on Feb. 11) to deliver 5.50% GDP growth in 2021 (and thereby be the Eurozone’s second-best performing economy). In point of fact, sure, 0.40% QoQ growth outperformed the bloc average (the red box below), but if the French economy continues at this pace for the rest of the year, France will only grow by 1.60% in 2021.
 Source: Eurostat
And while the EUR/USD continues to ignore the reality, U.S.-Eurozone growth differentials continue to widen. Case in point: after the U.S. posted 6.40% GDP growth in Q1, we’re not talking about expectations anymore – the two regions have actually materially diverged.
Please see below:
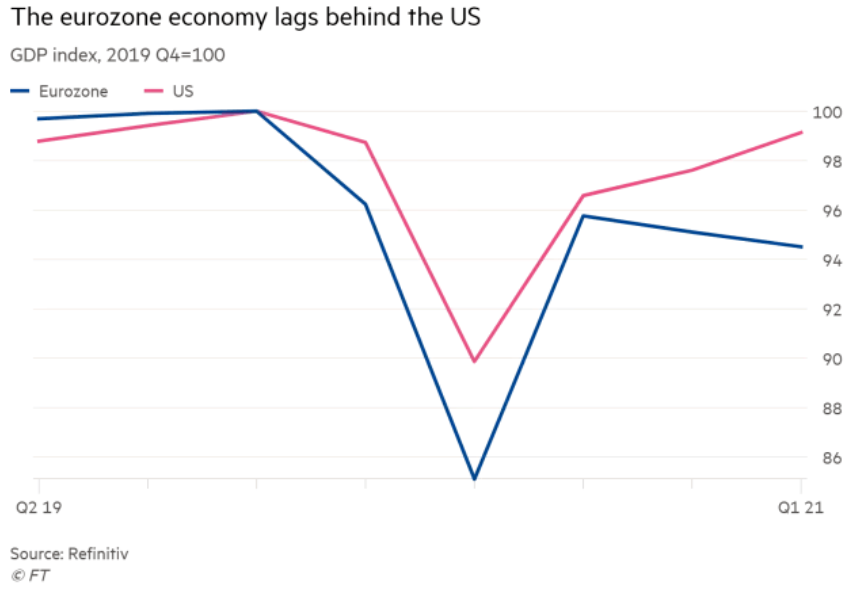
To explain, the pink line above tracks the ex-post (actual) U.S. GDP index, while the blue line above tracks the ex-post (actual) Eurozone GDP index. If you analyze the right side of the chart, you can see that while the U.S. economy inches closer to its pre-pandemic highs, the Eurozone economy is headed in the opposite direction.
And circling back to the former, not only are U.S. growth expectations drastically outperforming the Eurozone, but U.S. growth expectations are also outperforming the regions’ G9 peers. As a result, with the performance of the USD Index often tethered to the U.S. economy’s relative performance, it’s only a matter of time before the greenback reclaims its rightful place atop the currency mountain.
Please see below:
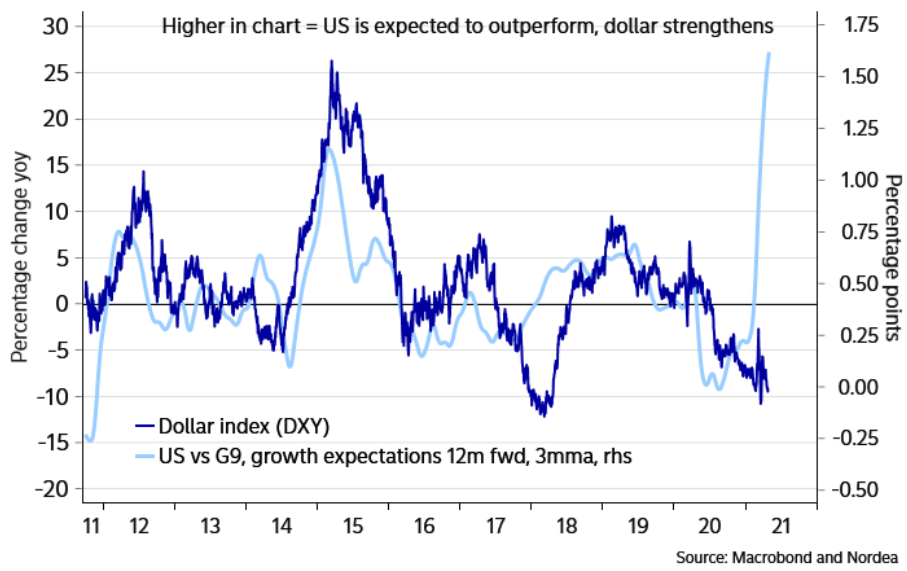 To explain, the dark blue line above tracks the performance of the USD Index, while the light blue line above tracks U.S-G9 relative growth expectations. As you can see, the USD Index tends to rise when U.S. growth prospects outperform G9 countries and tends to fall when G9 countries’ growth prospects outperform the U.S. Thus, with a material divergence clearly visible on the right side of the chart, reconnecting with the light blue line implies a USD Index north of 110.
ECB and the EUR/USD Ratio
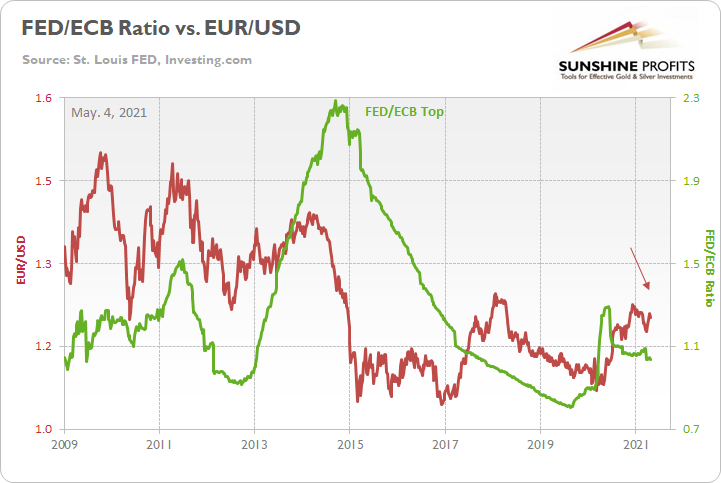
Adding another layer to the EUR/USD’s bearish dessert, the FED/ECB ratio has declined by nearly 5% over the last five weeks. And with the European Central Bank (ECB) continuing to out-print the FED, the EUR/USD’s recent strength defies historical norms. Thus, akin to the USD Index heading in the opposite direction of U.S.-G9 relative growth expectations, the EUR/USD is also heading in the opposite direction of the FED/ECB ratio.
Please see below:
In addition, while premature whispers of the ECB tapering its assets purchases have gone mainstream, the reality on the ground is completely different. Case in point: ECB Vice President Luis de Guindos said on May. 3 that “If by speeding up the vaccination campaign, we manage to have vaccinated 70% of Europe’s adult population by the summer and the economy starts to pick up speed, we may also start to think about phasing out the emergency mode on the monetary policy side.”
However, in stark contrast to the VP, it was less than three weeks ago that ECB President Christine Lagarde compared the Eurozone economy to a “patient which is out of a deep crisis but still on two crutches ….You don’t want to remove either crutch, the fiscal or the monetary, until the patient can actually walk fine, and to do that means support well into the recovery.”
On top of that, she added on Apr. 22:
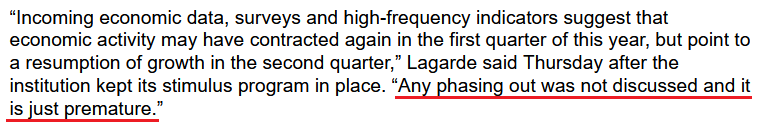 Source: Bloomberg
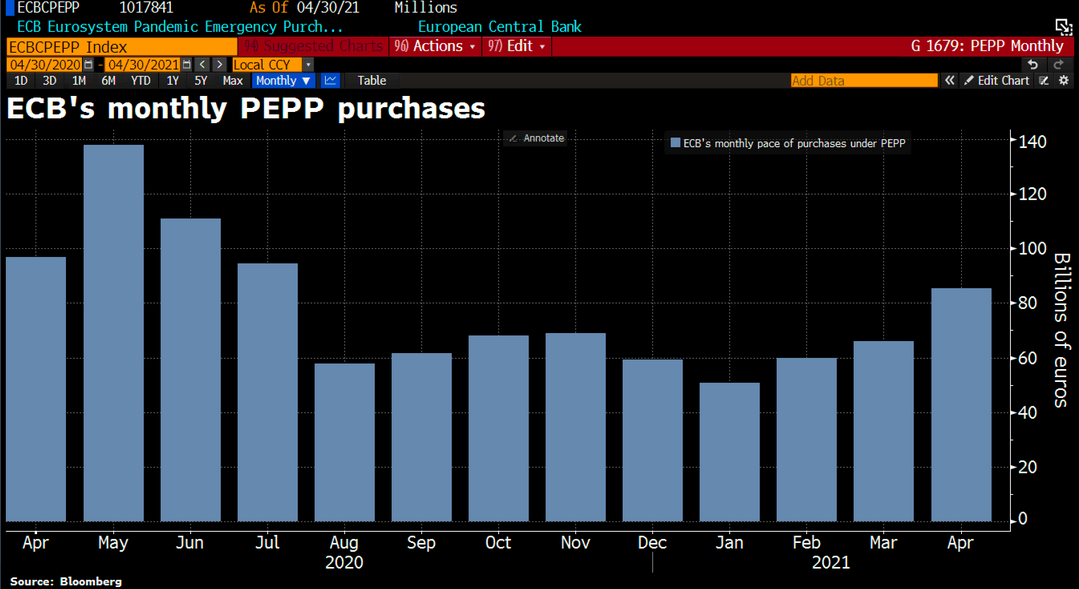
More importantly, though, and because actions speak louder than words, the ECB recorded €80 billion of monthly PEPP purchases in April, the highest monthly total since July 2020. Moreover, April’s splurge was a substantial increase from the roughly €60 billion of average monthly PEPP purchases recorded from August to March.
Please see below:
Finally, while I’ve outlined the USD Index’s 2017-2018 analogue in great detail, the EUR/USD is also following the same historical script.
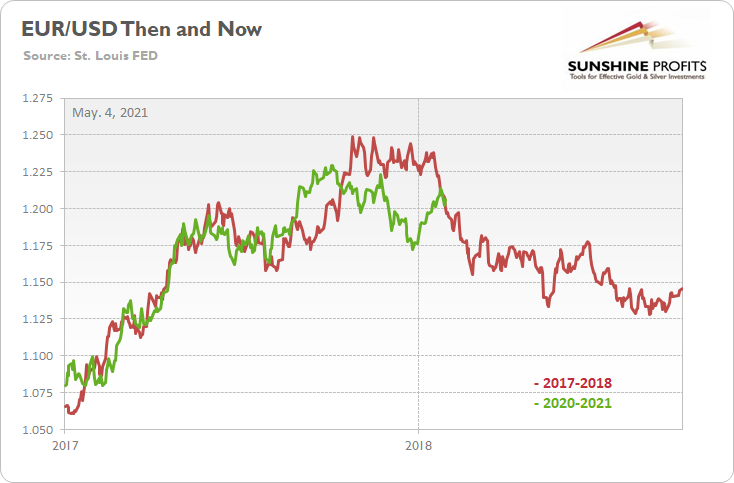
To explain, the green line above tracks the EUR/USD’s current price action, while the red line above tracks the currency pair’s movement in 2017-2018. As you can see, the EUR/USD had originally followed the historical analogue to a tee. However, while the green line has moved sharply higher in recent weeks – before moving sharply lower on Apr. 30 – notice how fits and starts were also a part of the story in 2017-2018? If you analyze the middle of the chart, you can see that the red line moved below 1.225 and then to 1.250 before eventually rolling over. As a result, the current bounce from below 1.175 to 1.206 is nothing to write home about.
In conclusion, the EUR/USD is in the midst of an epic battle between hope and reality. And with investors’ wishful thinking about Eurozone fundamentals clouding their short-term judgment, the currency pair’s upward momentum is the main driver behind the USD Index’s recent weakness. However, with short-term optimism likely to fade to medium-term acceptance, chopping down the EUR/USD tree requires one hack at a time. More importantly, though, once the medium-term implications are accurately priced into the currency pair – and indirectly, into the USD Index – the falling timber will land directly on the precious metals. Thus, while the sentiment surge helped propel the PMs on May. 3, they’re far from out of the woods. As a result, caution is warranted before venturing too far into the forest.
Overview of the Upcoming Part of the Decline
- It seems likely to me that the corrective upswing was already completed . Consequently, it seems that the next big move lower is already underway.
- After miners slide once again in a meaningful and volatile way, but silver doesn’t (and it just declines moderately), I plan to switch from short positions in miners to short positions in silver (this could take another 1-2 weeks to materialize). I plan to exit those short positions when gold shows substantial strength relative to the USD Index, while the latter is still rallying. This might take place with gold close to $1,450 - $1,500 and the entire decline (from above $1,700 to about $1,475) would be likely to take place within 1-12 weeks, and I would expect silver to fall hardest in the final part of the move. This moment (when gold performs very strongly against the rallying USD and miners are strong relative to gold – after gold has already declined substantially) is likely to be the best entry point for long-term investments, in my view. This might happen with gold close to $1,475, but it’s too early to say with certainty at this time. In other words, the entire decline could take between 1 and 12 weeks, with silver declines occurring particularly fast in the final 1-2 weeks.
- If gold declines even below $1,500 (say, to ~$1350 or so), then it could take another 10 weeks or so for it to bottom, but this is not what I view as a very likely outcome.
- As a confirmation for the above, I will use the (upcoming or perhaps we have already seen it?) top in the general stock market as the starting point for the three-month countdown. The reason is that after the 1929 top, gold miners declined for about three months after the general stock market started to slide. We also saw some confirmations of this theory based on the analogy to 2008. All in all, the precious metals sector would be likely to bottom about three months after the general stock market tops. If the last week’s highs in the S&P 500 and NASDAQ were the final highs, then we might expect the precious metals sector to bottom in the middle of the year – in late July or in August
- The above is based on the information available today, and it might change in the following days/weeks.
Please note that the above timing details are relatively broad and “for general overview only” – so that you know more or less what I think and how volatile I think the moves are likely to be – on an approximate basis. These time targets are not binding or clear enough for me to think that they should be used for purchasing options, warrants or similar instruments.
Summary
To summarize, the PMs’ medium-term decline is well underway, and based on the recent performance of the USD Index, gold and mining stocks, it seems that the corrective upswing is already over. The confirmed breakout in the USD Index is yet another confirmation of the bearish outlook for the precious metals market, and the same goes for the symmetric nature of the potential broad head-and-shoulders in gold and gold stocks.
After the sell-off (that takes gold to about $1,450 - $1,500), we expect the precious metals to rally significantly. The final part of the decline might take as little as 1-5 weeks, so it's important to stay alert to any changes.
Most importantly, please stay healthy and safe. We made a lot of money last March and this March, and it seems that we’re about to make much more on the upcoming decline, but you have to be healthy to enjoy the results.
As always, we'll keep you - our subscribers - informed.
By the way, we’re currently providing you with a possibility to extend your subscription by a year, two years or even three years with a special 20% discount. This discount can be applied right away, without the need to wait for your next renewal – if you choose to secure your premium access and complete the payment upfront. The boring time in the PMs is definitely over and the time to pay close attention to the market is here. Naturally, it’s your capital, and the choice is up to you, but it seems that it might be a good idea to secure more premium access now, while saving 20% at the same time. Our support team will be happy to assist you in the above-described upgrade at preferential terms – if you’d like to proceed, please contact us.
To summarize:
Trading capital (supplementary part of the portfolio; our opinion): Full speculative short positions (300% of the full position) in mining stocks are justified from the risk to reward point of view with the following binding exit profit-take price levels:
Mining stocks (price levels for the GDXJ ETF): binding profit-take exit price: $24.12; stop-loss: none (the volatility is too big to justify a stop-loss order in case of this particular trade)
Alternatively, if one seeks leverage, we’re providing the binding profit-take levels for the JDST (2x leveraged) and GDXD (3x leveraged – which is not suggested for most traders/investors due to the significant leverage). The binding profit-take level for the JDST: $39.87; stop-loss for the JDST: none (the volatility is too big to justify a SL order in case of this particular trade); binding profit-take level for the GDXD: $94.87; stop-loss for the GDXD: none (the volatility is too big to justify a SL order in case of this particular trade).
For-your-information targets (our opinion; we continue to think that mining stocks are the preferred way of taking advantage of the upcoming price move, but if for whatever reason one wants / has to use silver or gold for this trade, we are providing the details anyway.):
Silver futures upside profit-take exit price: unclear at this time - initially, it might be a good idea to exit, when gold moves to $1,512.
Gold futures upside profit-take exit price: $1,512.
Long-term capital (core part of the portfolio; our opinion): No positions (in other words: cash
Insurance capital (core part of the portfolio; our opinion): Full position
Whether you already subscribed or not, we encourage you to find out how to make the most of our alerts and read our replies to the most common alert-and-gold-trading-related-questions.
Please note that we describe the situation for the day that the alert is posted in the trading section. In other words, if we are writing about a speculative position, it means that it is up-to-date on the day it was posted. We are also featuring the initial target prices to decide whether keeping a position on a given day is in tune with your approach (some moves are too small for medium-term traders, and some might appear too big for day-traders).
Additionally, you might want to read why our stop-loss orders are usually relatively far from the current price.
Please note that a full position doesn't mean using all of the capital for a given trade. You will find details on our thoughts on gold portfolio structuring in the Key Insights section on our website.
As a reminder - "initial target price" means exactly that - an "initial" one. It's not a price level at which we suggest closing positions. If this becomes the case (like it did in the previous trade), we will refer to these levels as levels of exit orders (exactly as we've done previously). Stop-loss levels, however, are naturally not "initial", but something that, in our opinion, might be entered as an order.
Since it is impossible to synchronize target prices and stop-loss levels for all the ETFs and ETNs with the main markets that we provide these levels for (gold, silver and mining stocks - the GDX ETF), the stop-loss levels and target prices for other ETNs and ETF (among other: UGL, GLL, AGQ, ZSL, NUGT, DUST, JNUG, JDST) are provided as supplementary, and not as "final". This means that if a stop-loss or a target level is reached for any of the "additional instruments" (GLL for instance), but not for the "main instrument" (gold in this case), we will view positions in both gold and GLL as still open and the stop-loss for GLL would have to be moved lower. On the other hand, if gold moves to a stop-loss level but GLL doesn't, then we will view both positions (in gold and GLL) as closed. In other words, since it's not possible to be 100% certain that each related instrument moves to a given level when the underlying instrument does, we can't provide levels that would be binding. The levels that we do provide are our best estimate of the levels that will correspond to the levels in the underlying assets, but it will be the underlying assets that one will need to focus on regarding the signs pointing to closing a given position or keeping it open. We might adjust the levels in the "additional instruments" without adjusting the levels in the "main instruments", which will simply mean that we have improved our estimation of these levels, not that we changed our outlook on the markets. We are already working on a tool that would update these levels daily for the most popular ETFs, ETNs and individual mining stocks.
Our preferred ways to invest in and to trade gold along with the reasoning can be found in the how to buy gold section. Furthermore, our preferred ETFs and ETNs can be found in our Gold & Silver ETF Ranking.
As a reminder, Gold & Silver Trading Alerts are posted before or on each trading day (we usually post them before the opening bell, but we don't promise doing that each day). If there's anything urgent, we will send you an additional small alert before posting the main one.
Thank you.
Przemyslaw Radomski, CFA
Founder, Editor-in-chief

