

Briefly: in our opinion, full (300% of the regular position size) speculative short positions in mining stocks are justified from the risk/reward point of view at the moment of publishing this Alert.
Yesterday’s session provided us with a perfect confirmation of the bearish case in the precious metals sector for the short term.
The reason is that what happened was bearish in two ways:
- Nothing happened in gold
- Daily declines in mining stocks
Short Term: Miners Still Looking Weak
First, the decline in mining stocks. A price action following a confirmed breakdown was exactly what I expected to happen to both junior miners and senior miners.
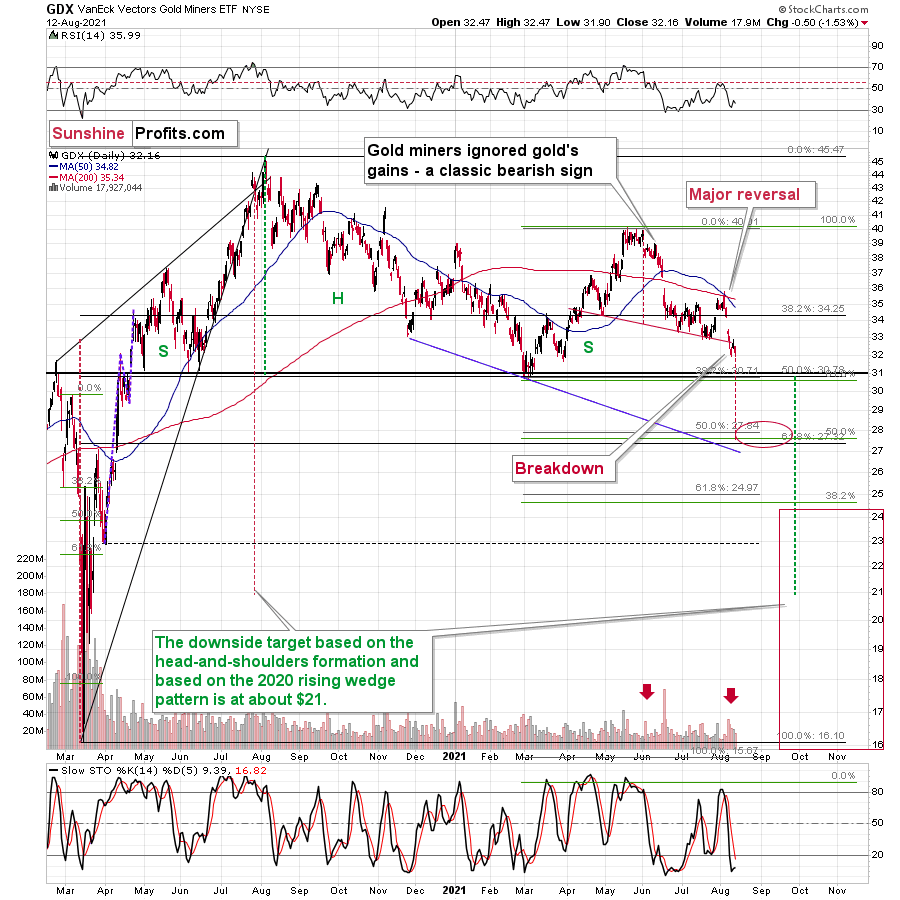
Senior miners – the GDX ETF – declined after verifying the breakdown below the neck level of the head and shoulders pattern.
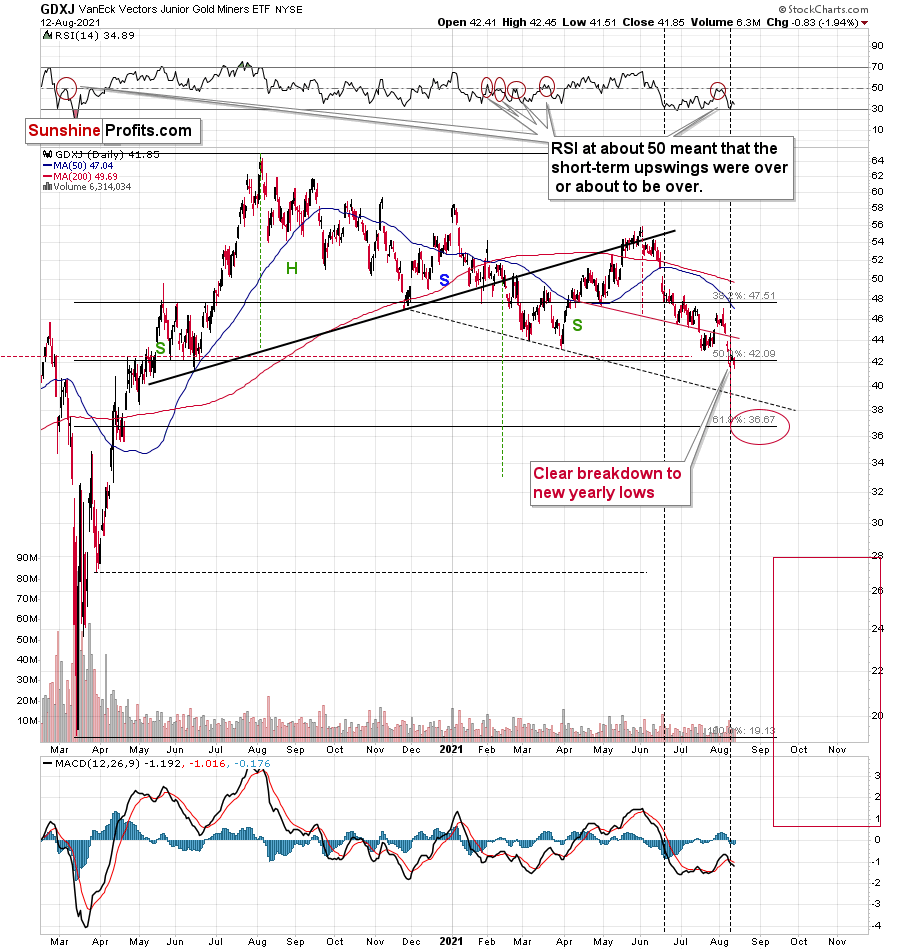
Junior miners – the GDXJ ETF – declined after verifying the breakdown to new yearly lows.
Both are very bearish on their own as the confirmed breakdowns imply that another – bigger – short-term slide is about to start.
But they are even more bearish when compared to what happened in gold.
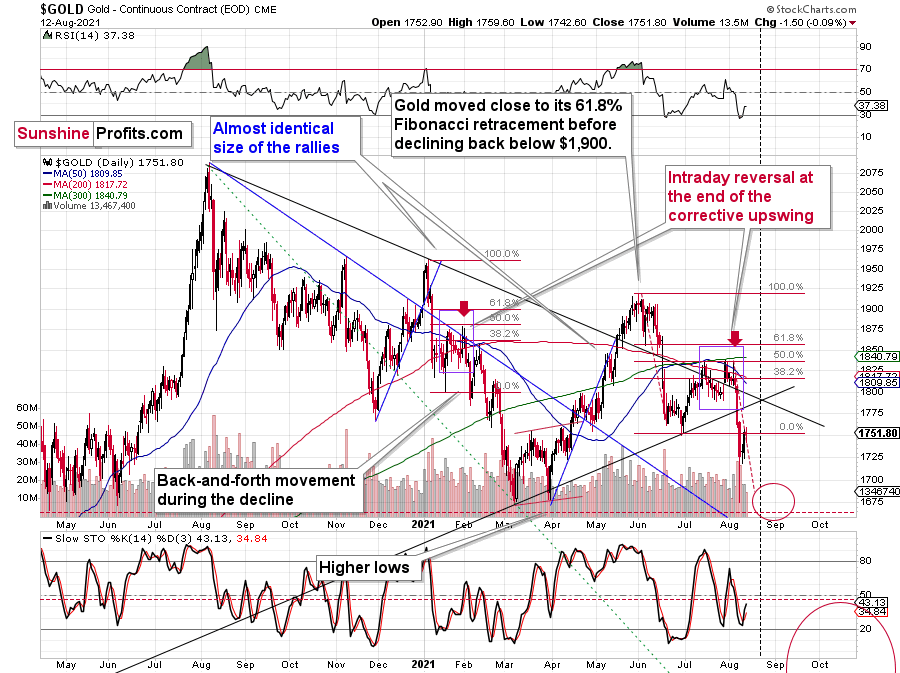
Nothing happened in the case of the gold price, which means that miners had no good reason to decline yesterday. Well, except for the reason that they have been in a medium-term downtrend and due to myriads of technical reasons that I discussed previously. However, on a day-to-day basis, since gold didn’t move, miners shouldn’t have moved either, if their outlook was at least neutral.
Their outlook, however, is not neutral. It’s clearly bearish as they showed weakness relative to gold. What just happened is the exact opposite of what one should see at or after an important bottom – at that time gold stocks should outperform gold.
Consequently, the precious metals sector is likely to slide shortly, and profits from our short positions in the junior miners are likely to increase sooner rather than later.
That’s as far as the short-term implications are concerned.
Gold and Bitcoin: What’s in It for Me?
There is something else that I’d like to share with you today, though. I previously wrote that there’s a tendency for gold and bitcoin to move in the opposite directions in the short run, despite that they both moved higher in the long term – since 2014. I wrote that I’ll get back to this topic at some later date – and that day is today.
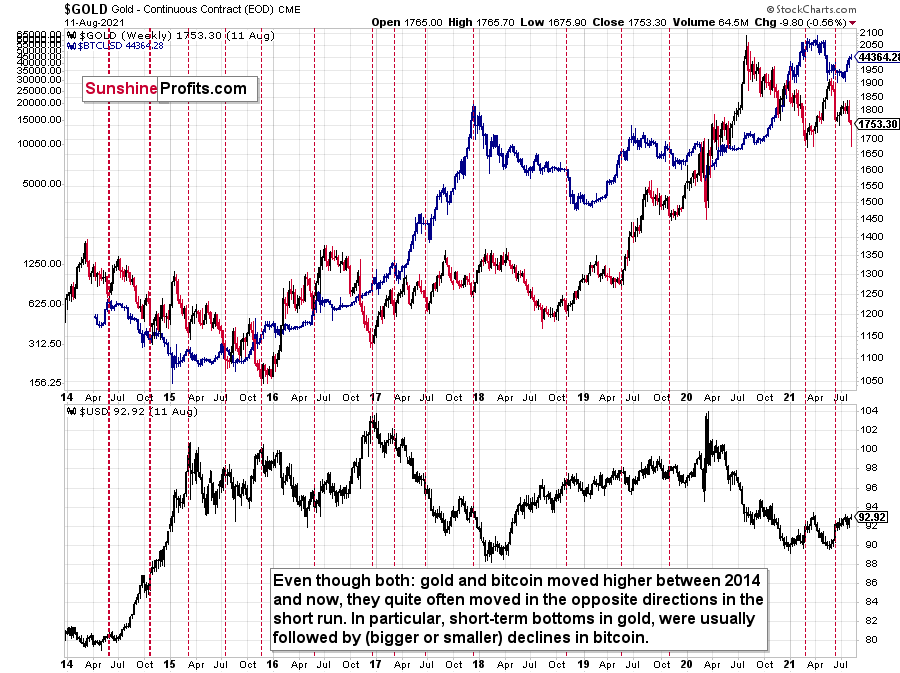
The upper part of the above chart features gold (regular colors) and bitcoin (blue), and the lower part of the chart features the USD Index.
At first glance, the performance of gold and bitcoin doesn’t seem to be that connected, besides the fact that they both moved higher in recent years. However, taking a closer look reveals that the link between them is not only present, but it’s actually quite strong.
I used the vertical, dashed lines to mark the moments when gold formed short-term bottoms and when bitcoin responded with declines. There were multiple cases like that! What’s remarkable is that even if bitcoin was soaring, it managed to correct a bit when gold was regaining strength. There were also some cases when bitcoin did nothing after gold’s bottom, but the moments when bitcoin ignored gold’s bottom and just continued to rally were rare.
I marked the first two (2014) cases with bold lines as that’s when the USD Index had been rallying particularly strongly. Since it seems that the USDX is starting a sizable upswing, these analogies might be most important.
Bitcoin declined in 2014 and the decline took the form of two smaller declines. One of them started close to the middle of the year (practically right at the vertical line) and the second started in the final few months of the year. What is most interesting, is that both bitcoin declines started when gold was forming short-term bottoms.
Bitcoin has been on the rise in the last several days, and given what we saw in gold – and in light of the above-discussed link – it’s perfectly normal, since gold has been declining (the recent pause seems too small to trigger any price moves). But most importantly, it tells us that when gold rebounds, it could be bitcoin’s chance to slide.
The 2014 decline might not seem like a big deal on the above chart, but that is only due to the perspective. When you look at the prices (the axis on the left side of the chart), you’ll see that bitcoin actually declined from about $600 to about $150. In other words, its price was reduced fourfold. That’s a huge decline. And a huge opportunity for those who are able to see it in advance.
This might or might not provide us with a great shorting opportunity in case of bitcoin, when gold rebounds (likely close to the previous 2021 lows), increasing this year’s profits, but it’s too early to say so with certainty at this time. I’ll keep looking for confirmations and I’ll report accordingly.
Having said that, let’s take a look at the market from a more fundamental angle.
The Dry Season
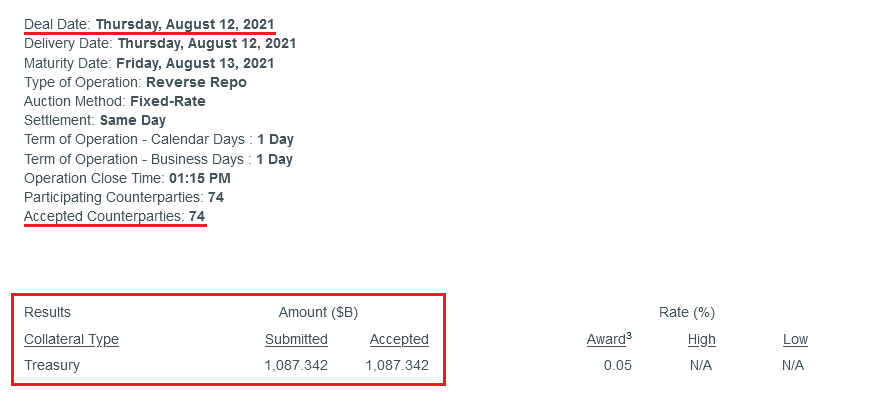
With the USD Index rising once again on Aug. 12, the greenback’s fundamentals remain robust. Case in point: while I’ve been warning about the U.S. Federal Reserve’s (FED) daily reverse repurchase agreements for some time, the facility hit a new all-time high on Aug. 12. And with the liquidity drain extremely bullish for the USD Index – due to the lower supply of U.S. dollars in the system – QE has become much more semblance than substance.
Please see below:
 Source: New York FED
To explain, a reverse repurchase agreement (repo) occurs when an institution offloads cash to the FED in exchange for a Treasury security (on an overnight or short-term basis). And with U.S. financial institutions currently flooded with excess liquidity, they’re shipping cash to the FED at an alarming rate.
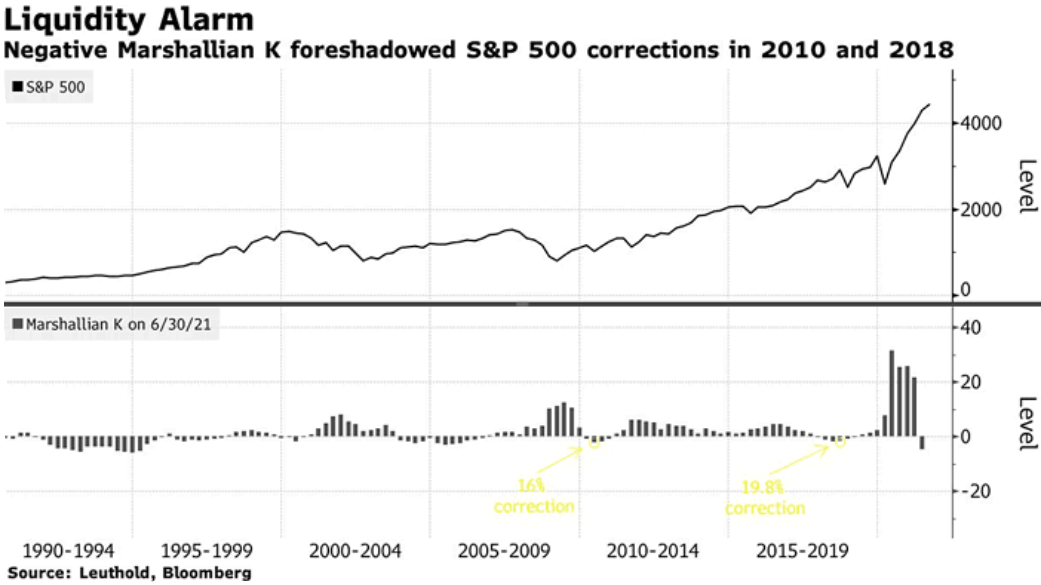
Adding to the anxiety, with The Marshallian K – which is calculated by dividing the U.S. M2 money supply by U.S. GDP – falling into negative territory, the development could have a profound impact on the S&P 500, and in turn, the USD Index. For example, Doug Ramsey, CIO at The Leuthold Group, is already sounding the alarm. He wrote:
“The recovering economy is now drinking from a punch bowl that the stock market once had all to itself. The Marshallian K now shows liquidity not only deteriorating but actually contracting – and at a time when hopes (as embedded in valuations) have never been higher. If the Fed can drawdown QE in the next year without triggering a decline of those levels, it will truly have achieved something remarkable. But we’d rather invest based on the probable.”
For context, the last two times The Marshallian K turned negative, the S&P 500 suffered material corrections and the USD Index recorded material rallies.
Please see below:
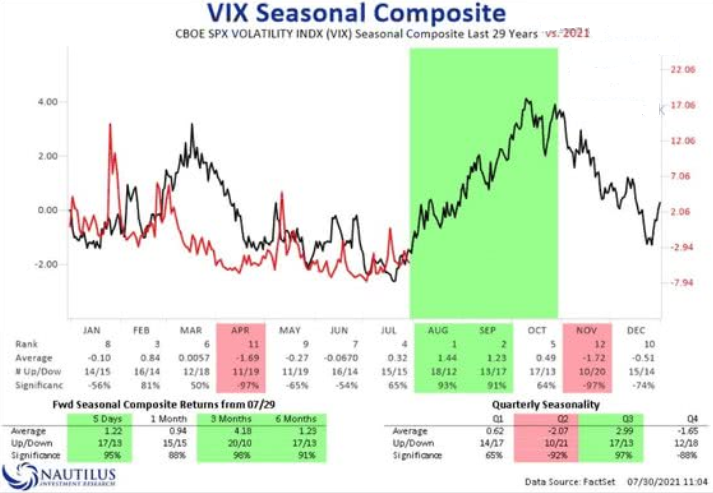
What’s more, seasonal patterns also signal heightened volatility ahead. To explain, the Cboe Volatility Index (VIX) – which measures the expected volatility in the S&P 500 over the next 30 days – often makes its presence felt in August and September (the green area below). And with the S&P 500 at an all-time high and the VIX at a 2021 low, a spike in volatility could light a fire under the USD Index.
Please see below:
On top of that, the NASDAQ Composite – which is momentum investors’ favorite index – has seen its breadth plummet in recent weeks. And with a small cohort of stocks doing all of the heavy lifting, prior historical divergences often resulted in substantial pullbacks.
Please see below:

To explain, the dark blue line above tracks the NASDAQ Composite, while the light blue line above tracks the percentage of NASDAQ constituents trading above their 50-day moving average (MA). If you analyze the right side of the chart, you can see that the light blue line is near its 2021 lows. Moreover, the last three readings of this magnitude resulted in material declines for the index and its strength on the surface doesn’t reflect the destruction that’s occurred underneath.
In addition, with the current reading offering new meaning to the phrase ‘America First,’ the S&P 500’s outperformance of emerging markets is approaching an all-time high. For context, the chart below depicts the ratio of emerging market equities to the S&P 500 and a falling blue line represents greater outperformance by the S&P 500.
Please see below:
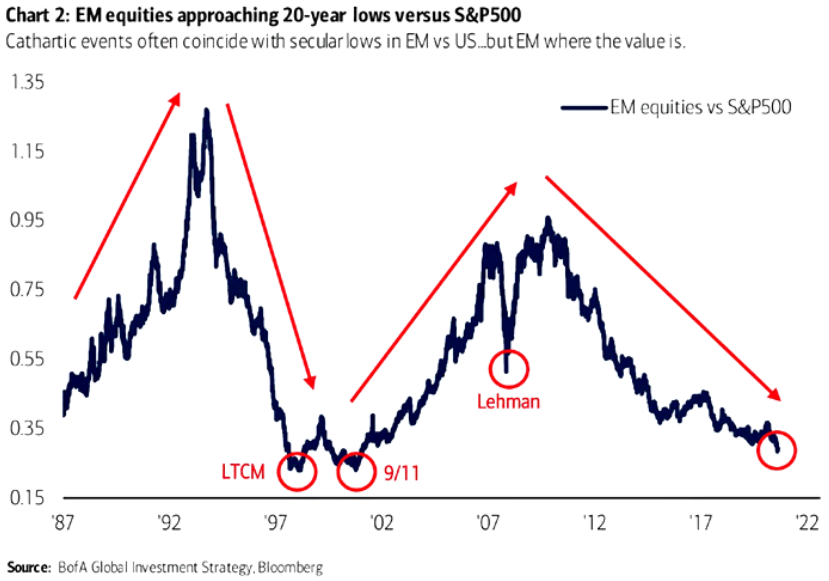
To explain, secular lows in the EM/S&P 500 ratio were recorded prior to the blow up of hedge fund Long-Term Capital Management (LTCM), prior to 9/11 and prior to the global financial crisis (GFC). And with investors once again throwing caution to the wind, it’s only a matter of time before a sharp reversal occurs.
Likewise, the S&P 500 is also trading more than 11% above its 200-day MA and prior bouts of optimism often ended with meaningful corrections.
Please see below:
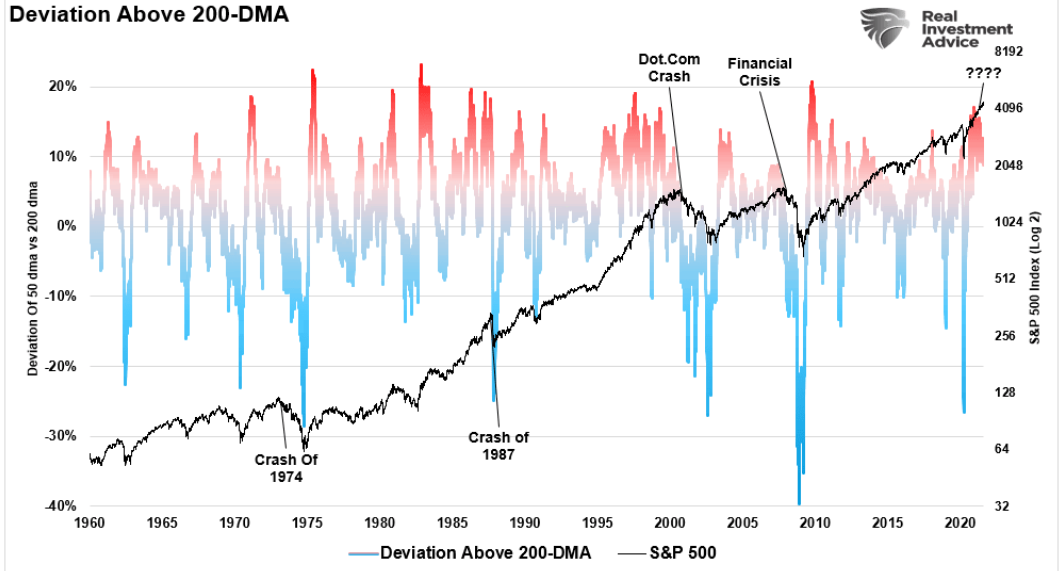
To explain, the black line above tracks the S&P 500, while the red/blue line above tracks how far (percentage wise) the S&P 500 is above/below its 200-day MA. If you analyze the right side of the chart, you can see that the current reading is near the high-end of its historical range. And while readings near or in excess of 20% have occurred on occasion, at 11%, sentiment is still extremely stretched.
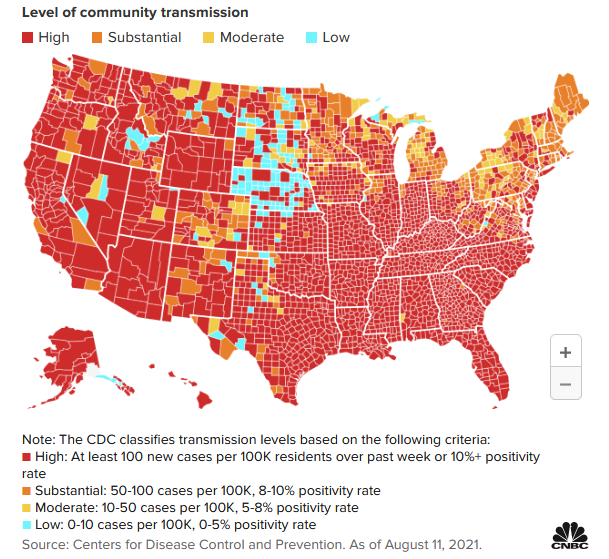
And while the wheels are in motion, extreme valuations, deteriorating sentiment and faltering liquidity are emerging at a time when the Delta variant is exploding across the U.S. Case in point: Dr. Rochelle Walensky, director of the Centers for Disease Control and Prevention (CDC), said the following on Aug. 12:
“We continue to see cases, hospitalizations and deaths increase across the country and now, over 90% of counties in the United States are experiencing substantial or high transmission.”
Please see below:
On top of that, the International Energy Agency (IEA) also reduced its oil demand outlook on Aug. 12, with its statement reading: “We now estimate that demand fell in July as the rapid spread of the COVID-19 Delta variant undermined deliveries in China, Indonesia and other parts of Asia."
"Growth for the second half of 2021 has been downgraded more sharply, as new COVID-19 restrictions imposed in several major oil consuming countries, particularly in Asia, look set to reduce mobility and oil use."
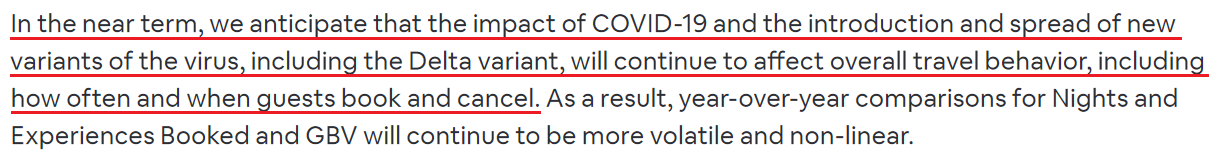
Finally, Airbnb – an online marketplace for lodging and vacation rentals – warned investors on Aug. 12 that the Delta variant has already disrupted its business. During its second-quarter earnings call, CFO Dave Stephenson said that ““as we exit Q2 and come into Q3, we have a combination of fewer bookings for the fall, just given the nature of some of the seasonality, and any kind of impact potentially on COVID concerns.”
Moreover, while the company’s shareholder letter read that “looking forward, we believe Airbnb is well positioned for the continued travel recovery,” management wrote that it could be a bumpy ride:
 Source: Airbnb
The bottom line? With a myriad of risks lurking in the shadows, the combination of fundamental overvaluation, technical destruction and liquidity evaporation has the general stock market playing with fire. More importantly, though, if a spark ignites across U.S. equities, the USD Index will likely be the main beneficiary – at least in the short term. The precious metals market is likely to be a major benefactor of the turmoil and stagflation – in the long term.
In conclusion, gold mining stocks renewed their underperformance of gold on Aug. 12 and cross-asset headwinds signal further downside ahead. With both the USD Index and the U.S. 10-Year Treasury yield rallying on Aug. 6, the PMs’ main foes still have the wind at their backs. Moreover, with the FED’s daily reverse repos more than offsetting the ~120 billion worth of QE per month, the reality is that more liquidity is exiting the system than entering it. As a result, while the PMs will likely encounter heavy resistance from investors in the coming months, if the general stock market slides, the drawdown could be all the more painful.
Overview of the Upcoming Part of the Decline
- The corrective upswing in gold is over, and the big decline seems to be already underway.
- After miners slide in a meaningful and volatile way, but silver doesn’t (and it just declines moderately), I plan to switch from short positions in miners to short positions in silver. At this time, it’s too early to say at what price levels this would take place – perhaps with gold close to $1,600. I plan to exit those short positions when gold shows substantial strength relative to the USD Index, while the latter is still rallying. This might take place with gold close to $1,350 - $1,500 and the entire decline (from above $1,900 to about $1,475) would be likely to take place within 6-20 weeks, and I would expect silver to fall the hardest in the final part of the move. This moment (when gold performs very strongly against the rallying USD and miners are strong relative to gold – after gold has already declined substantially) is likely to be the best entry point for long-term investments, in my view. This might also happen with gold close to $1,475, but it’s too early to say with certainty at this time.
- As a confirmation for the above, I will use the (upcoming or perhaps we have already seen it?) top in the general stock market as the starting point for the three-month countdown. The reason is that after the 1929 top, gold miners declined for about three months after the general stock market started to slide. We also saw some confirmations of this theory based on the analogy to 2008. All in all, the precious metals sector would be likely to bottom about three months after the general stock market tops.
- The above is based on the information available today, and it might change in the following days/weeks.
Please note that the above timing details are relatively broad and “for general overview only” – so that you know more or less what I think and how volatile I think the moves are likely to be – on an approximate basis. These time targets are not binding or clear enough for me to think that they should be used for purchasing options, warrants or similar instruments.
Summary
To summarize, the corrective upswing in gold is over, and it seems that the big downswing in gold, silver, and mining stocks is already underway. While the next few days may (!) bring some back-and-forth action instead of the decline’s continuation, it’s unlikely that this will take place for long. Based on the self-similar pattern in gold (similarity is mostly to the 2011-2013 period), gold is likely to decline to its previous 2021 lows relatively soon, even if it doesn’t happen right away. Based on the analogies to the recent past, it seems quite likely that gold will move lower in the following days and bottom in the second half of August.
It seems that our profits from the short position in the junior mining stocks are going to grow substantially in the following weeks.
After the sell-off (that takes gold to about $1,350 - $1,500), I expect the precious metals to rally significantly. The final part of the decline might take as little as 1-5 weeks, so it's important to stay alert to any changes.
Most importantly, please stay healthy and safe. We made a lot of money last March and this March, and it seems that we’re about to make much more on the upcoming decline, but you have to be healthy to enjoy the results.
As always, we'll keep you - our subscribers - informed.
To summarize:
Trading capital (supplementary part of the portfolio; our opinion): Full speculative short positions (300% of the full position) in mining stocks are justified from the risk to reward point of view with the following binding exit profit-take price levels:
Mining stocks (price levels for the GDXJ ETF): binding profit-take exit price: $37.12; stop-loss: none (the volatility is too big to justify a stop-loss order in case of this particular trade)
Alternatively, if one seeks leverage, we’re providing the binding profit-take levels for the JDST (2x leveraged) and GDXD (3x leveraged – which is not suggested for most traders/investors due to the significant leverage). The binding profit-take level for the JDST: $15.96; stop-loss for the JDST: none (the volatility is too big to justify a SL order in case of this particular trade); binding profit-take level for the GDXD: $37.02; stop-loss for the GDXD: none (the volatility is too big to justify a SL order in case of this particular trade).
For-your-information targets (our opinion; we continue to think that mining stocks are the preferred way of taking advantage of the upcoming price move, but if for whatever reason one wants / has to use silver or gold for this trade, we are providing the details anyway.):
Silver futures upside profit-take exit price: unclear at this time - initially, it might be a good idea to exit, when gold moves to $1,683
Gold futures upside profit-take exit price: $1,683
HGD.TO – alternative (Canadian) inverse 2x leveraged gold stocks ETF – the upside profit-take exit price: $12.88
Long-term capital (core part of the portfolio; our opinion): No positions (in other words: cash
Insurance capital (core part of the portfolio; our opinion): Full position
Whether you already subscribed or not, we encourage you to find out how to make the most of our alerts and read our replies to the most common alert-and-gold-trading-related-questions.
Please note that we describe the situation for the day that the alert is posted in the trading section. In other words, if we are writing about a speculative position, it means that it is up-to-date on the day it was posted. We are also featuring the initial target prices to decide whether keeping a position on a given day is in tune with your approach (some moves are too small for medium-term traders, and some might appear too big for day-traders).
Additionally, you might want to read why our stop-loss orders are usually relatively far from the current price.
Please note that a full position doesn't mean using all of the capital for a given trade. You will find details on our thoughts on gold portfolio structuring in the Key Insights section on our website.
As a reminder - "initial target price" means exactly that - an "initial" one. It's not a price level at which we suggest closing positions. If this becomes the case (like it did in the previous trade), we will refer to these levels as levels of exit orders (exactly as we've done previously). Stop-loss levels, however, are naturally not "initial", but something that, in our opinion, might be entered as an order.
Since it is impossible to synchronize target prices and stop-loss levels for all the ETFs and ETNs with the main markets that we provide these levels for (gold, silver and mining stocks - the GDX ETF), the stop-loss levels and target prices for other ETNs and ETF (among other: UGL, GLL, AGQ, ZSL, NUGT, DUST, JNUG, JDST) are provided as supplementary, and not as "final". This means that if a stop-loss or a target level is reached for any of the "additional instruments" (GLL for instance), but not for the "main instrument" (gold in this case), we will view positions in both gold and GLL as still open and the stop-loss for GLL would have to be moved lower. On the other hand, if gold moves to a stop-loss level but GLL doesn't, then we will view both positions (in gold and GLL) as closed. In other words, since it's not possible to be 100% certain that each related instrument moves to a given level when the underlying instrument does, we can't provide levels that would be binding. The levels that we do provide are our best estimate of the levels that will correspond to the levels in the underlying assets, but it will be the underlying assets that one will need to focus on regarding the signs pointing to closing a given position or keeping it open. We might adjust the levels in the "additional instruments" without adjusting the levels in the "main instruments", which will simply mean that we have improved our estimation of these levels, not that we changed our outlook on the markets. We are already working on a tool that would update these levels daily for the most popular ETFs, ETNs and individual mining stocks.
Our preferred ways to invest in and to trade gold along with the reasoning can be found in the how to buy gold section. Furthermore, our preferred ETFs and ETNs can be found in our Gold & Silver ETF Ranking.
As a reminder, Gold & Silver Trading Alerts are posted before or on each trading day (we usually post them before the opening bell, but we don't promise doing that each day). If there's anything urgent, we will send you an additional small alert before posting the main one.
Thank you.
Przemyslaw Radomski, CFA
Founder, Editor-in-chief

