

Briefly: in our opinion, full (300% of the regular position size) speculative short positions in mining stocks are justified from the risk/reward point of view at the moment of publishing this Alert.
Finally, after a few weeks of relatively small changes and telling you that whatever minor happened (or what didn’t happen) was a confirmation of the previous forecast, now I can report to you multiple interesting developments. And yes, they also confirm the previous forecast, and you already saw the results, as your trading account got bigger once again; but this time, the clues are even more decisive and more varied.
Let’s jump right into the charts. This time, we’ll start with the general stock market, which finally moved lower in a decisive manner.
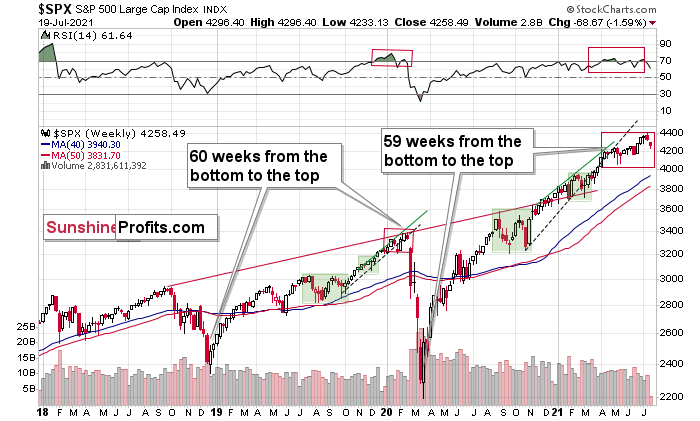
That was the third time when the stock-based RSI moved below the 70 level, which – based on the similarity to early 2020 – might be signaling that the top for this rally in stocks is already in. If it is indeed in, then the really bad times for the mining stocks and silver have just begun. Their yesterday’s performance seems to confirm that.
If it was not the final top for the stock market, then… The precious metals sector is likely to slide anyway because of what’s going on in the USD Index, and because the mining stocks’ underperformance provided us with not one, but multiple screaming sell signals in the previous weeks. Let’s take a look at the USDX.
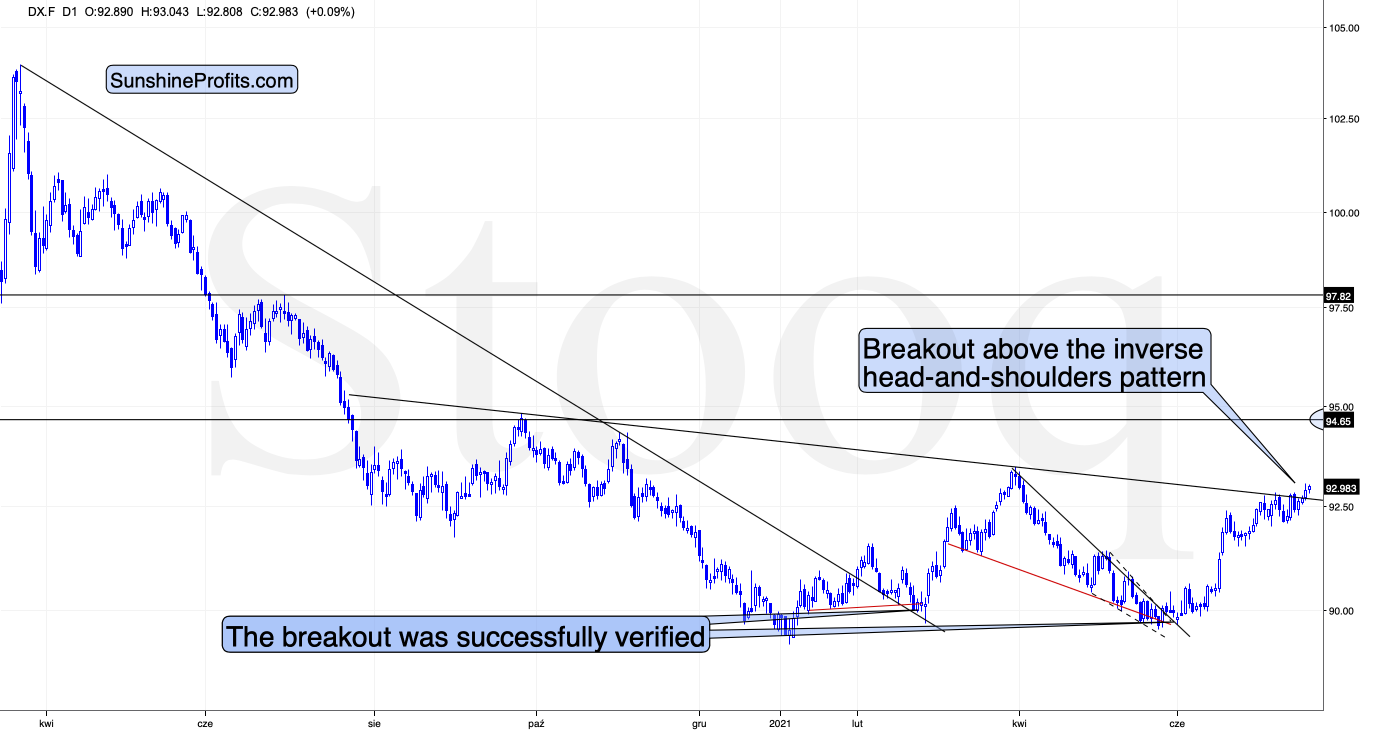
During yesterday’s session, the USD Index moved above the neck level of the broad (~yearly) inverse head-and-shoulders pattern and then it corrected somewhat while still closing the day above the neckline. And it’s been moving slightly higher in today’s session, at least so far.
This is a very bullish price action – the USDX’s breakout was not accidental, nor was it based on geopolitical news (the latter tends to trigger temporary moves that are then reversed). Additionally, it was preceded by a consolidation. Consequently, it seems that this breakout has a huge chance of being confirmed and followed by another sharp rally. The previous highs at about 94.5 are the initial upside target, but based on the inverse H&S pattern, the USDX is likely to rally to about 98.
Consequently, what just happened (the breakout above the formation’s neckline) has really bullish implications for the U.S. currency. And since the latter tends to move in the opposite direction to gold, silver, and mining stocks, it’s also very bearish for them.
Mining Stocks
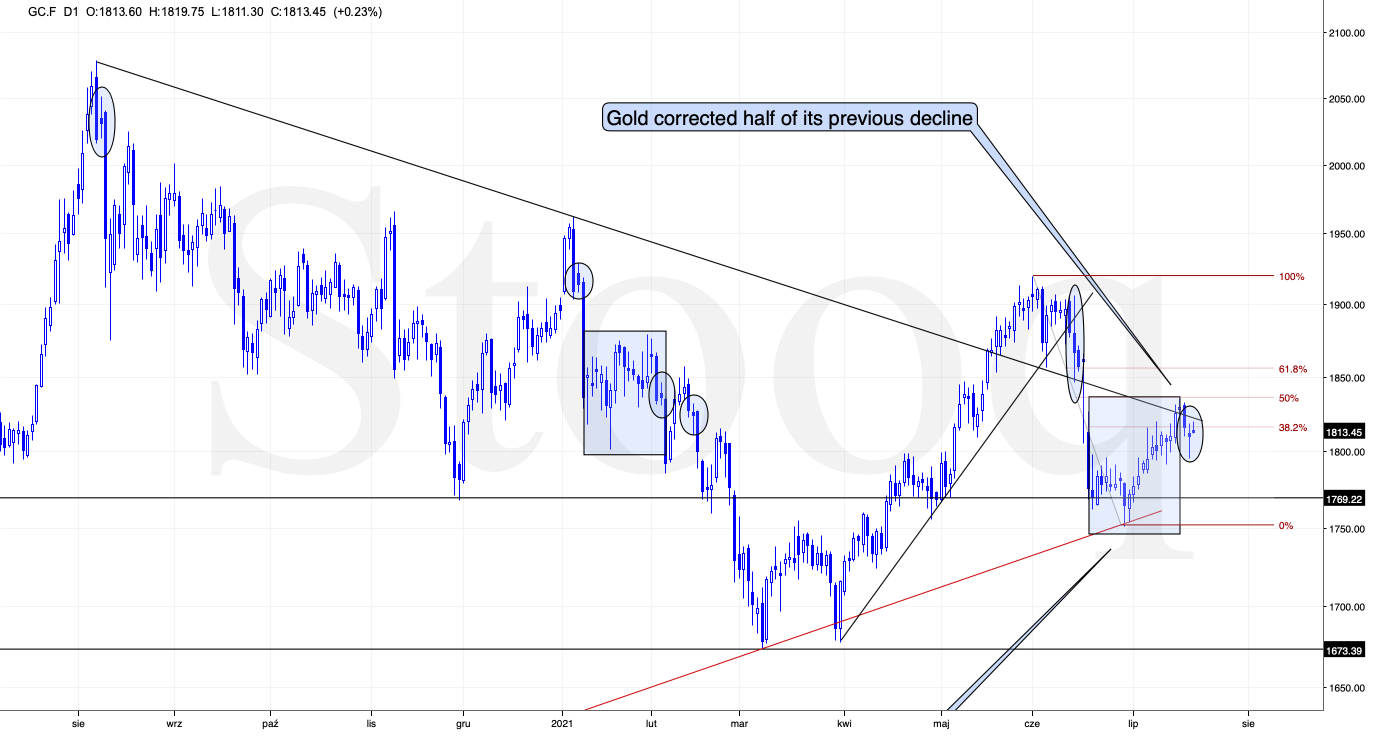
Interestingly, so far, gold didn’t do much. It declined visibly yesterday, but it then came back up before the end of the session. At the moment of writing these words, gold futures are trading just $1.50 below Friday’s (July 16) close. No wonder – even though the USD Index is completing its major, inverse H&S formation, it didn’t move significantly in nominal terms.
This is incredibly exciting for those who hold short positions in the mining stocks because this means that the huge impact falling gold will likely have on the miners is still ahead. And miners declined significantly anyway!
Before moving to the mining stocks, please note that the back-and-forth trading right after the first move lower is normal for gold. I marked those cases with ellipses. Consequently, the fact that gold moved back-and-forth now doesn’t make the forecast for gold bullish. Conversely, it’s a normal course of action right before a powerful slide.
And speaking of powerful slides, gold stocks could no longer wait and they declined before gold did.
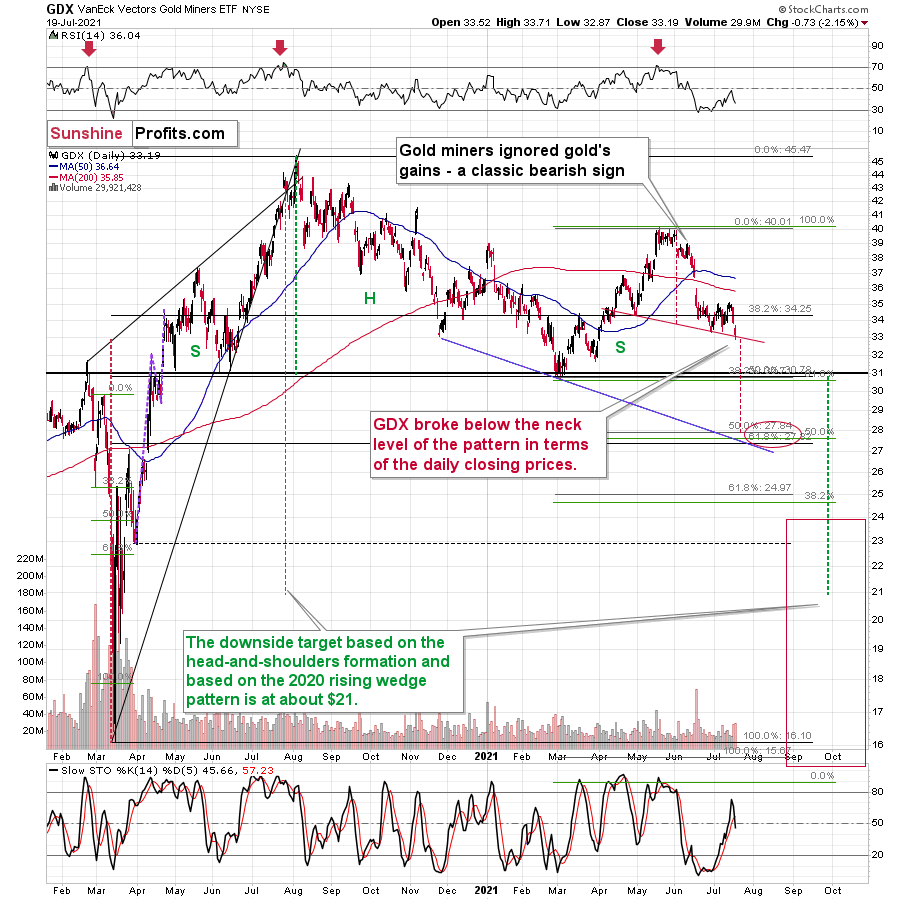
The GDX ETF (senior gold miners) moved below the recent lows, and it closed the day below the neck level of a head-and-shoulders pattern in terms of the closing prices. The stochastic indicator flashed a fresh sell signal as well. While gold is far from its late-April lows, the GDX just closed the day below them.
And if you think this kind of relative weakness is bearish, just wait until you see what the junior mining stocks did.
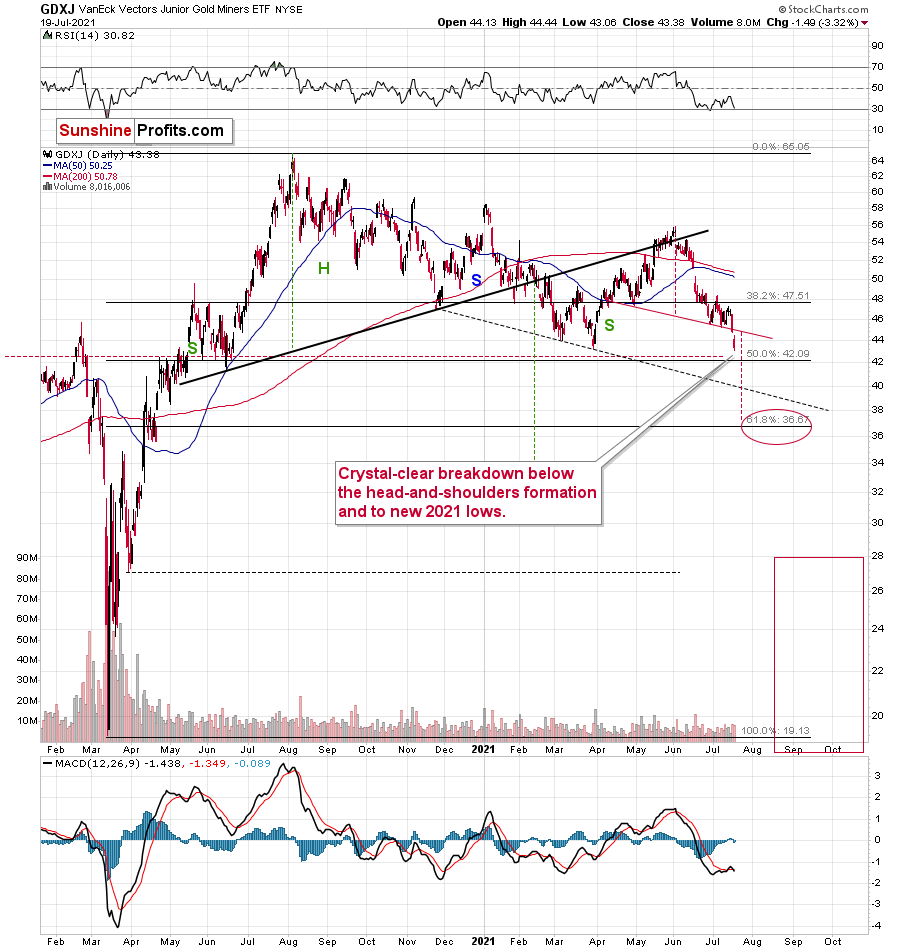
Junior miners just declined not only below the neck level of the recent head-and-shoulders pattern (in a clear way, in both: intraday and closing price terms), but they actually closed the day at new 2021 lows!
Yesterday’s close in the GDXJ was the lowest close in more than a year.
There are two markets that primarily impact the performance of the junior mining stocks. One is gold, and the other is the general stock market. Gold is now about $140 above its 2021 lows, while the S&P 500 is over 16% above its 2021 highs. And yet, the GDXJ is below its previous 2021 lows.
Juniors are underperforming senior gold miners too. You can see that by comparing two previous charts and by examining their ratio.
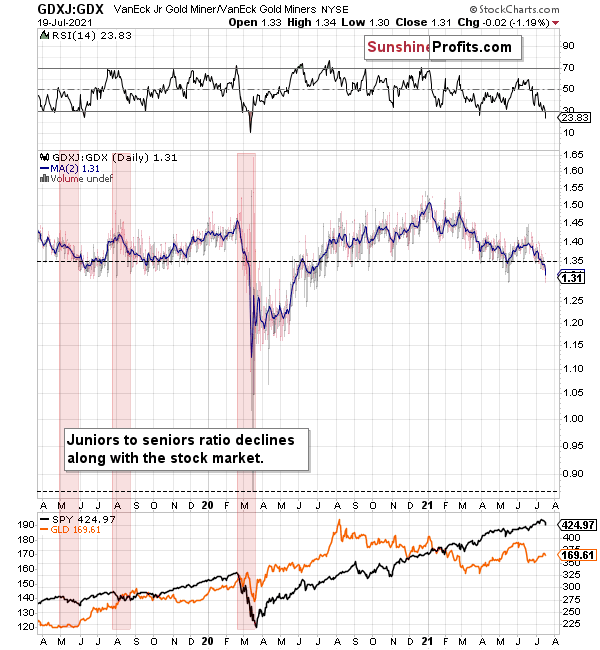
The ratio declines when junior miners underperform seniors. This happens often when the general stock market declines – juniors are more correlated with the latter than the seniors. Interestingly, juniors underperformed recently, even while stocks were strong. If the general stock market declines from here, the underperformance is likely to take an epic form – just as it did in early 2020.
This level of underperformance and weakness is truly breathtaking.
If miners – in particular, juniors – were able to decline so much without meaningful help from gold and the general stock market, just imagine the carnage they will suffer once this “help” finally arrives.
And given the breakout above the neck level of the inverse head-and-shoulders pattern in the USD Index, it seems like the key trigger to set the wheels in motion is already here.
Silver reacted too.
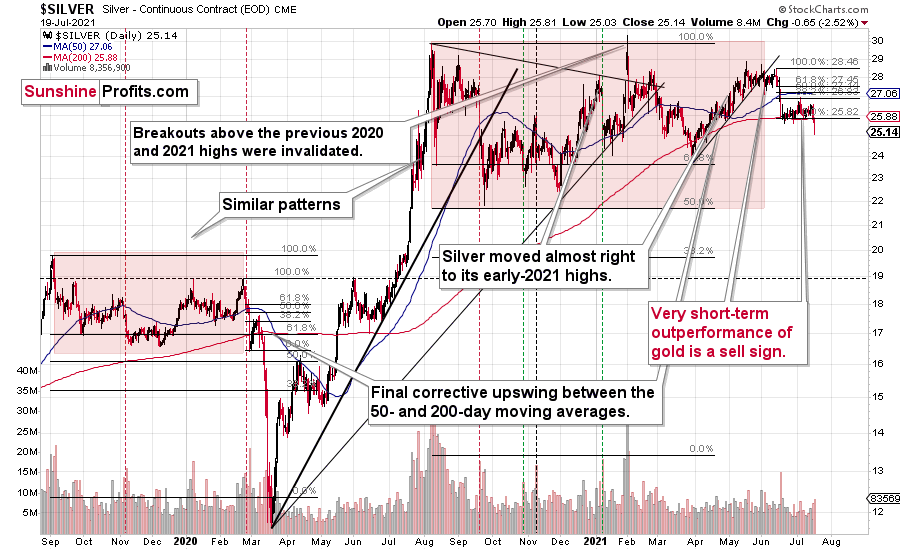
After the lengthy, boring consolidation, the silver price is moving lower once again. Unlike junior miners, it didn’t break below its previous 2021 lows, but it’s showing where the precious metals sector wants to go. Gold’s relative strength is an anomaly, not the key news.
Having said that, let’s take a look at the markets from a more fundamental point of view.
The Almighty Dollar
With U.S. equities suffering their first major bout of panic in months, unfamiliar lights lit up Wall Street on Jul. 19. However, while the sea of red drowned everything from crude to casinos, the development green-lit the USD Index for another rally.
Moreover, while stocks’ one-day weakness was merely a blip on the radar screen, a meaningful correction could light a fire under the USD Index. Case in point: With Bank of America’s Global Wealth and Investment Management (GWIM) clients’ exposure to equities at an all-time high, a reversion to the mean could elicit plenty of sell orders in the coming weeks.
Please see below:
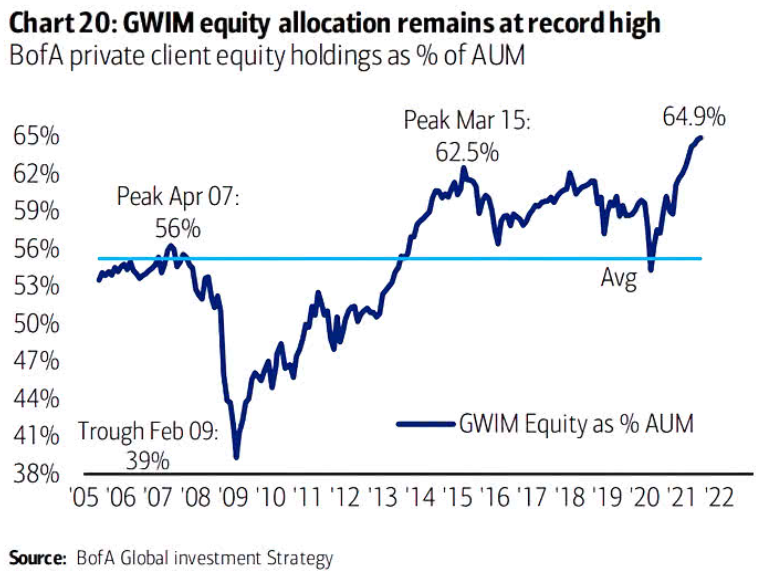
To explain, the blue line above tracks BofA’s GWIM clients’ stock holdings as a percentage of their total portfolio. If you analyze the right side of the chart, it’s easy to spot the excess. However, if their allocation returns to its historical average (roughly 56%), the USD Index should be a major beneficiary.
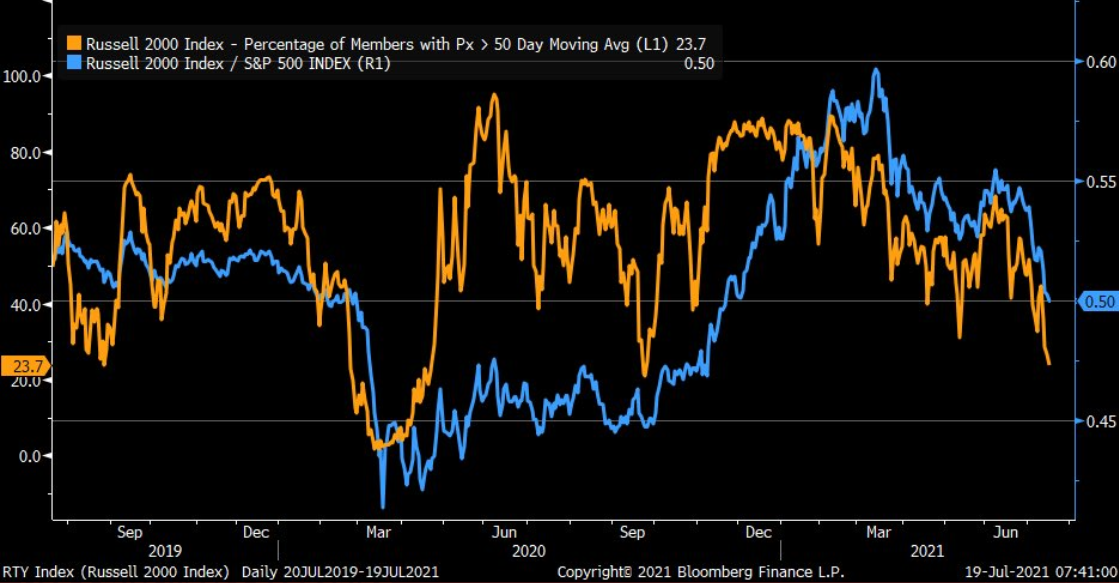
To that point, while the general stock market has been rising in recent weeks, breadth has completely fallen off a cliff. For context, breadth can take on many forms, but it often compares the number of stocks in an index that are rising to the number of stocks in an index that are falling. In a nutshell: if a small portion of stocks are responsible for the uprising, there is severe weakness beneath the surface. And with the Russell 2000 (small caps) demonstrating just that, the weak are already being sent to slaughter.
Please see below:
 Source: Bloomberg/Liz Ann Sonders
To explain, the orange line above tracks the percentage of stocks in the Russell 2000 that are trading above their 50-day moving average, while the blue line above tracks the Russell 2000/S&P 500 ratio. If you analyze the right side of the chart, you can see that both metrics have moved sharply lower.
Furthermore, while investors have dropped the guillotine on the weakest members of their respective indices, the rotation has caused index heavyweights to become extremely bloated. For example, the five largest stocks in the S&P 500 – Microsoft, Apple, Amazon, Alphabet and Facebook – now account for 23% of the index’s market cap.
Please see below:
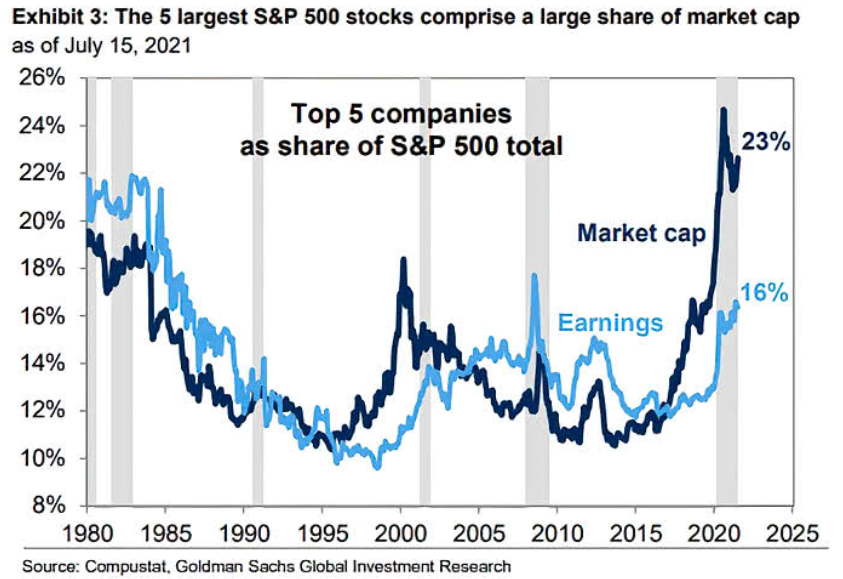
To explain, the five largest companies in the S&P 500 accounted for roughly 18% of the S&P 500’s market cap at the height of the dot-com bubble. And while the figure has declined from its 2020 peak (roughly 25%), it’s been moving higher in recent weeks (follow the dark blue line). As a result, a handful of stocks have been doing the bulk of the S&P 500’s heavy lifting.
Will There Ever Be a Renaissance in Europe?
And while the wheels are in motion, the EUR/USD – which accounts for nearly 58% of the movement of the USD Index – is already struggling to hold 1.1800. Moreover, hopes of an Eurozone economic Renaissance have already come undone.
To explain, I wrote on May 20:
With optimism abound, European banks, energy stocks and breakeven inflation rates have helped boost the EUR/USD. And while investors are extrapolating the cyclical strength as grounds for the European Central Bank (ECB) to reduce its bond-buying program in June, haven’t we seen this movie before?
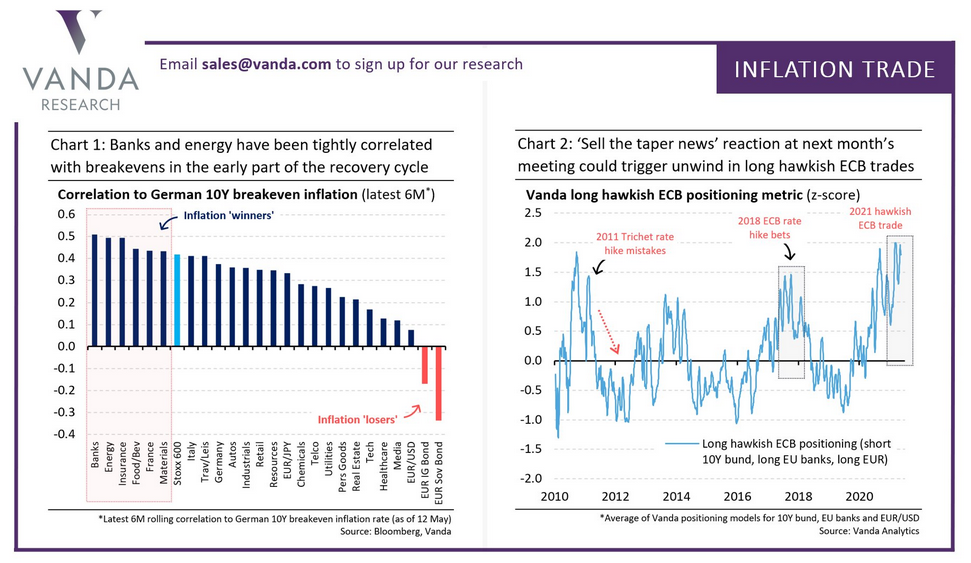
To explain, if you analyze the chart on the right, you can see that hawkish ECB positioning implies being long Eurozone banks, short Eurozone bonds and long the EUR/USD. However, if you analyze the peaks in the light blue line, you can see that prior bets on ECB tightening have ended in extreme disappointment. For example, when the ECB hiked rates twice in 2011, Portuguese sovereign debt was downgraded to junk, and less than a year later, Greece was forced to restructure its debt in order to remain in the European union. Likewise, it didn’t take long for all of the cyclical bets to unwind and for the EUR/USD to plunge. Second, after foolish optimism sent cyclicals soaring in 2018, the bets unraveled, and once again, the EUR/USD plunged. Thus, is this time really different?
Well, with two months mirroring the difference between night and day, cyclical positioning has sunk like a stone.
Please see below:
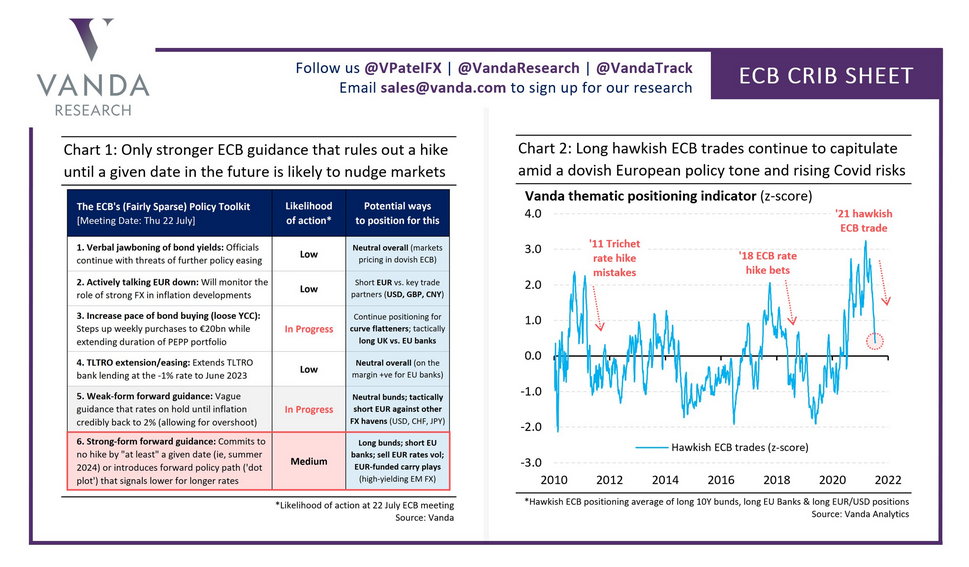
To explain, if you compare the position of the light blue line on the right side of the chart above (approaching zero) with its position on the first chart (roughly 1.75), you can see how much things have changed. As a result, not only is the U.S. economy outperforming the Eurozone, but the U.S. Federal Reserve (FED) and the ECB are worlds apart.
For example, with FED officials’ hawkish rhetoric contrasting Chairman Jerome Powell’s perpetual patience, a game of ‘will they or won’t they’ is already underway. However, with the FED likely to reveal its taper timeline in September, inflation differentials highlight the regional dichotomy.
Please see below:
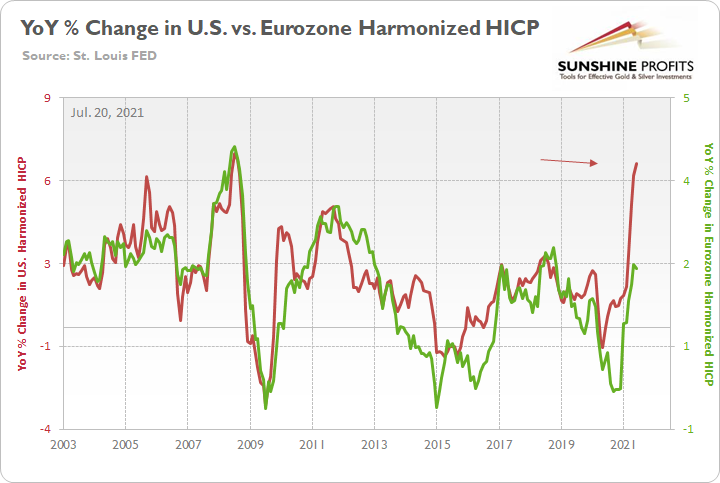
To explain, the green line above tracks the year-over-year (YoY) percentage change in the Eurozone Harmonized Index of Consumer Prices (HICP), while the red line above tracks the YoY percentage change in the U.S. HICP. If you analyze the right side of the chart, it’s not even close. And with the U.S. HICP rising by 6.41% YoY in June and the Eurozone HICP rising by 1.90%, the FED is likely to taper well in advance of the ECB.
Furthermore, investors already sense that the writing is on the wall.
Please see below:
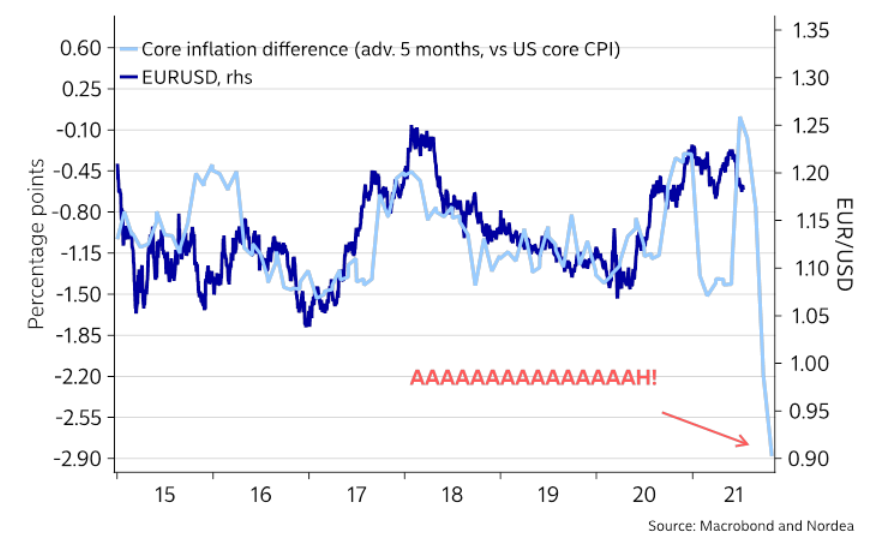
To explain, the dark blue line above tracks the EUR/USD, while the light blue line above tracks the Eurozone-U.S. core Consumer Price Index (CPI) differential (advanced by five months). For context, when the light blue line is falling, it means that the U.S. core CPI is higher than the Eurozone core CPI. Moreover, if you focus your attention on the right side of the chart, you can see that the Eurozone-U.S. inflation spread has fallen precipitously. And with the EUR/USD still relatively elevated, there is plenty of room for the currency pair to move lower.
When Will We See the Taper Timeline?
Finally, with investors coming around to our way of thinking, institutions expect the FED to reveal its taper timeline in August or September.
To explain, I wrote on Jun. 16:
While I’ve been warning for months that the FED will likely taper its asset purchases much sooner than investors think, suddenly, the answer to a question that wasn’t even in Bank of America’s Global Fund Managers Survey in April or May has now become the consensus.
Please see below:
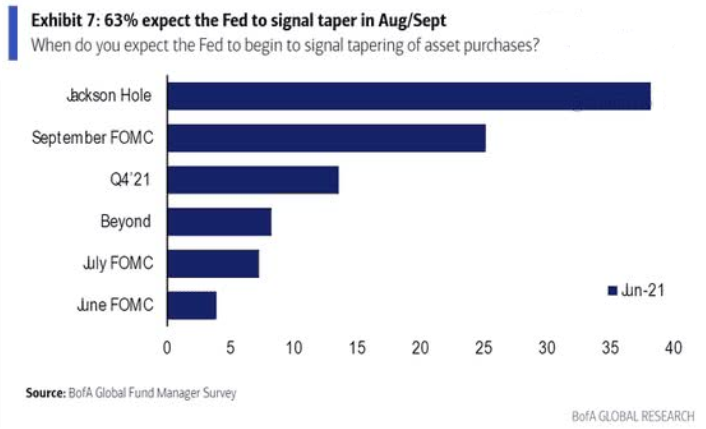
To explain, 63% of respondents now believe that the FED will “signal” a reduction in its bond-buying program by either the Jackson Hole Economic Policy Symposium (which is scheduled for Aug. 26-28) or the Sep. 21/22 policy meeting.
Moreover, with a hawkish shift becoming even more popular in July, institutions realized that Powell’s promises are likely to fade with the summer sun.
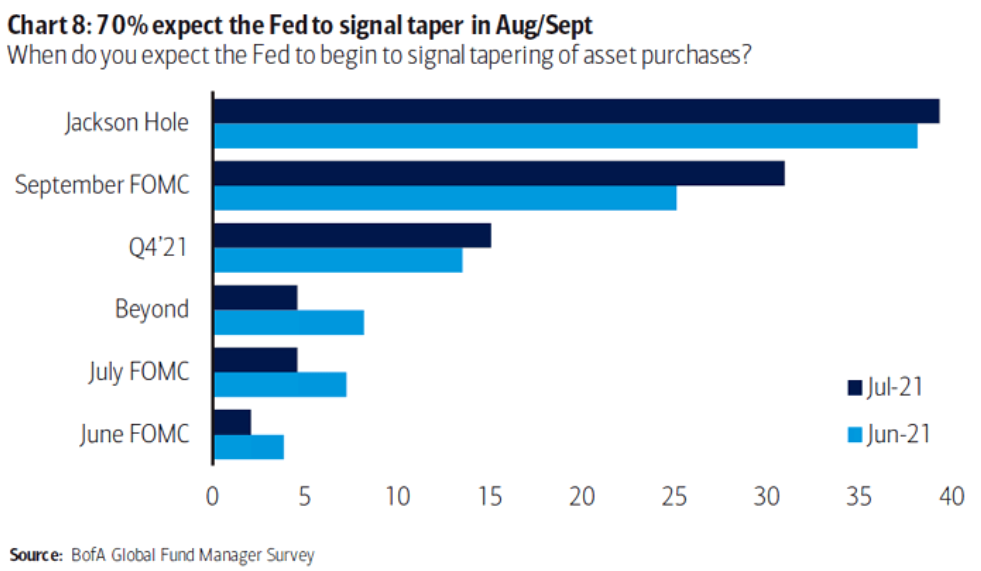
To explain, 70% of respondents now believe that the FED will “signal” a taper by either Jackson Hole or the Sep. 21/22 policy meeting. As such, while the PMs have been major beneficiaries of the FED’s liquidity splurge, they may experience a September to remember for all of the wrong reasons.
In conclusion, while gold demonstrated relative strength on Jul. 19, silver and the gold miners weren’t so lucky. And with the latter’s underperformance an extremely bearish sign, technical and fundamental headwinds continue to plague the precious metals market. On top of that, with the bulk of their recent weakness occurring alongside the S&P 500 strength, if the general stock market suffers a material correction, the slope of the PMs’ slide could steepen. Thus, while corrective upswings are expected along the way, the PMs’ medium-term trend still remains down.
Overview of the Upcoming Part of the Decline
- The corrective upswing in gold might already be over, and another huge decline is likely just around the corner. In fact, it seems to be well underway in the case of mining stocks, especially junior miners.
- After miners slide in a meaningful and volatile way, but silver doesn’t (and it just declines moderately), I plan to switch from short positions in miners to short positions in silver. At this time, it’s too early to say at what price levels this would take place – perhaps with gold close to $1,600. I plan to exit those short positions when gold shows substantial strength relative to the USD Index, while the latter is still rallying. This might take place with gold close to $1,350 - $1,500 and the entire decline (from above $1,900 to about $1,475) would be likely to take place within 6-20 weeks, and I would expect silver to fall the hardest in the final part of the move. This moment (when gold performs very strongly against the rallying USD and miners are strong relative to gold – after gold has already declined substantially) is likely to be the best entry point for long-term investments, in my view. This might also happen with gold close to $1,475, but it’s too early to say with certainty at this time.
- As a confirmation for the above, I will use the (upcoming or perhaps we have already seen it?) top in the general stock market as the starting point for the three-month countdown. The reason is that after the 1929 top, gold miners declined for about three months after the general stock market started to slide. We also saw some confirmations of this theory based on the analogy to 2008. All in all, the precious metals sector would be likely to bottom about three months after the general stock market tops.
- The above is based on the information available today, and it might change in the following days/weeks.
Please note that the above timing details are relatively broad and “for general overview only” – so that you know more or less what I think and how volatile I think the moves are likely to be – on an approximate basis. These time targets are not binding or clear enough for me to think that they should be used for purchasing options, warrants or similar instruments.
Summary
To summarize, it seems that gold has already formed its short-term top and – based i.a. on the completed inverse head-and-shoulders pattern in the USD Index – gold is likely to fall substantially in the following weeks. Gold stocks’ exceptionally weak performance has been indicating that for many weeks, and given juniors’ breakdown to new yearly lows, it seems that the storm has already begun.
It seems that our profits on the short position in the junior mining stocks are going to grow substantially in the following weeks.
After the sell-off (that takes gold to about $1,350 - $1,500), I expect the precious metals to rally significantly. The final part of the decline might take as little as 1-5 weeks, so it's important to stay alert to any changes.
Most importantly, please stay healthy and safe. We made a lot of money last March and this March, and it seems that we’re about to make much more on the upcoming decline, but you have to be healthy to enjoy the results.
As always, we'll keep you - our subscribers - informed.
By the way, we’re currently providing you with the possibility to extend your subscription by a year, two years or even three years with a special 20% discount. This discount can be applied right away, without the need to wait for your next renewal – if you choose to secure your premium access and complete the payment upfront. The boring time in the PMs is definitely over, and the time to pay close attention to the market is here. Naturally, it’s your capital, and the choice is up to you, but it seems that it might be a good idea to secure more premium access now while saving 20% at the same time. Our support team will be happy to assist you in the above-described upgrade at preferential terms – if you’d like to proceed, please contact us.
To summarize:
Trading capital (supplementary part of the portfolio; our opinion): Full speculative short positions (300% of the full position) in mining stocks are justified from the risk to reward point of view with the following binding exit profit-take price levels:
Mining stocks (price levels for the GDXJ ETF): binding profit-take exit price: $37.12; stop-loss: none (the volatility is too big to justify a stop-loss order in case of this particular trade)
Alternatively, if one seeks leverage, we’re providing the binding profit-take levels for the JDST (2x leveraged) and GDXD (3x leveraged – which is not suggested for most traders/investors due to the significant leverage). The binding profit-take level for the JDST: $15.96; stop-loss for the JDST: none (the volatility is too big to justify a SL order in case of this particular trade); binding profit-take level for the GDXD: $37.02; stop-loss for the GDXD: none (the volatility is too big to justify a SL order in case of this particular trade).
For-your-information targets (our opinion; we continue to think that mining stocks are the preferred way of taking advantage of the upcoming price move, but if for whatever reason one wants / has to use silver or gold for this trade, we are providing the details anyway.):
Silver futures upside profit-take exit price: unclear at this time - initially, it might be a good idea to exit, when gold moves to $1,683
Gold futures upside profit-take exit price: $1,683
HGD.TO – alternative (Canadian) inverse 2x leveraged gold stocks ETF – the upside profit-take exit price: $12.88
Long-term capital (core part of the portfolio; our opinion): No positions (in other words: cash
Insurance capital (core part of the portfolio; our opinion): Full position
Whether you already subscribed or not, we encourage you to find out how to make the most of our alerts and read our replies to the most common alert-and-gold-trading-related-questions.
Please note that we describe the situation for the day that the alert is posted in the trading section. In other words, if we are writing about a speculative position, it means that it is up-to-date on the day it was posted. We are also featuring the initial target prices to decide whether keeping a position on a given day is in tune with your approach (some moves are too small for medium-term traders, and some might appear too big for day-traders).
Additionally, you might want to read why our stop-loss orders are usually relatively far from the current price.
Please note that a full position doesn't mean using all of the capital for a given trade. You will find details on our thoughts on gold portfolio structuring in the Key Insights section on our website.
As a reminder - "initial target price" means exactly that - an "initial" one. It's not a price level at which we suggest closing positions. If this becomes the case (like it did in the previous trade), we will refer to these levels as levels of exit orders (exactly as we've done previously). Stop-loss levels, however, are naturally not "initial", but something that, in our opinion, might be entered as an order.
Since it is impossible to synchronize target prices and stop-loss levels for all the ETFs and ETNs with the main markets that we provide these levels for (gold, silver and mining stocks - the GDX ETF), the stop-loss levels and target prices for other ETNs and ETF (among other: UGL, GLL, AGQ, ZSL, NUGT, DUST, JNUG, JDST) are provided as supplementary, and not as "final". This means that if a stop-loss or a target level is reached for any of the "additional instruments" (GLL for instance), but not for the "main instrument" (gold in this case), we will view positions in both gold and GLL as still open and the stop-loss for GLL would have to be moved lower. On the other hand, if gold moves to a stop-loss level but GLL doesn't, then we will view both positions (in gold and GLL) as closed. In other words, since it's not possible to be 100% certain that each related instrument moves to a given level when the underlying instrument does, we can't provide levels that would be binding. The levels that we do provide are our best estimate of the levels that will correspond to the levels in the underlying assets, but it will be the underlying assets that one will need to focus on regarding the signs pointing to closing a given position or keeping it open. We might adjust the levels in the "additional instruments" without adjusting the levels in the "main instruments", which will simply mean that we have improved our estimation of these levels, not that we changed our outlook on the markets. We are already working on a tool that would update these levels daily for the most popular ETFs, ETNs and individual mining stocks.
Our preferred ways to invest in and to trade gold along with the reasoning can be found in the how to buy gold section. Furthermore, our preferred ETFs and ETNs can be found in our Gold & Silver ETF Ranking.
As a reminder, Gold & Silver Trading Alerts are posted before or on each trading day (we usually post them before the opening bell, but we don't promise doing that each day). If there's anything urgent, we will send you an additional small alert before posting the main one.
Thank you.
Przemyslaw Radomski, CFA
Founder, Editor-in-chief

