

Briefly: in our opinion, full (200% of the regular size of the position) speculative long positions in gold, silver and mining stocks are justified from the risk/reward perspective at the moment of publishing this alert.
Gold ended last week with a small decline and overall it was only a bit higher, thus making the weekly reversal less than perfectly clear. But, Friday’s small decline was quite meaningful as there was something about it that usually followed very similar outcomes. Something that is connected with the GLD ETF, but not with gold… We can say the same about the moves in platinum and in the USD Index. The prices at which they closed the previous week are very informative and confirm that profits from our speculative trade should increase even further.
Before discussing what happened, let’s discuss what didn’t happen (charts courtesy of http://stockcharts.com).
Almost Nonexistent Price Changes in Gold, Silver and Gold Stocks
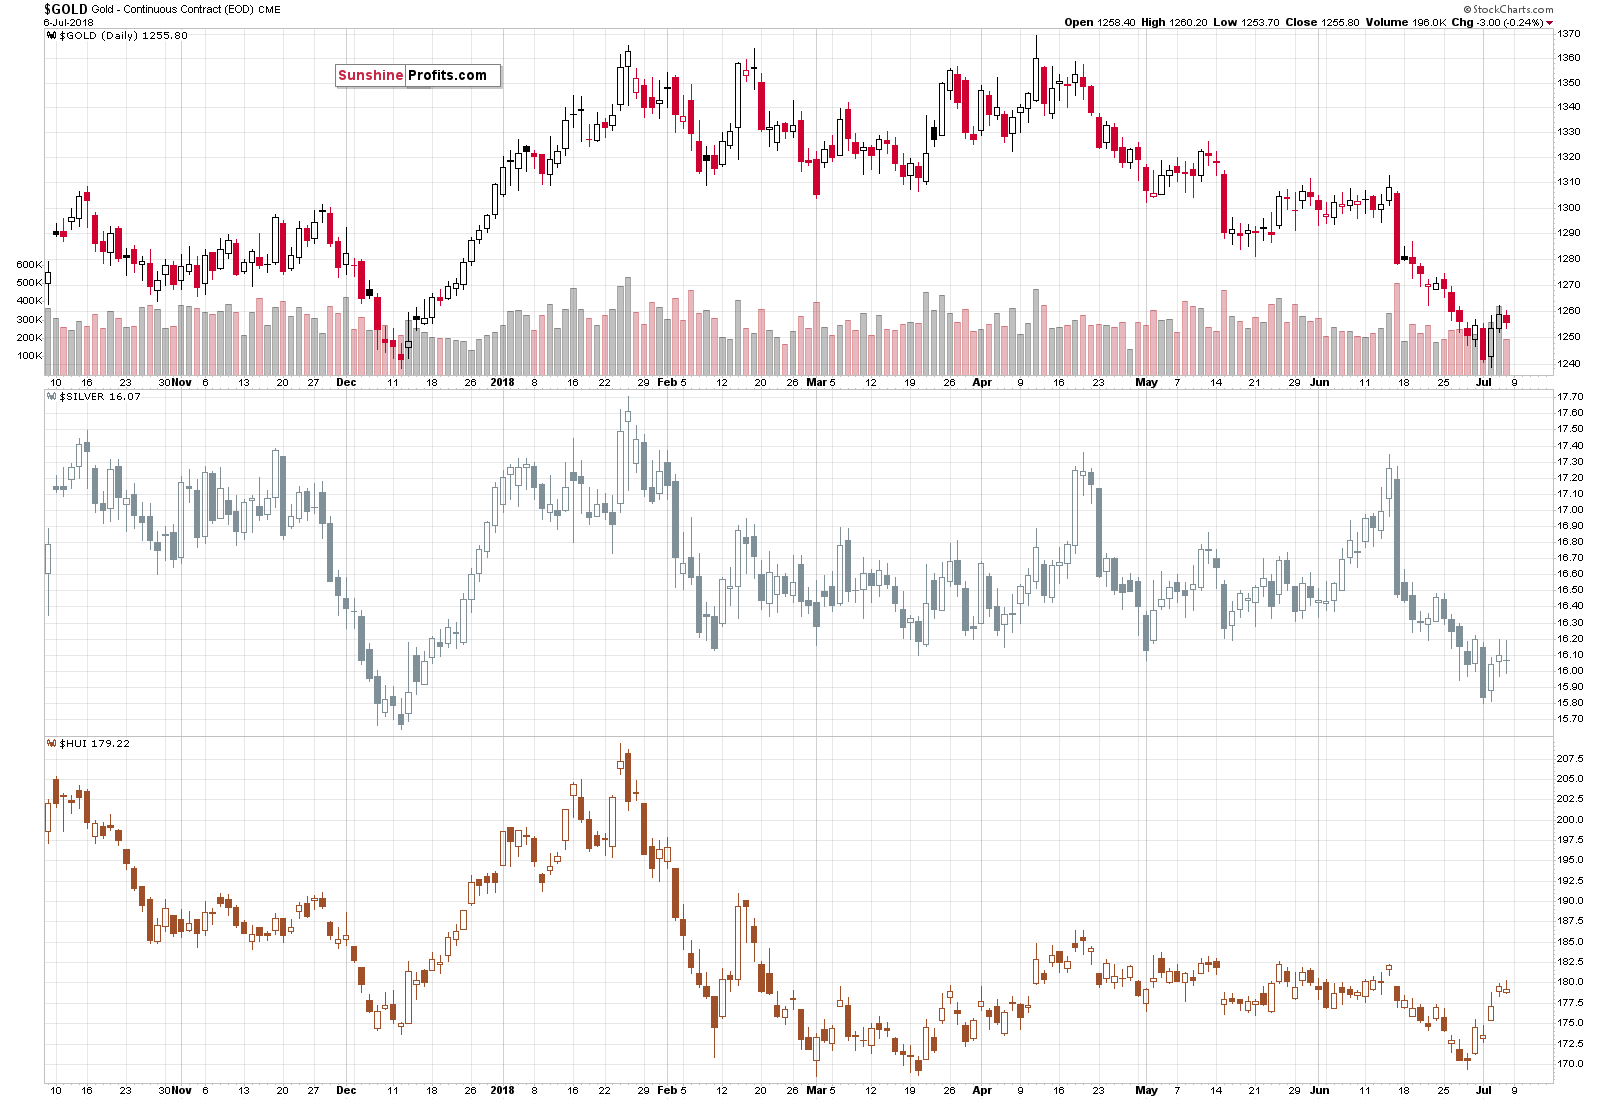
The above title says it all – practically nothing happened in gold, silver and in gold stocks and thus we have nothing new to add to our Friday’s analysis of their charts – those comments remain up-to-date.
But, just because there’s nothing to report in case of gold, it – surprisingly – doesn’t mean the same for the GLD ETF.
GLD’s Tiny Volume and Its Implications

The volume that accompanied Friday’s small decline was very low. We haven’t seen it this low in months. If we only take into account daily declines, then Friday’s session stands out even more. Naturally, whenever something odd happens, it’s a good idea to check if similar cases were followed by analogous action. If so, this means that we have a signal.
It is the case right now. The above chart features green and red rectangles. Not counting this case, there were 6 green rectangles and only one red one. The green ones were followed by at least a very short-term rally, while the red one was followed by a decline. Since 6 out of 7 cases were followed by immediate bullish action, the implications are quite clearly bullish.
Gold’s Monthly Analogy Remains in Place
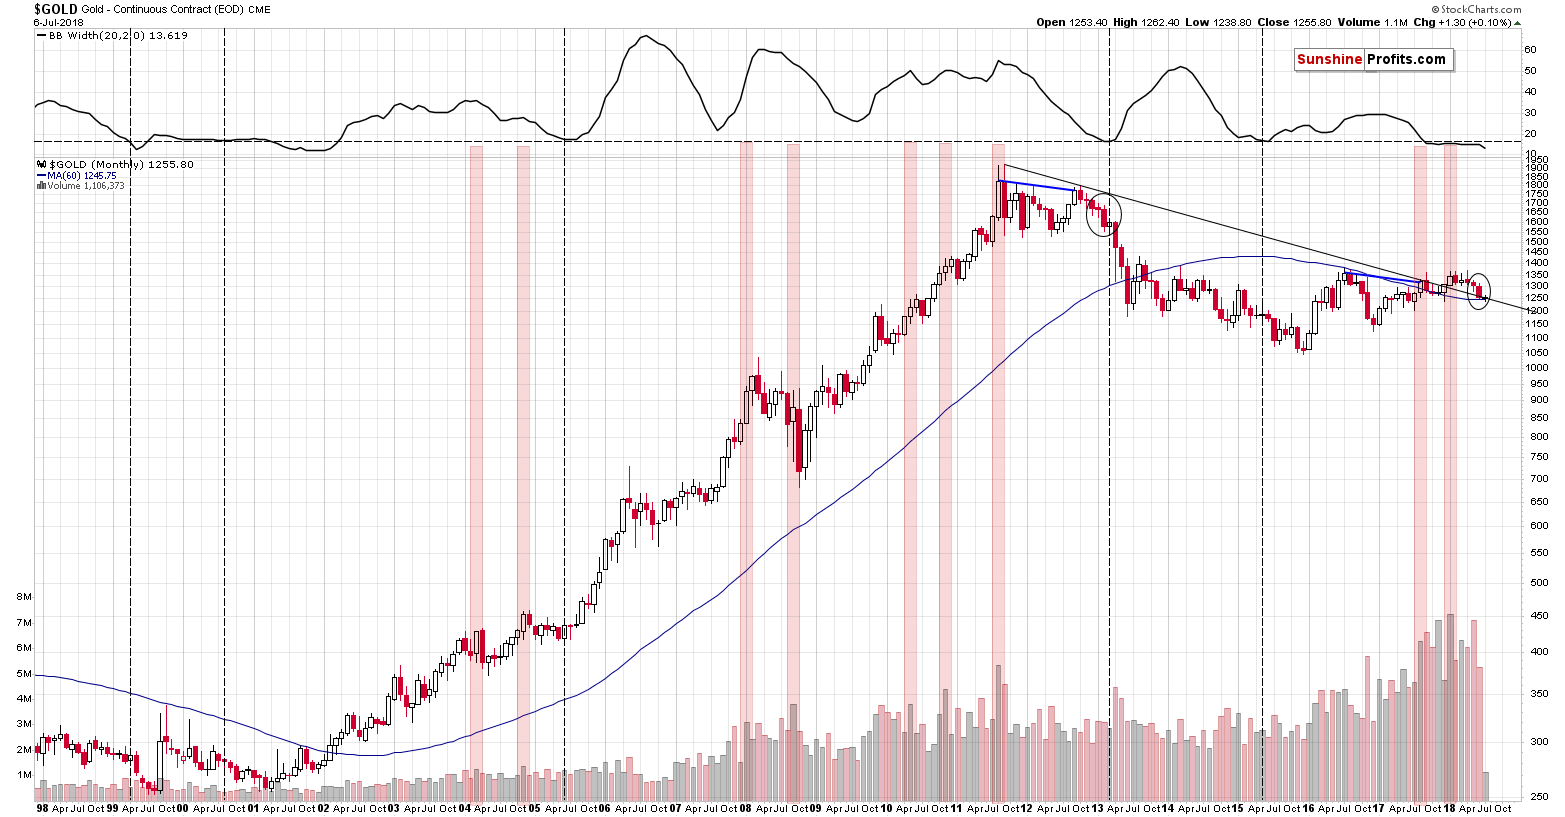
The above chart features monthly changes in the price of gold. We are featuring it to let you know that what we described as a likely action last week is still what’s likely to follow. Quoting our July the 2nd Alert (we’ll also quote the USDX analysis while updating the charts as it’s also important today):
The similarity between the 2012-2013 decline and the current situation remains in place even though the current decline got delayed by exceptional decline in the USD Index in late 2017 and early 2018. In the last few weeks the decline gained momentum and it was the first month after the initial reversal when it declined in a visible manner (over $50).
This makes June analogous to February 2013. Do you know what happened next? We saw a corrective upswing and the mother of all declines started in April. The 1:1 interpretation would be that we’ll see a corrective upswing in July and a powerful decline in August.
So, is gold likely to rally in July?
It’s likely to rally in the first half of July and the outlook for the second part is more bearish than bullish. While we can’t see it on the above chart, the March 2013 upswing consisted of only 2 weekly upswings. If the first one of them is beginning today, then the direct analogy to the past makes only a short-term rally likely – nothing more. It also suggests that we should be prepared for seeing bearish signs and confirmations in about two weeks. Naturally, the situation doesn’t have to repeat itself to the latter and we’ll be looking for bearish signs at all times, but based on the above it does seem to makes sense to give more value to signs that will emerge on or after the 10th of July or so.
The final bottom in gold formed on July the 3rd, which means that gold could rally for another week or two and decline in the early part of the second half of July.
But, can gold move considerably higher despite a move higher in the USDX? Yes, but it’s not something that is likely or expected to happen often. So, perhaps the USD is about to take a breather as well?
Pause in USD’s Rally
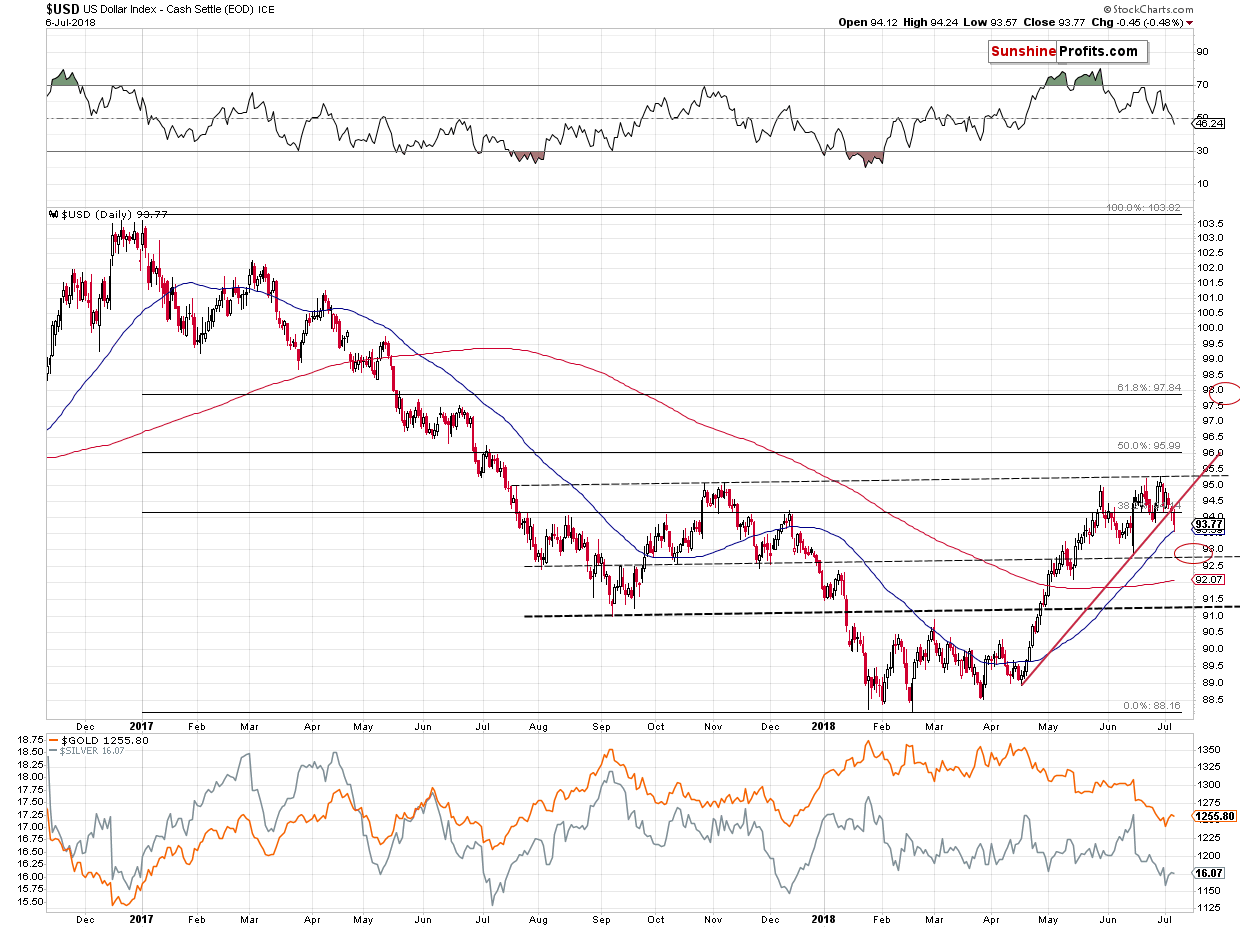
So far the April – June rally is symmetrical to the November 2017 – January 2018 decline in terms of the overall pace at which the moves took place and – more or less – the price levels that were reached.
If this symmetry continues to a big extent, then we may see a move to or a bit below 91.5, or – if the symmetry continues to a limited extent – a move to about 92.75 (approximately the June bottom).
The latter scenario seems more likely because of two factors:
- Gold was a bit above $1,300, when USD bottomed in June
- The analogy to 2014-2015 rally remains in place and a bigger decline seems unlikely in its light
Seeing a move to the previous low would not change the long-term picture much, but a move to the September 2017 low would. Naturally, it’s not guaranteed that both rallies will be almost identical, but since there were very similar so far, it seems likely that the similarity will continue to a considerable extent.
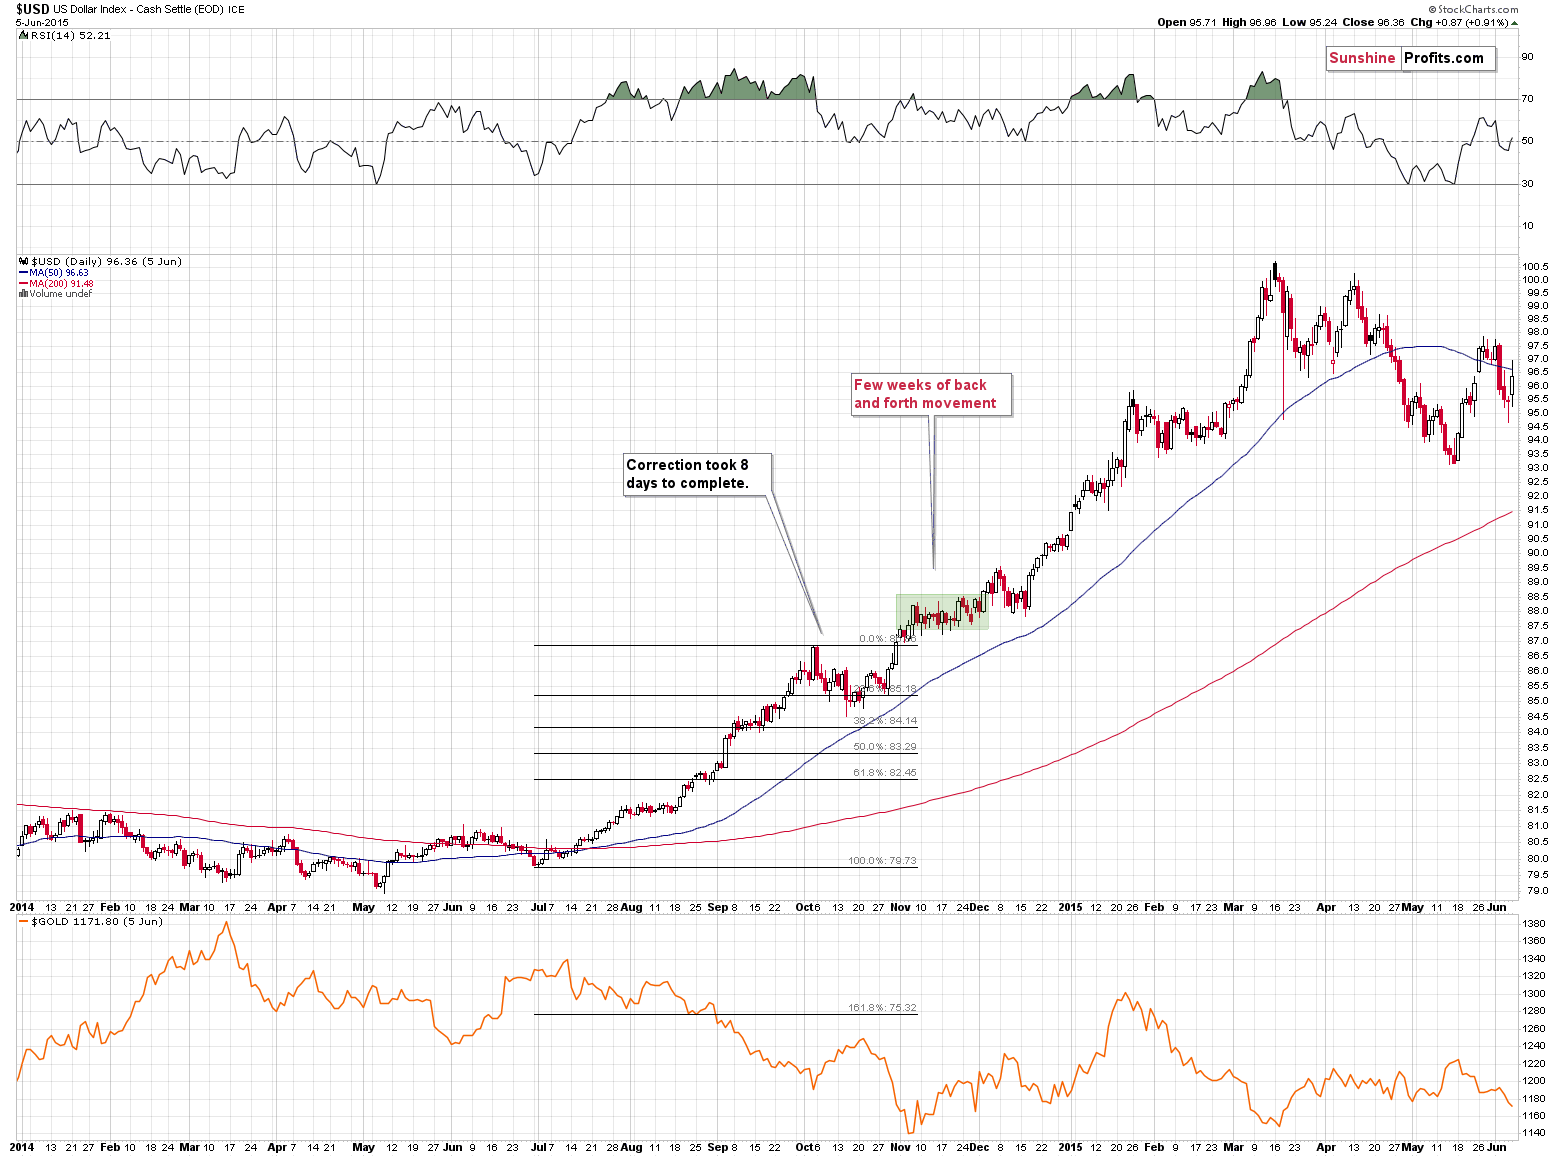
Plus, if you take a closer look at what happened in 2014, you’ll see that after USD broke above the initial top (analogous to the late May 2018 top) it corrected and then broke above it about one month later. Then it moved back and forth for a few weeks before the rally continued.
Now, if the analogy remains in place, it seems that we are at the time when the USD Index is about to trade back and forth. While in 2014 it didn’t mean a move back below the initial top, the current consolidation doesn’t have to be 100% identical. We could see a different kind thereof and as long as it doesn’t deviate too much from the 2014 analogy, the very bullish implications of the latter will remain in place.
In other words, a move to 95.75 or so would likely not invalidate the similarity to what happened in 2014 as it seems to be within the “normal range” or what might be different during such a long-term analogy.
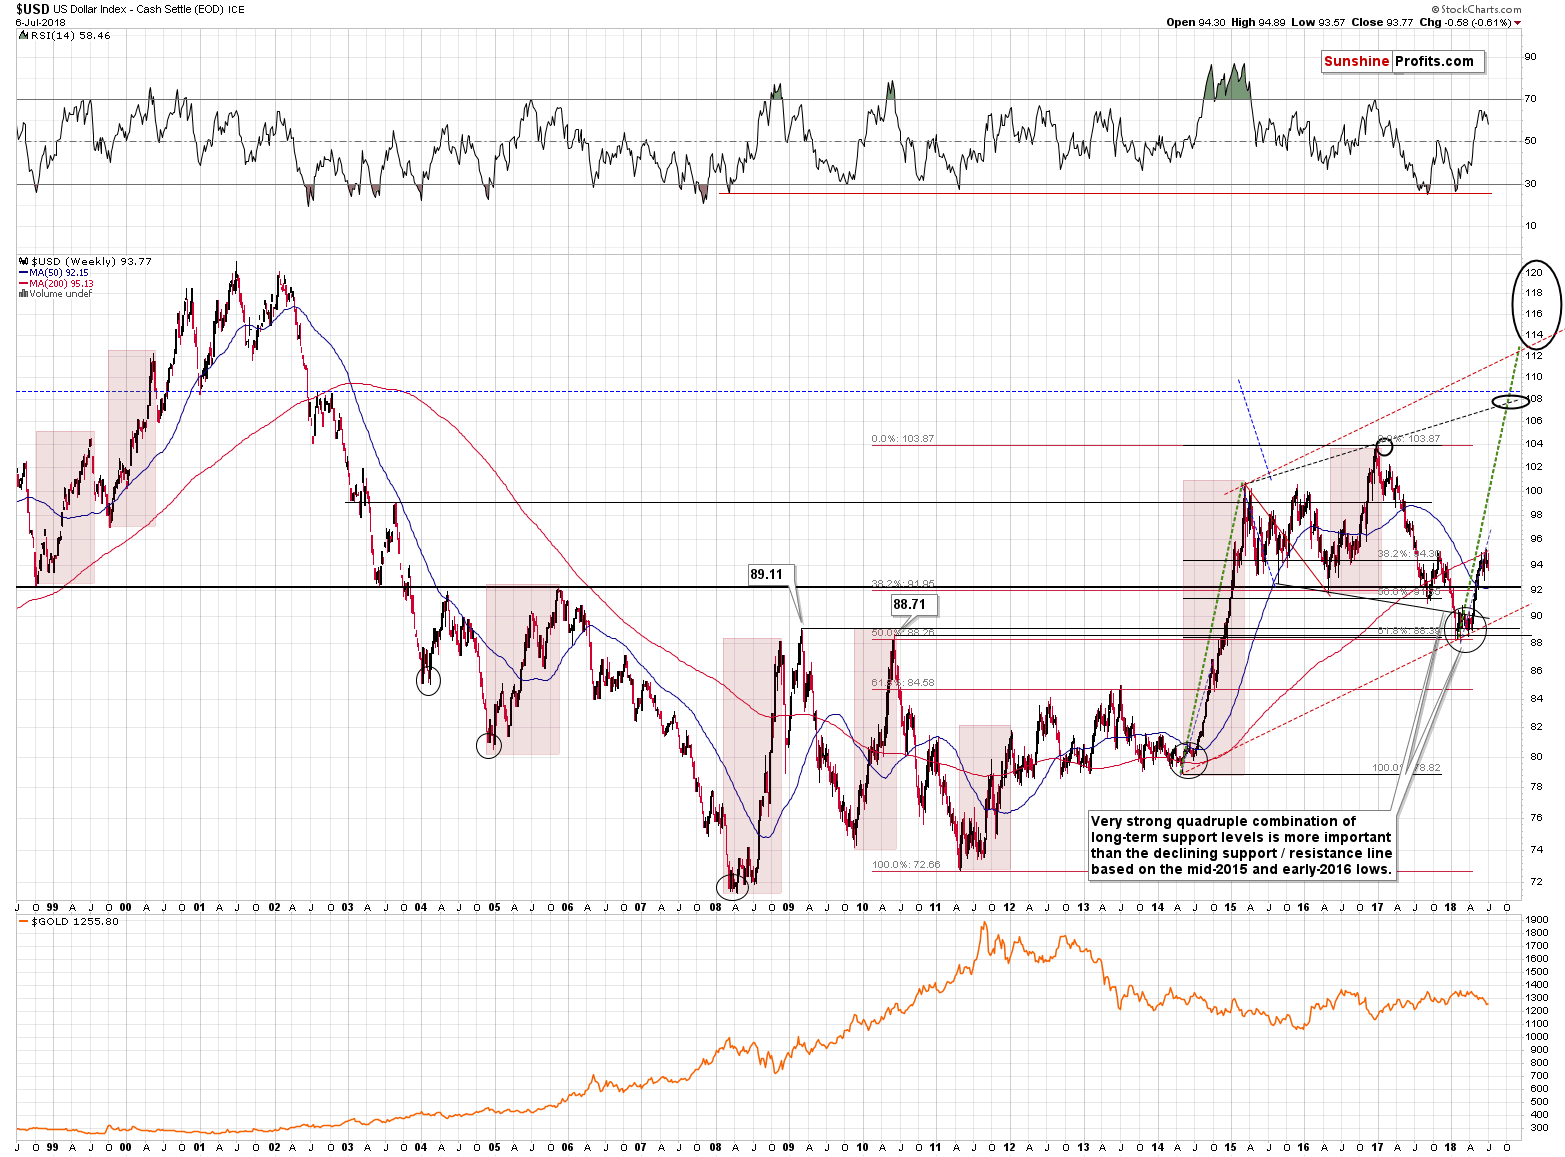
The above analogy just got much more likely valid because the USD Index declined and closed the week below the rising support line. For your convenience, we’re posting it again.

It was just a single close below the line, but in general weekly closes are more important than other daily closing prices and thus this breakdown is already important even though we haven’t seen the confirmation in the form of three subsequent closes below it.
This means that the outlook for the USD Index just deteriorated and this in turn means that the outlook for the precious metals market just improved.
Platinum’s Breakdown and Its Invalidation
Platinum moved only a bit higher on Friday, but this move was enough to make the entire previous week a bullish development. The reason is that Friday’s closing price – the weekly closing price – was well above the lowest weekly close of 2016.
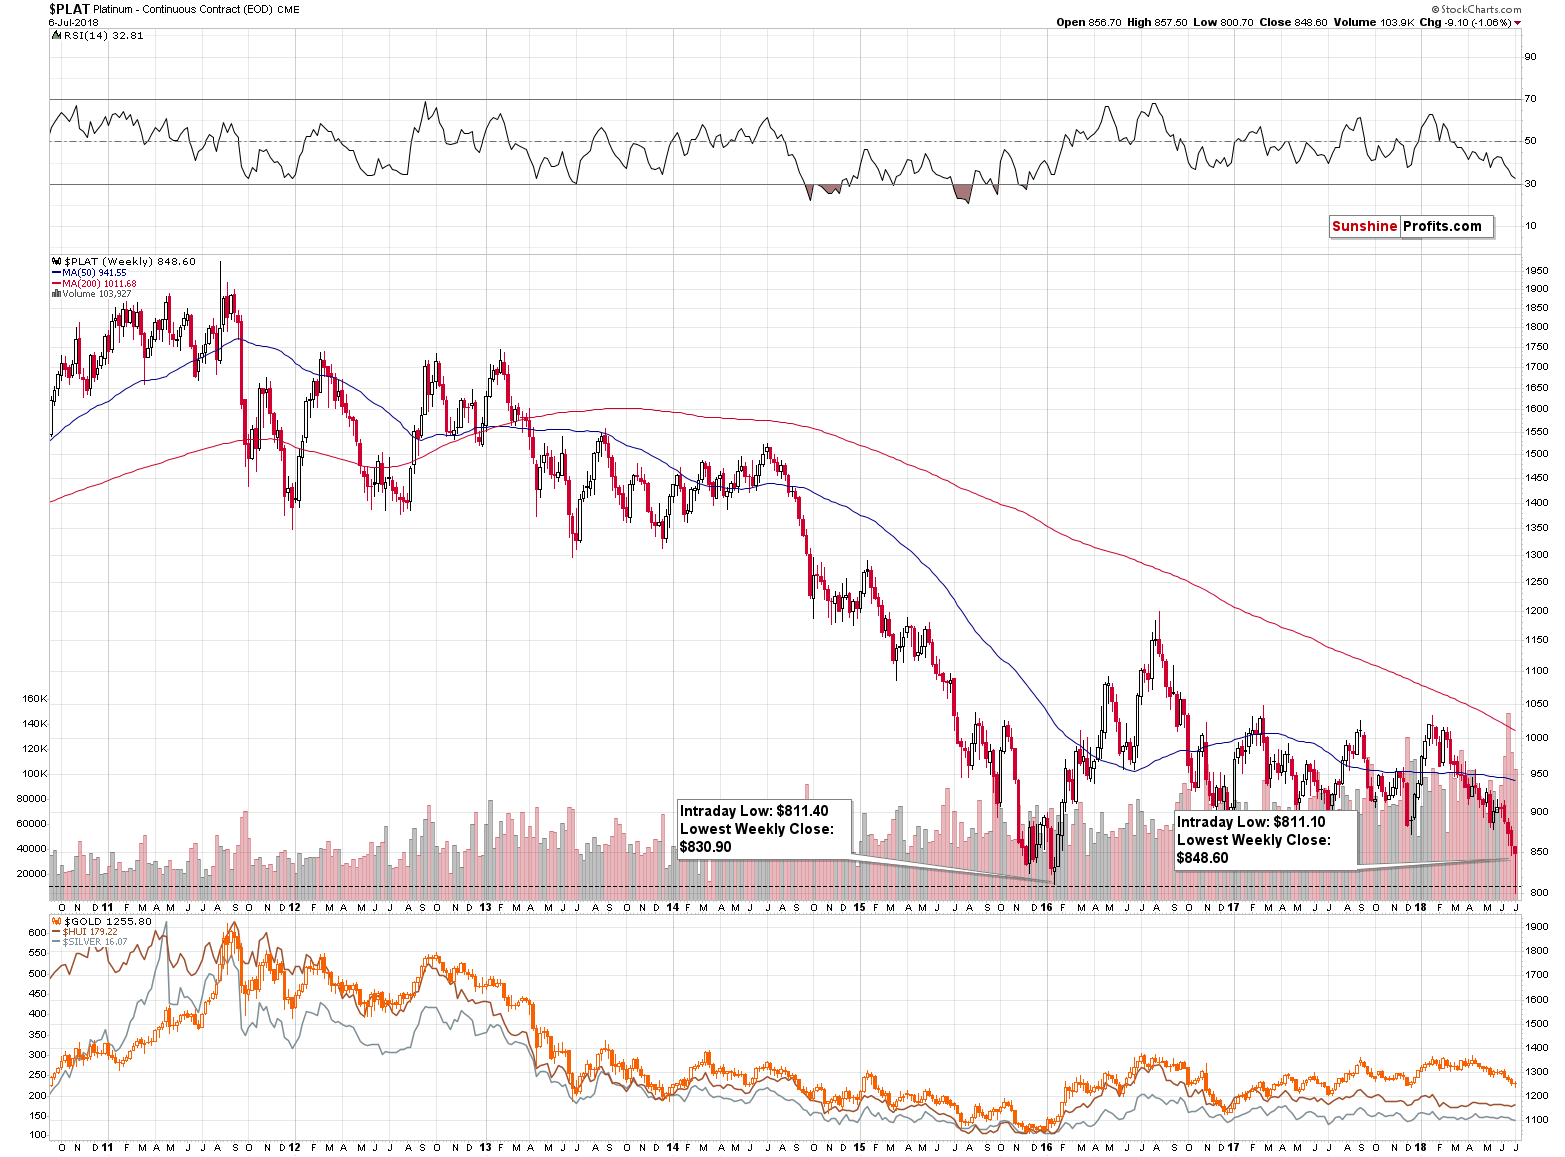
This means that there was no breakdown in weekly terms and the breakdowns that we did see (below the 2016 intraday low and the $800 level) were invalidated in a very fast manner. Both factors are profoundly bullish for platinum at least for this week, and likely for at least two weeks.
This has very bullish implications for the rest of the precious metals sector in the very short term (for this week). We previously explained why platinum is linked to the rest of the precious metals, so in today’s Alert we just want to emphasize that the strength of this link could be temporary – over the medium term, the deviations between markets can become bigger as different parts of the precious metals sector can react to different fundamental and technical information. In particular platinum’s and palladium’s supply and demand situation is specific and these markets don’t have to move in tune with gold and silver in the long term.
The supply is specific as platinum comes mostly from South Africa and Russia, while palladium comes mostly from Russia. The demand side of the market is specific because of the heavy use in the car industry (platinum in diesel catalysts and palladium in gasoline catalysts).
So, since the fundamental picture is not extremely aligned, we shouldn’t bet on the continuation of the direct link between the price of platinum and the rest of the precious metals sector, but it is very likely that it will have positive impact in the next several days.
Before summarizing, we would like to also comment on performance of silver stocks.
Silver Miners’ Bullish Sign
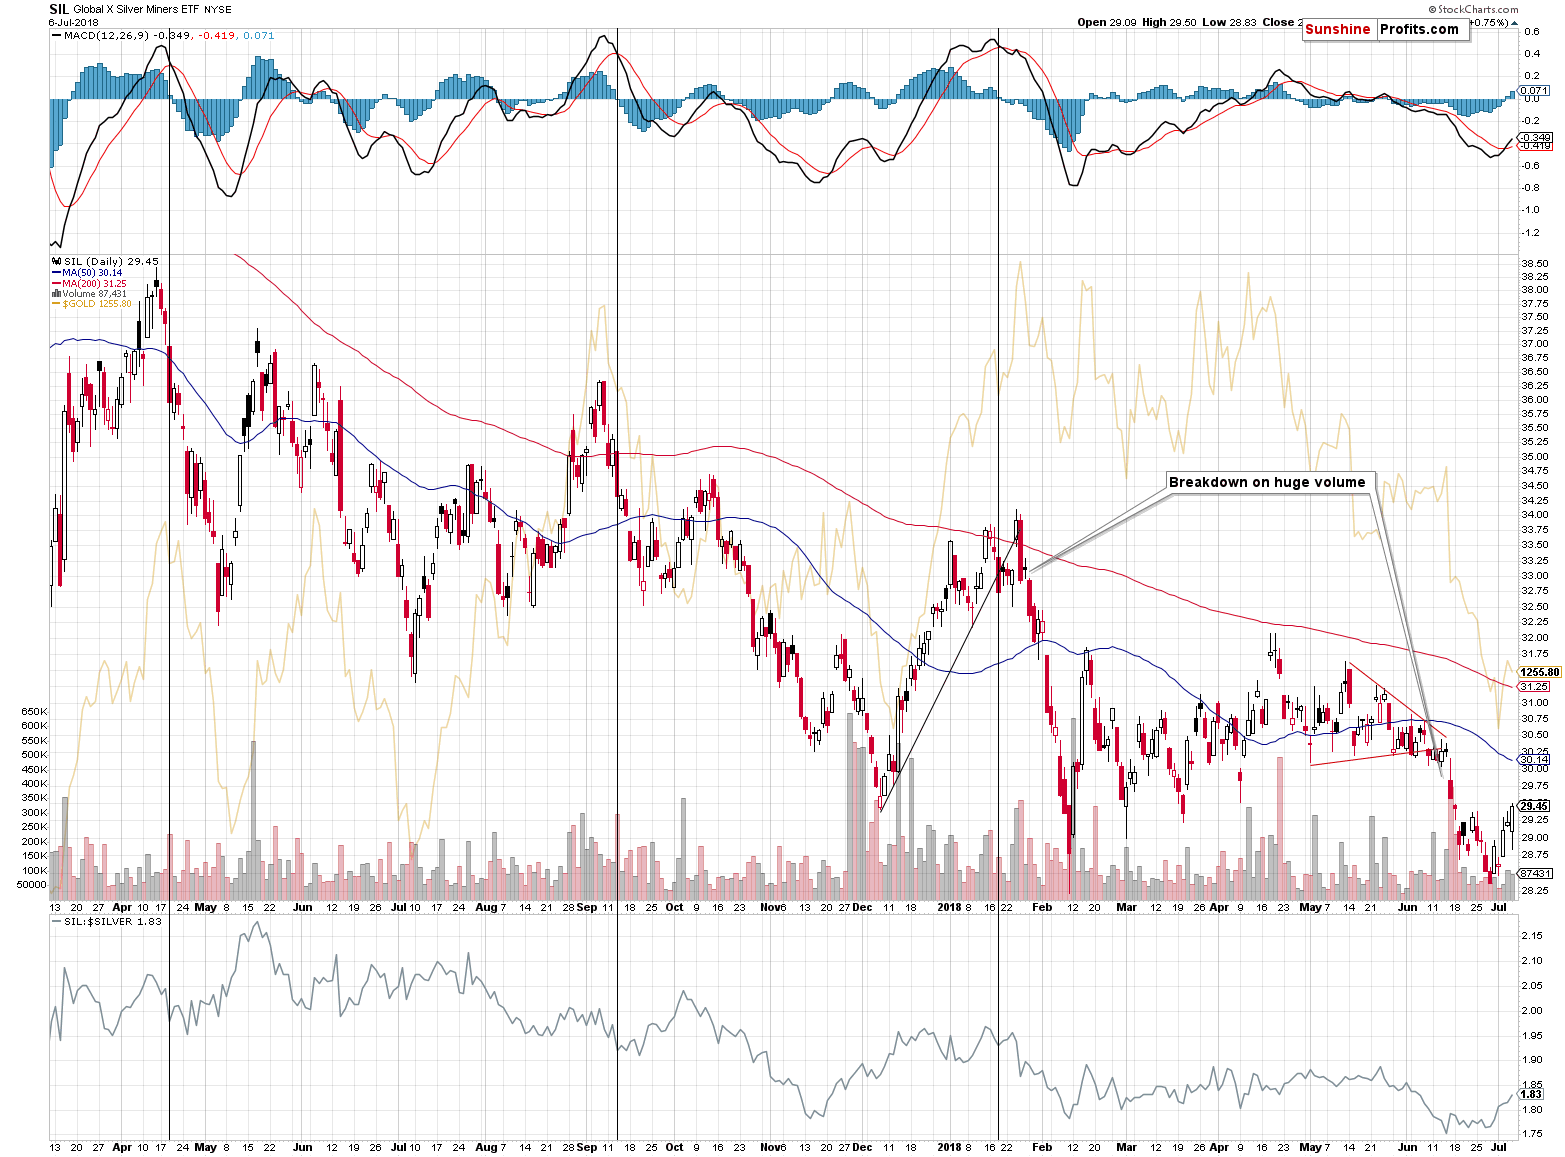
Unlike gold stocks – which generally didn’t do much – silver miners moved once again higher on Friday. This is yet another bullish sign from them. They had continued to show weakness before the slide in June and they are showing continuous strength now – likely indicating an upswing.
Summary
Summing up, even though practically nothing happened in the most popular parts of the precious metals sector, Friday’s session was actually very rich in signals. The weekly closing prices of platinum and USD Index have very bullish implications for the precious metals sector and we can say the same about the strength that we saw in the silver stocks and the extremely low volume that we saw in the GLD ETF. Even though the medium-term outlook remains bearish, it seems that we’ll see higher gold, silver and mining stock prices in the short term and that the profits from our long position in gold, silver and mining stocks will increase further.
As always, we’ll keep you – our subscribers – informed.
To summarize:
Trading capital (supplementary part of the portfolio; our opinion): Full long positions (200% of the full position) in gold, silver and mining stocks are justified from the risk/reward perspective with the following stop-loss orders and initial target price levels:
- Gold: initial target price: $1,298; stop-loss: $1,228; initial target price for the UGLD ETN: $10.37; stop-loss for the UGLD ETN $8.67
- Silver: initial target price: $16.72; stop-loss: $15.57; initial target price for the USLV ETN: $10.47; stop-loss for the USLV ETN $8.47
- Mining stocks (price levels for the GDX ETF): initial target price: $22.97; stop-loss: $21.47; initial target price for the NUGT ETF: $26.17; stop-loss for the NUGT ETF $21.84
In case one wants to bet on junior mining stocks' prices (we do not suggest doing so – we think senior mining stocks are more predictable in the case of short-term trades – but if one wants to do it anyway, we provide the details), here are the stop-loss details and initial target prices:
- GDXJ ETF: initial target price: $33.57; stop-loss: $31.58
- JNUG ETF: initial target price: $14.58 stop-loss: $12.38
Long-term capital (core part of the portfolio; our opinion): No positions (in other words: cash)
Insurance capital (core part of the portfolio; our opinion): Full position
Important Details for New Subscribers
Whether you already subscribed or not, we encourage you to find out how to make the most of our alerts and read our replies to the most common alert-and-gold-trading-related-questions.
Please note that the in the trading section we describe the situation for the day that the alert is posted. In other words, it we are writing about a speculative position, it means that it is up-to-date on the day it was posted. We are also featuring the initial target prices, so that you can decide whether keeping a position on a given day is something that is in tune with your approach (some moves are too small for medium-term traders and some might appear too big for day-traders).
Plus, you might want to read why our stop-loss orders are usually relatively far from the current price.
Please note that a full position doesn’t mean using all of the capital for a given trade. You will find details on our thoughts on gold portfolio structuring in the Key Insights section on our website.
As a reminder – “initial target price” means exactly that – an “initial” one, it’s not a price level at which we suggest closing positions. If this becomes the case (like it did in the previous trade) we will refer to these levels as levels of exit orders (exactly as we’ve done previously). Stop-loss levels, however, are naturally not “initial”, but something that, in our opinion, might be entered as an order.
Since it is impossible to synchronize target prices and stop-loss levels for all the ETFs and ETNs with the main markets that we provide these levels for (gold, silver and mining stocks – the GDX ETF), the stop-loss levels and target prices for other ETNs and ETF (among other: UGLD, DGLD, USLV, DSLV, NUGT, DUST, JNUG, JDST) are provided as supplementary, and not as “final”. This means that if a stop-loss or a target level is reached for any of the “additional instruments” (DGLD for instance), but not for the “main instrument” (gold in this case), we will view positions in both gold and DGLD as still open and the stop-loss for DGLD would have to be moved lower. On the other hand, if gold moves to a stop-loss level but DGLD doesn’t, then we will view both positions (in gold and DGLD) as closed. In other words, since it’s not possible to be 100% certain that each related instrument moves to a given level when the underlying instrument does, we can’t provide levels that would be binding. The levels that we do provide are our best estimate of the levels that will correspond to the levels in the underlying assets, but it will be the underlying assets that one will need to focus on regarding the signs pointing to closing a given position or keeping it open. We might adjust the levels in the “additional instruments” without adjusting the levels in the “main instruments”, which will simply mean that we have improved our estimation of these levels, not that we changed our outlook on the markets. We are already working on a tool that would update these levels on a daily basis for the most popular ETFs, ETNs and individual mining stocks.
Our preferred ways to invest in and to trade gold along with the reasoning can be found in the how to buy gold section. Additionally, our preferred ETFs and ETNs can be found in our Gold & Silver ETF Ranking.
As a reminder, Gold & Silver Trading Alerts are posted before or on each trading day (we usually post them before the opening bell, but we don't promise doing that each day). If there's anything urgent, we will send you an additional small alert before posting the main one.
=====
Hand-picked precious-metals-related links:
PRECIOUS-Gold prices hit two-week high on short covering, weaker dollar
Gold-backed ETFs saw outflows in all regions except Europe
India June Gold Imports fall from year ago
=====
In other news:
Global stocks hit two-week high as U.S. jobs report spreads relief
Sea of red in Treasury market may signal bond boom is over
Theresa May Faces Crisis Over Brexit After Key Ministers Quit
JPMorgan Maps Out Currencies to Buy If Recession Is Coming
The making of a global trade war
Carney should heed employment experts before rate decision
Dreams of Goldman Doing Big Takeover Meet Stress Test’s Reality
Oil steadies as drilling increases in tight market
=====
Thank you.
Sincerely,
Przemyslaw Radomski, CFA
Founder, Editor-in-chief, Gold & Silver Fund Manager
Gold & Silver Trading Alerts
Forex Trading Alerts
Oil Investment Updates
Oil Trading Alerts

