

Briefly: in our opinion, full (250% of the regular size of the position) speculative short positions in gold, silver and mining stocks are justified from the risk/reward perspective at the moment of publishing this alert.
After breakdowns below the psychologically important $1,200 in gold, and $15 in silver, the decline is picking up momentum. There seems be no end in sight. But, all things come to an end. In particular, no price move can go on forever. There will be some corrections along the way and the key questions are: “At what price will the next one start?” and “What one should do about it?” Hint: we’ll likely to profit even more before that happens.
As far as the price targets are concerned, our yesterday’s comments remain up-to-date.
The decline that we see is most likely just the first part of a huge decline and multiple signals have been pointing to this outcome.
As far as this month is concerned, gold is likely to move to $1,120 - $1,130, silver is likely to move to about $13.60 - $13.85 or so (the 2015 bottom) and the price target for mining stocks is rather unclear, with the most likely target area being 100 – 120 for the HUI Index, and $13 - $15 for the GDX ETF.
But, the critical detail here is that even though the above is more likely, we actually want to be prepared for the less likely, but more lucrative scenario that could still take place. Namely, gold might not stop at $1,120 - $1,130, but slide right through it and go right to the 2015 bottom at approximately $1,050. That’s something that would be more in tune with the size of the April 2013 slide, and we have profit-take orders in place to take us out close to the above price target if this move happens overnight or perhaps too fast for us to react manually. In other words, we may exit the short positions (and perhaps enter long ones, but that’s not very likely) with gold close to $1,120 - $1,130, but only if we get bullish confirmations. This price area – by itself – is not sufficient to make the outlook bullish or neutral.
Having said that, let’s take a look at the charts and see what happened yesterday (charts courtesy of http://stockcharts.com).
USDX Breakout
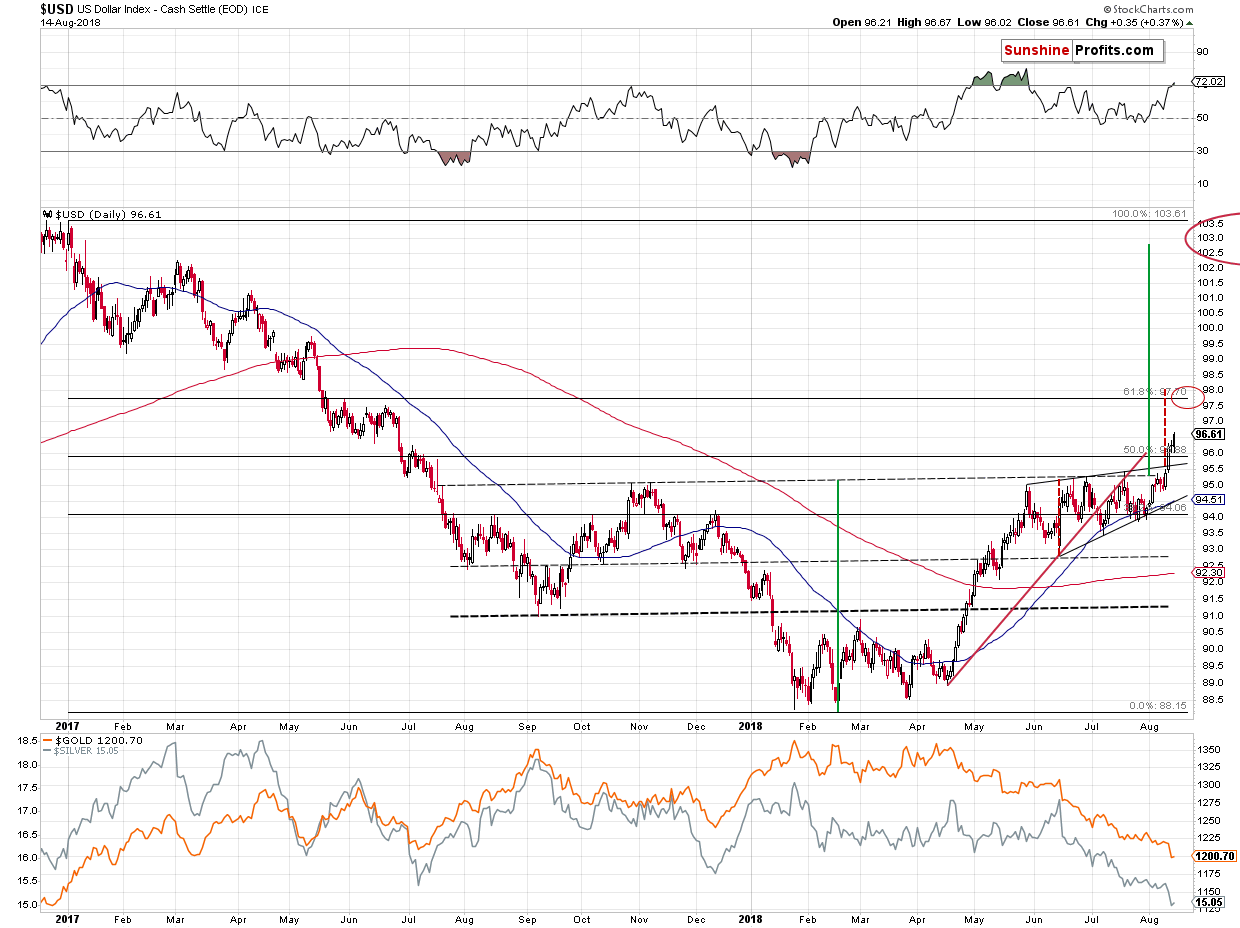
In yesterday’s analysis, we wrote the following about the above USDX chart:
Nothing really happened yesterday and that was a very important nothing. This “nothing” means that there was no invalidation of the previous breakout and it’s becoming very likely that the breakout will be confirmed by yet another close today. This will confirm a breakout above both the rising wedge pattern and the big, medium-term, reverse head-and-shoulders pattern. The former suggests a move to about 98, and the latter suggest a move to about 103.
Both are very bullish for the USDX and bearish for the precious metals market. We might have a situation in which the USDX rallies to 98 first, then corrects and then moves up higher – to 103 or so. This could result in mirror moves in the precious metals market.
The breakouts were indeed confirmed. The implications are very bullish for the following weeks and months.
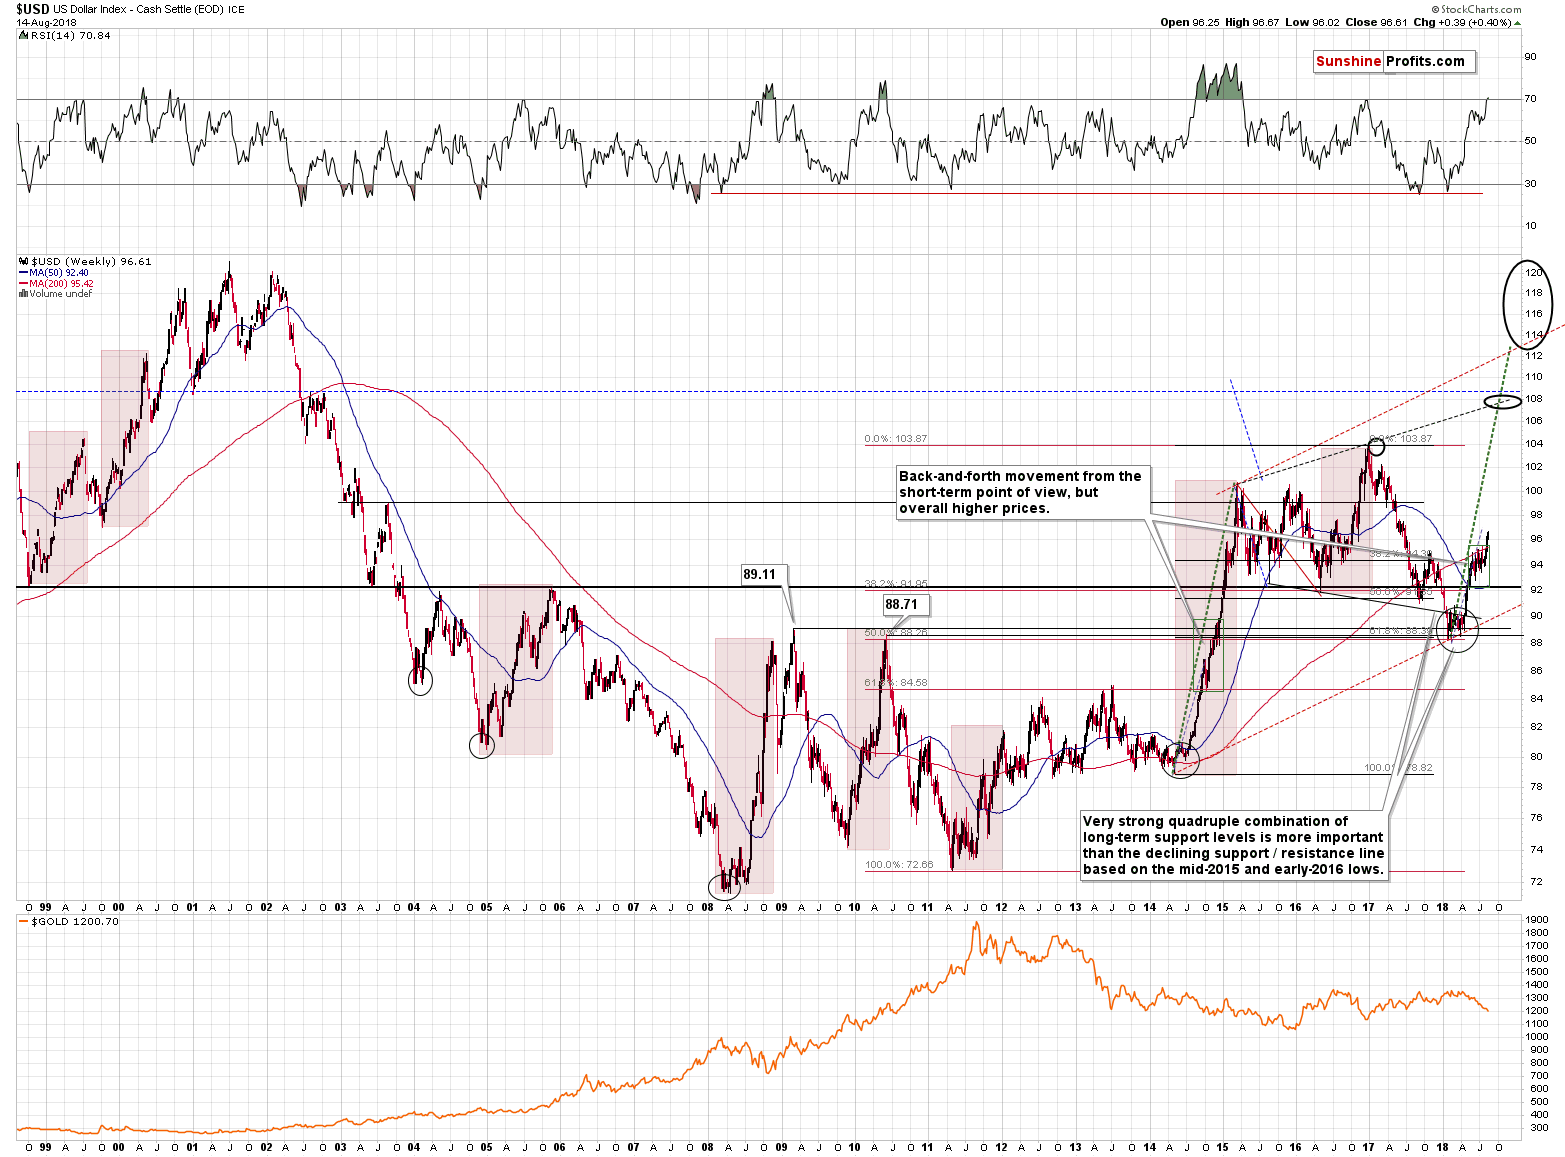
The rally may appear already too big from the short-term point of view, but it is not the short term that is most important. It is the long-term perspective that matters the most as it is a big medium-term rally that we are discussing here.
Based on the initial shape of the move, on the shape of the recent consolidation (higher lows) and on the size of the rally until the first pause took place, we can say that this is a big rally. Even if we take the entire 2018 rally into account, then the move is still only about halfway done if we compare it to the previous 3 big rallies: the 2008, 2010, and 2014-2015 ones. History tends to repeat itself, so we should be prepared for another big wave higher in the USDX.
We have intermediate resistance at about 98 (visible on the short-term chart), then at about 103 (the 2017 high) and then at about 108, and then finally at about 113.
Interestingly, if the USD Index is going to rally just like it did in 2014 and 2015, then we might see it at 108 in October. It seems unthinkable, we know, but that’s exactly how sharp the rally was just a few years ago and history does indeed like to repeat itself. And it’s been repeating itself so far.
The implications are extremely bearish for the precious metals market for the next several weeks – months.
Having said that, let’s take a look at what happened in gold, silver, and mining stocks.
More Relative Confirmations
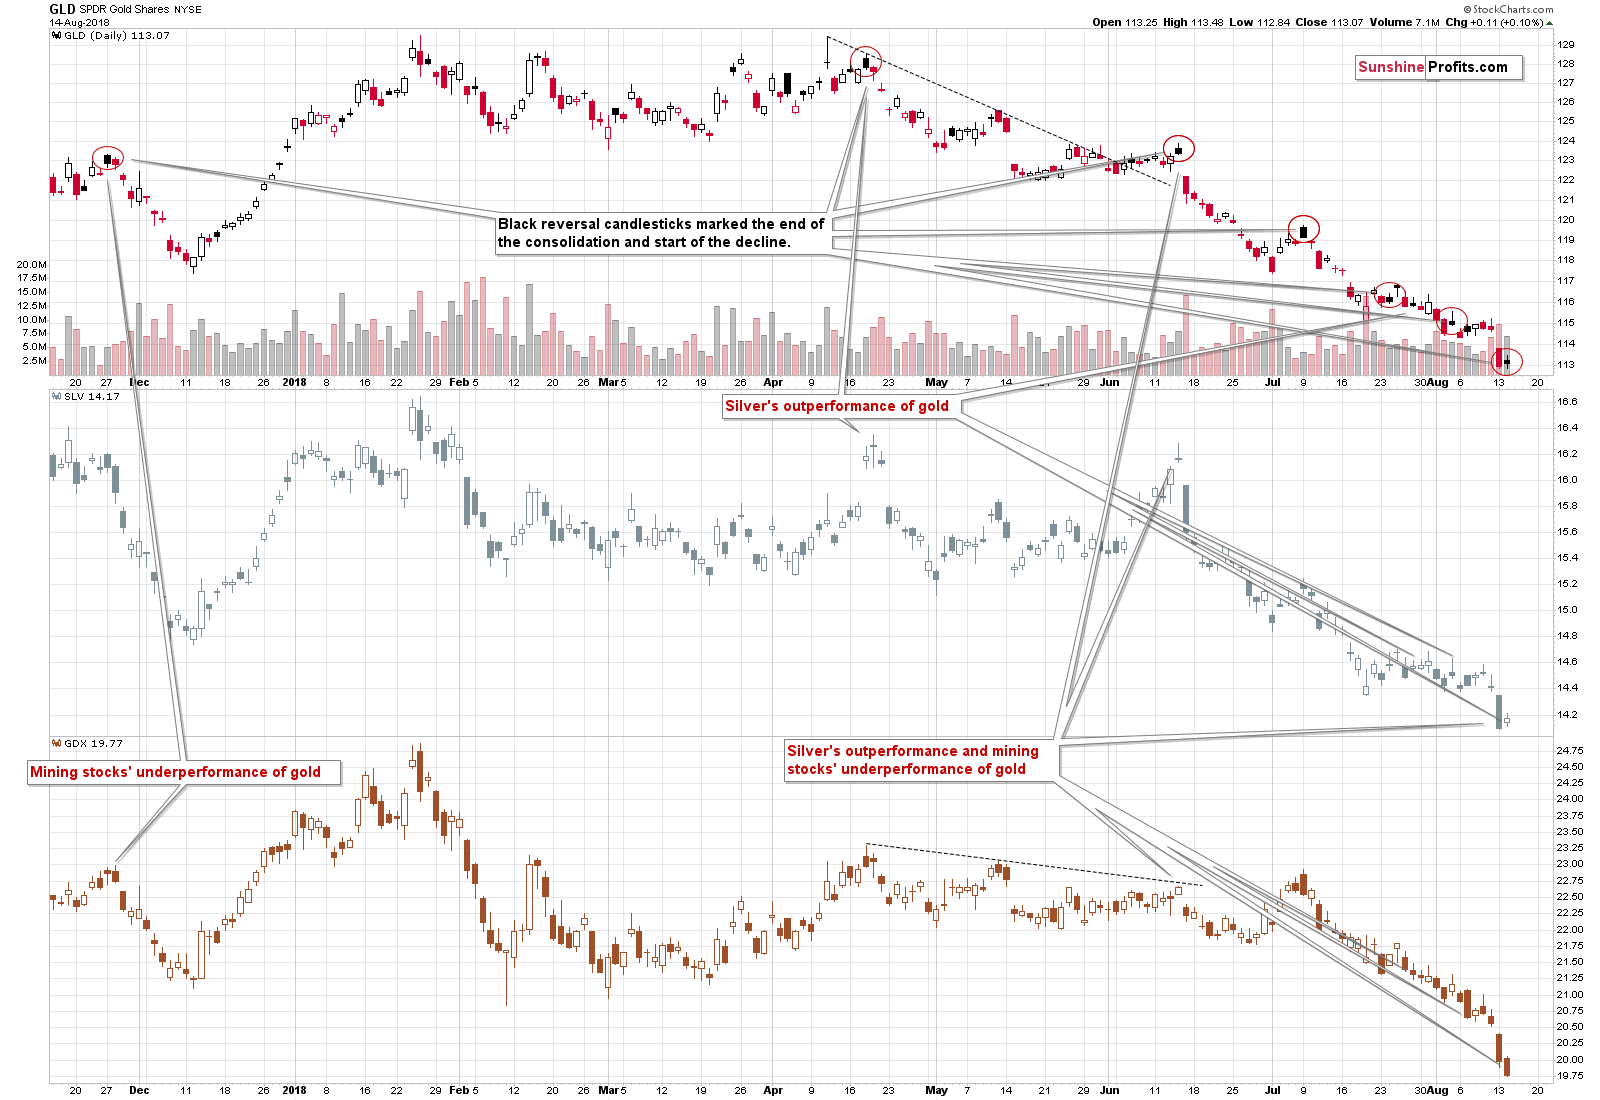
The relative strength of silver and relative weakness of mining stocks provided us with multiple profitable sell signals in the past several months. The opposite could be a bullish signal, but we haven’t seen one. We saw yet another bearish confirmation. Silver showed some short-term strength by moving a bit higher, gold was practically flat, and miners underperformed. That’s the most bearish combination that we could get as miners tend to underperform before declines and silver tends to outperform.
Interestingly, gold formed a black candlestick, which means that it closed higher than on the previous trading day, but below the opening prices. These sessions served as bearish confirmations previously and the implications are once again bearish at this time.
As far as details behind our near-term price targets are concerned, our yesterday’s comments remain up-to-date:
Gold’s Near-Term Outlook
From the long-term point of view, it’s even clearer that the only nearby support level is provided by the December 2016 low. The higher local bottoms are not even visible from this perspective. The next key support is at the December 2015 low, but gold will need to get below the former support first. Naturally, it is possible for gold to slide through it without looking back and we are prepared for this scenario by having exit price orders below the December 2016 lows (closer to the December 2015 low in gold), but it’s more likely that we’ll see some kind of local bottom with gold at $1,120 - $1,130 or so.
Silver’s Near-term Outlook
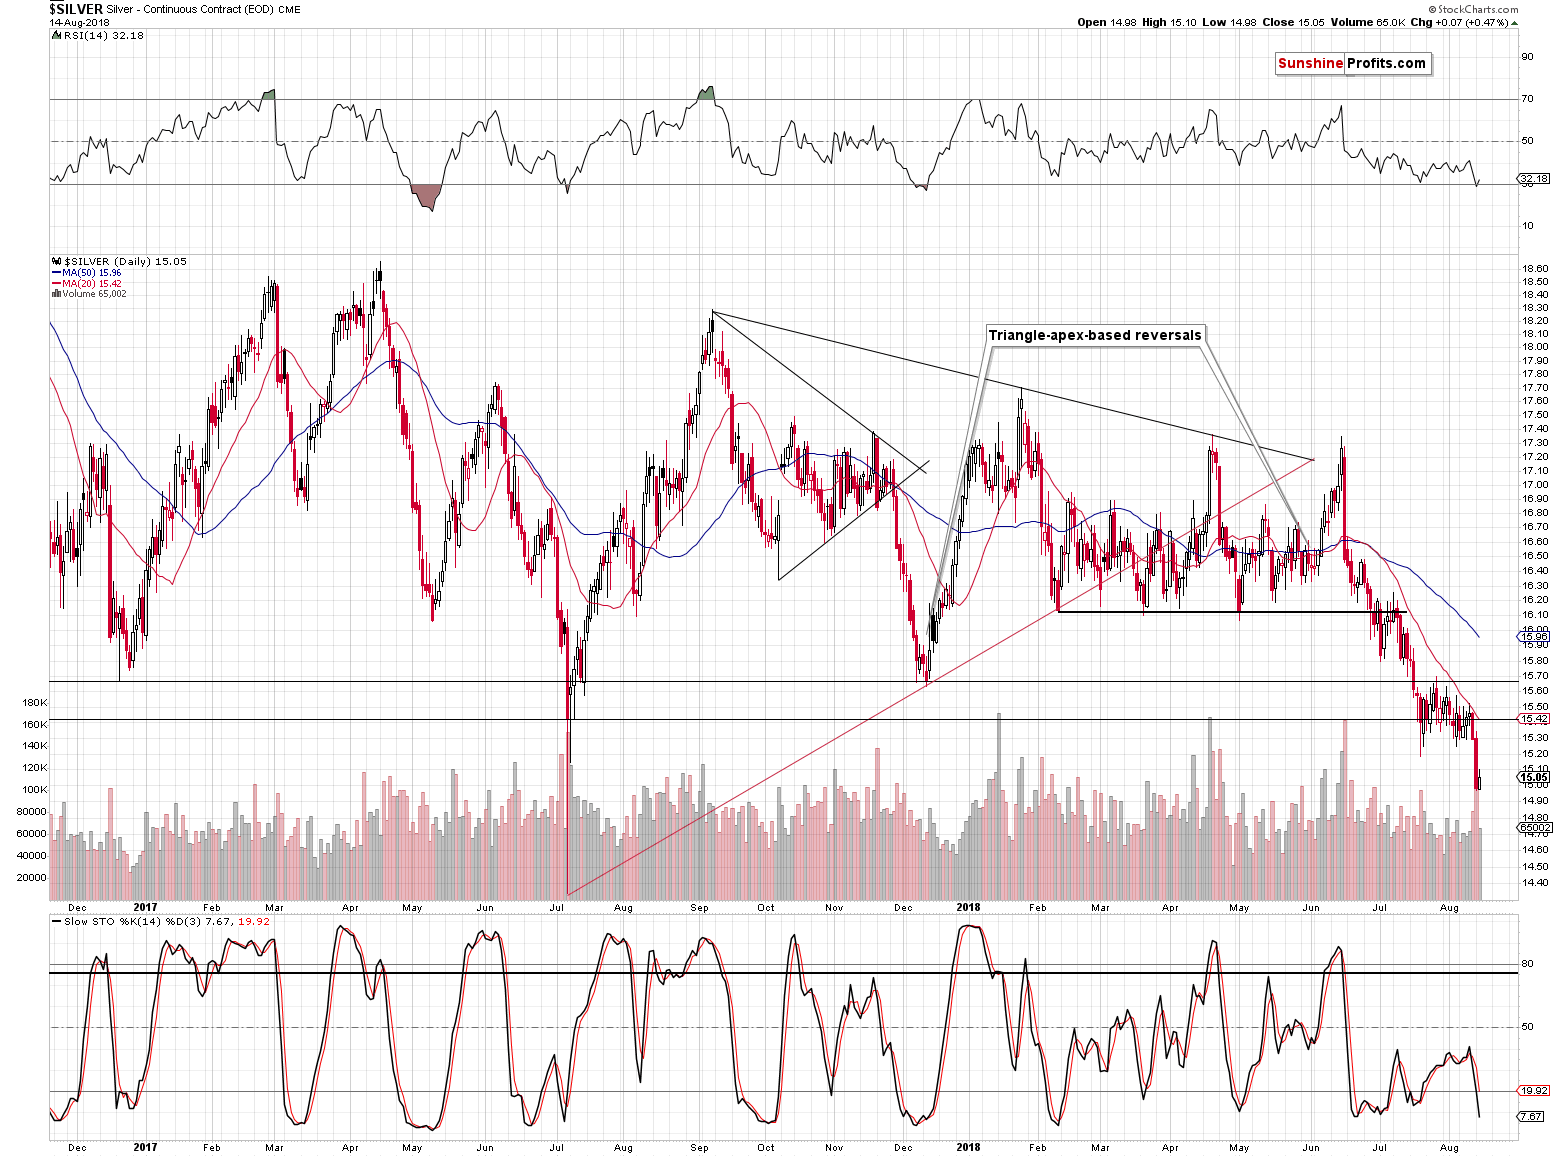
The breakdown was definitely confirmed as silver closed about 50 cents below the lowest daily close of 2017. The outlook is clearly bearish, but the near-term target price isn’t. At least not based on the above chart.
The rising, dashed, red line is too close to provide any reasonable support (assuming gold is going to move to $1,130 or so). The intraday 2017 bottom seems important, but the intraday / overnight extremes are often not as important as the daily closes. The next support is provided by the December 2015 lows.
But, can silver really move that low shortly?
One of the ways to determine a near-term target in a market that’s connected to a market for which we already have a target, is to check the relative dynamics. That’s a fancy name for checking how a given market multiplied the other market’s moves during the most recent price swing. It’s important to use the “most recent” move because the dynamics change over time.
We’ll use the downswing that started in July and ended yesterday. We’ll use this particular move because that’s the most short-term move that seems similar in terms of strength of reaction in gold, silver and gold stocks (we’ll use the same technique to the latter in the next section).
Gold’s highest closing price of July was $1,259.60 and it closed at $1,198.90 yesterday.
Silver’s highest closing price of July was $16.14 and it closed at $14.98 yesterday.
Gold declined by 4.82%, while silver declined by 7.19%. This means that silver magnified gold’s decline by 1.49. In other words, silver declined approximately 50% more than gold.
If this remains in place and we expect gold to decline from $1,198.90 to $1,125 (by 6.16%), we can expect silver to decline by 50% more. This means a decline of 1.49 * 6.16% = 9.18%. Since silver closed at $14.98, this means a move to $13.60.
Silver’s 2015 low was $13.62, so the above is a clear indication that silver will indeed be likely to decline to its 2015 lows if gold moves to its late 2016 lows.
Naturally, silver may form a temporary bottom higher – perhaps at $13.85 or so, but it does look like we’re about to see another $1+ slide in the price of the white metal.
Mining Stocks Near-term Outlook
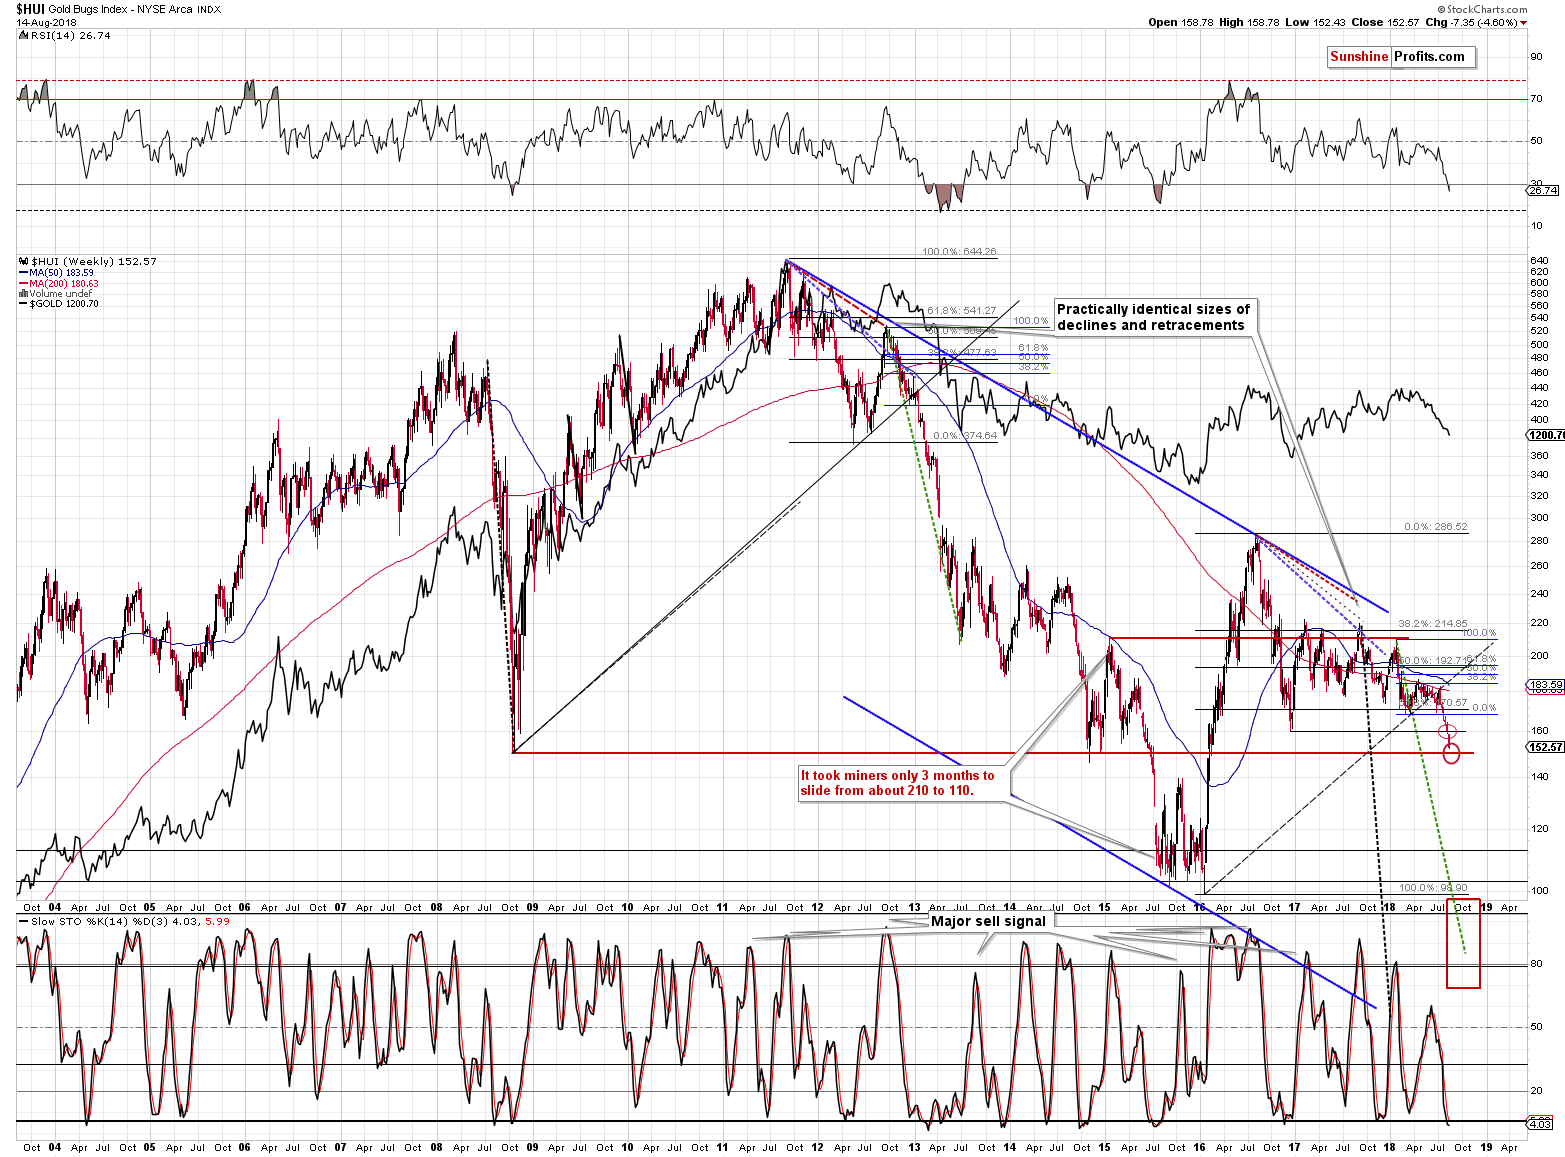
From the long-term point of view, we (…) have the 2008 bottom at 150, but it’s too close to be analogous to gold at $1,120 -$1,130 and we have the late 2015 top at about 140. There were also several local tops at about 120.
Let’s see what the relative dynamics tell us.
Gold’s highest closing price of July was $1,259.60, and it closed at $1,198.90 yesterday.
The HUI’s highest closing price of July was $179.70, and it closed at 154.52 yesterday.
Gold declined by 4.82%, while the HUI declined by 14.01%. This means that gold stocks magnified gold’s decline by 2.91. In other words, the HUI Index declined approximately 200% more than gold.
If this remains in place and we expect gold to decline from $1,198.90 to $1,125 (by 6.16%), we can expect HUI to decline by 200% more. This means a decline of 2.91 * 6.16% = 17.93%. Since HUI closed at 154.52, this means a move to 126.81.
This level doesn’t directly correspond to any other significant extreme, but it shows us more or less what to expect.
Based on our research (we will release a big research report on this in the following weeks), mining stocks tend to be the first to move in both directions, up or down, while silver tends to catch up in the final part of the move. This is more visible in the case of rallies, but this might also be useful during the current decline.
This is the early part of the decline, which suggests that mining stocks may get ahead of themselves and perhaps decline more than the relative dynamics suggest. This means that the next target would be between 100 and 120. That’s a rather wide target area but based on the details that we have right now we simply don’t have greater clarity.
As far as the GDX is concerned, this means a target between $13 and $15.
But, the most important signal will come from the gold market. If it moves below $1,150, we’ll check what nearby support levels we have for silver and mining stocks and these will become our target prices.
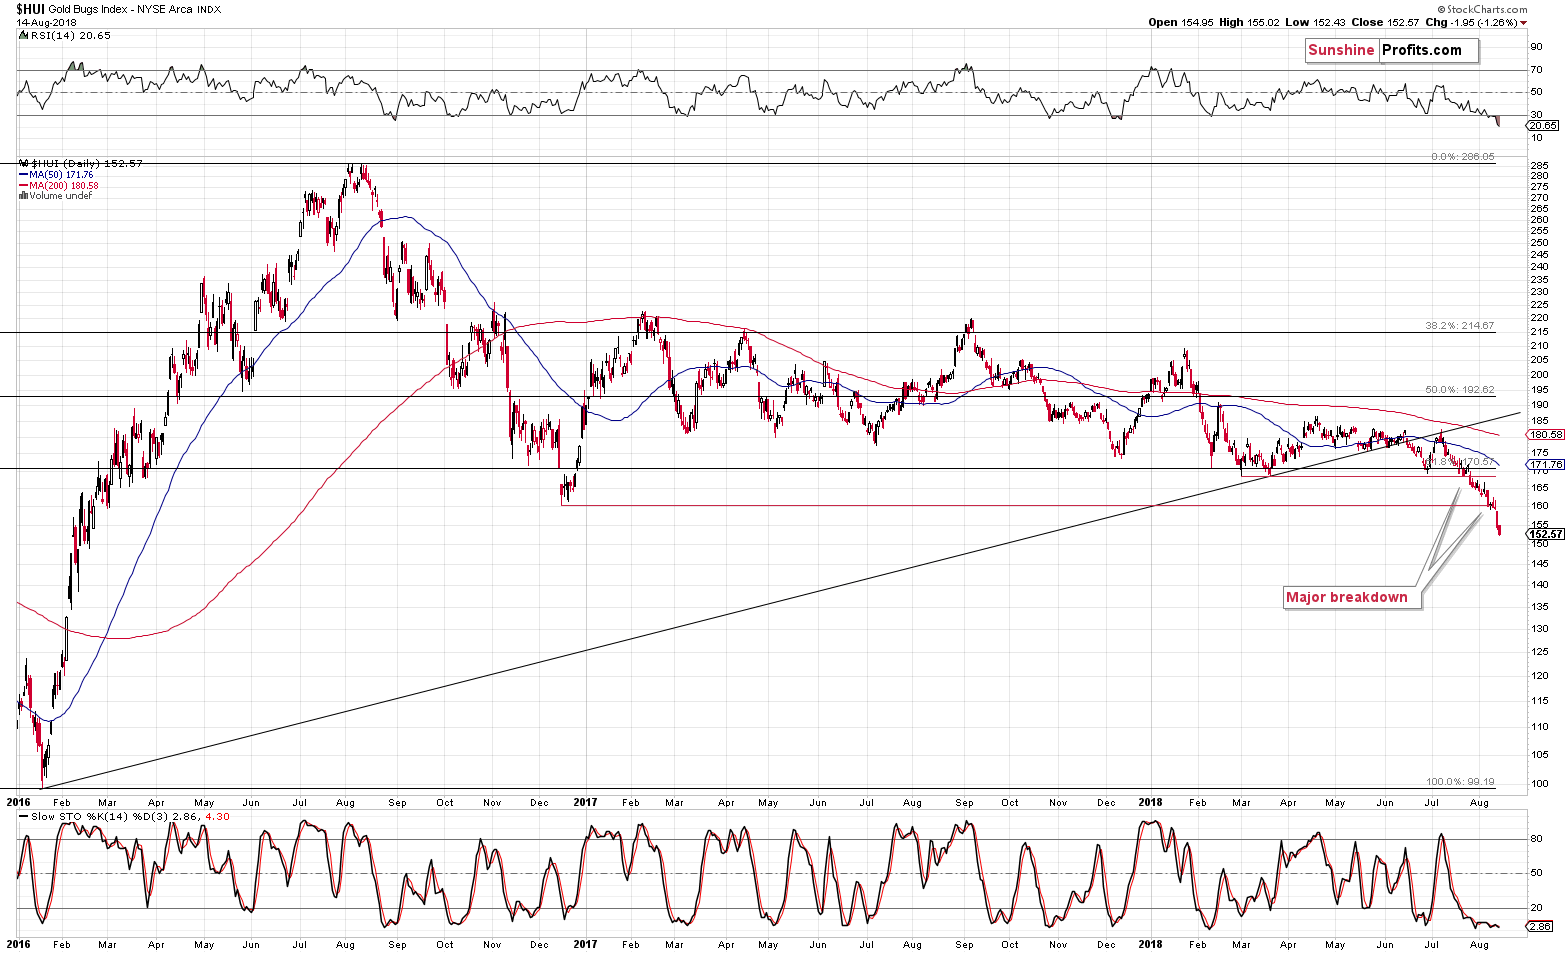
From the short-term point of view, we see that the decline simply continues after the breakdown. No strong support was reached, so gold stocks are likely to fall further.
Speaking of gold stocks, we saw a new development in their ratio to gold.
Gold Stocks to Gold Ratio Breakdown
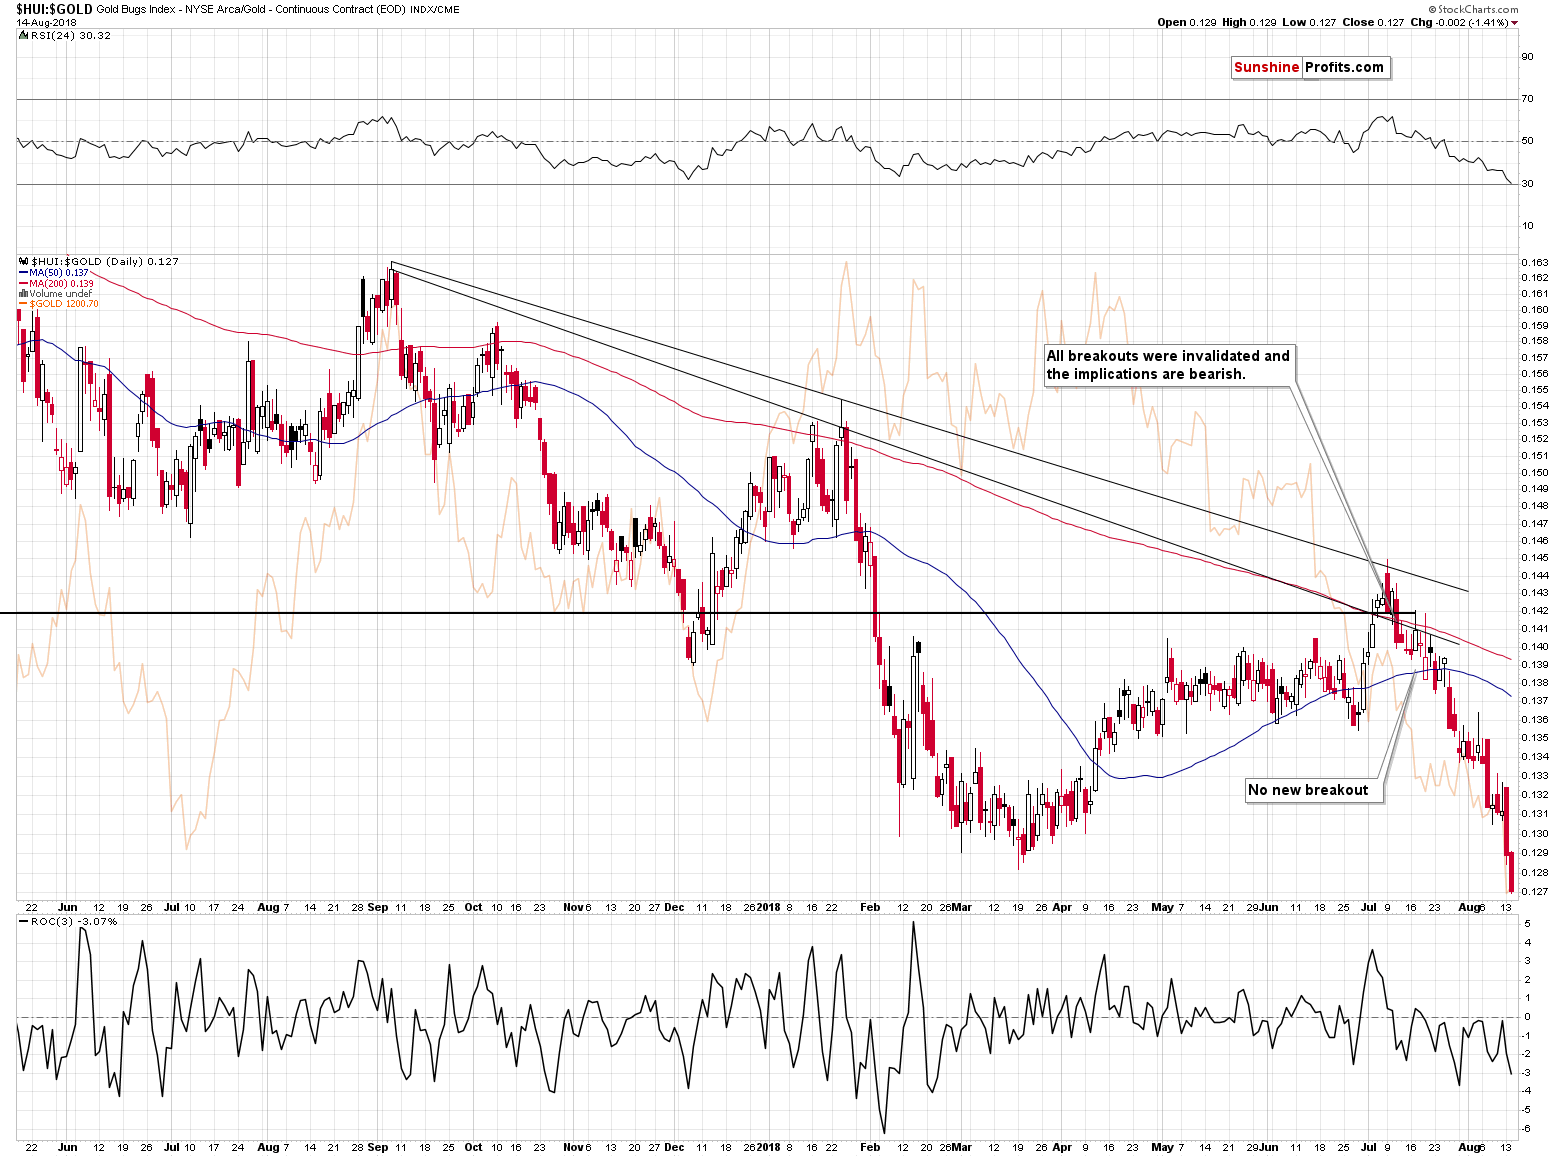
The ratio broke and closed the day below the previous 2018 lows. The implications are bearish as this ratio tends to move in tune with gold and sometimes heralds bigger moves.
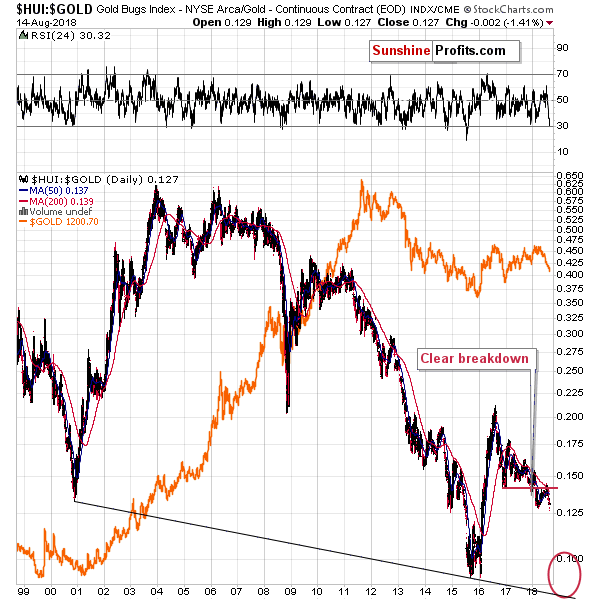
The rally in the ratio was an indication of a meaningful upswing in 2016 and in 2001. It’s decline in 2011 showed that the rally in gold was not to be trusted. The current breakdown below the previous 2018 lows that follows a much more important breakdown below the late 2016 lows makes the outlook very bearish for the upcoming weeks and months.
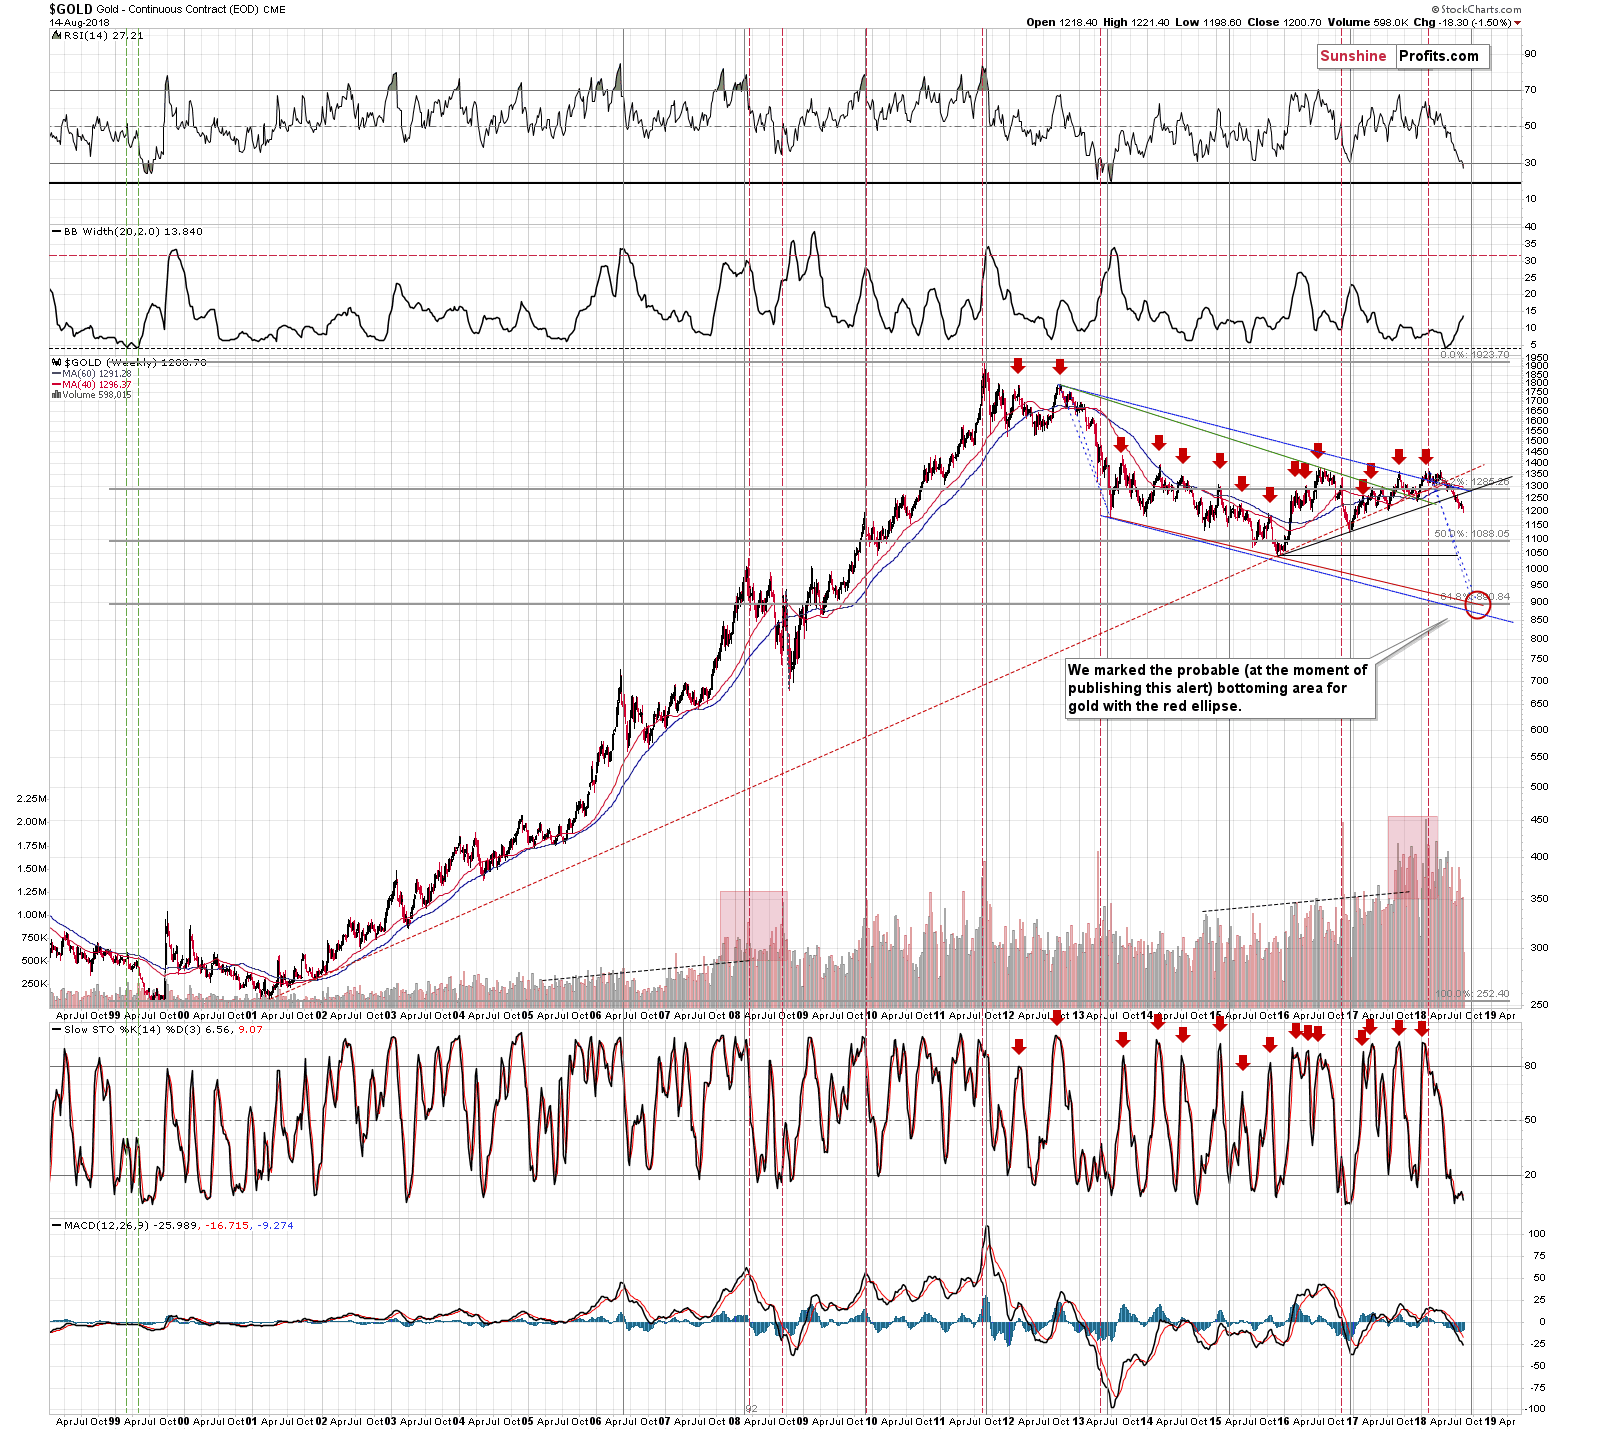
Before summarizing, we would like to once again write about our final downside targets for gold, silver, and mining stocks.
Final Price Targets
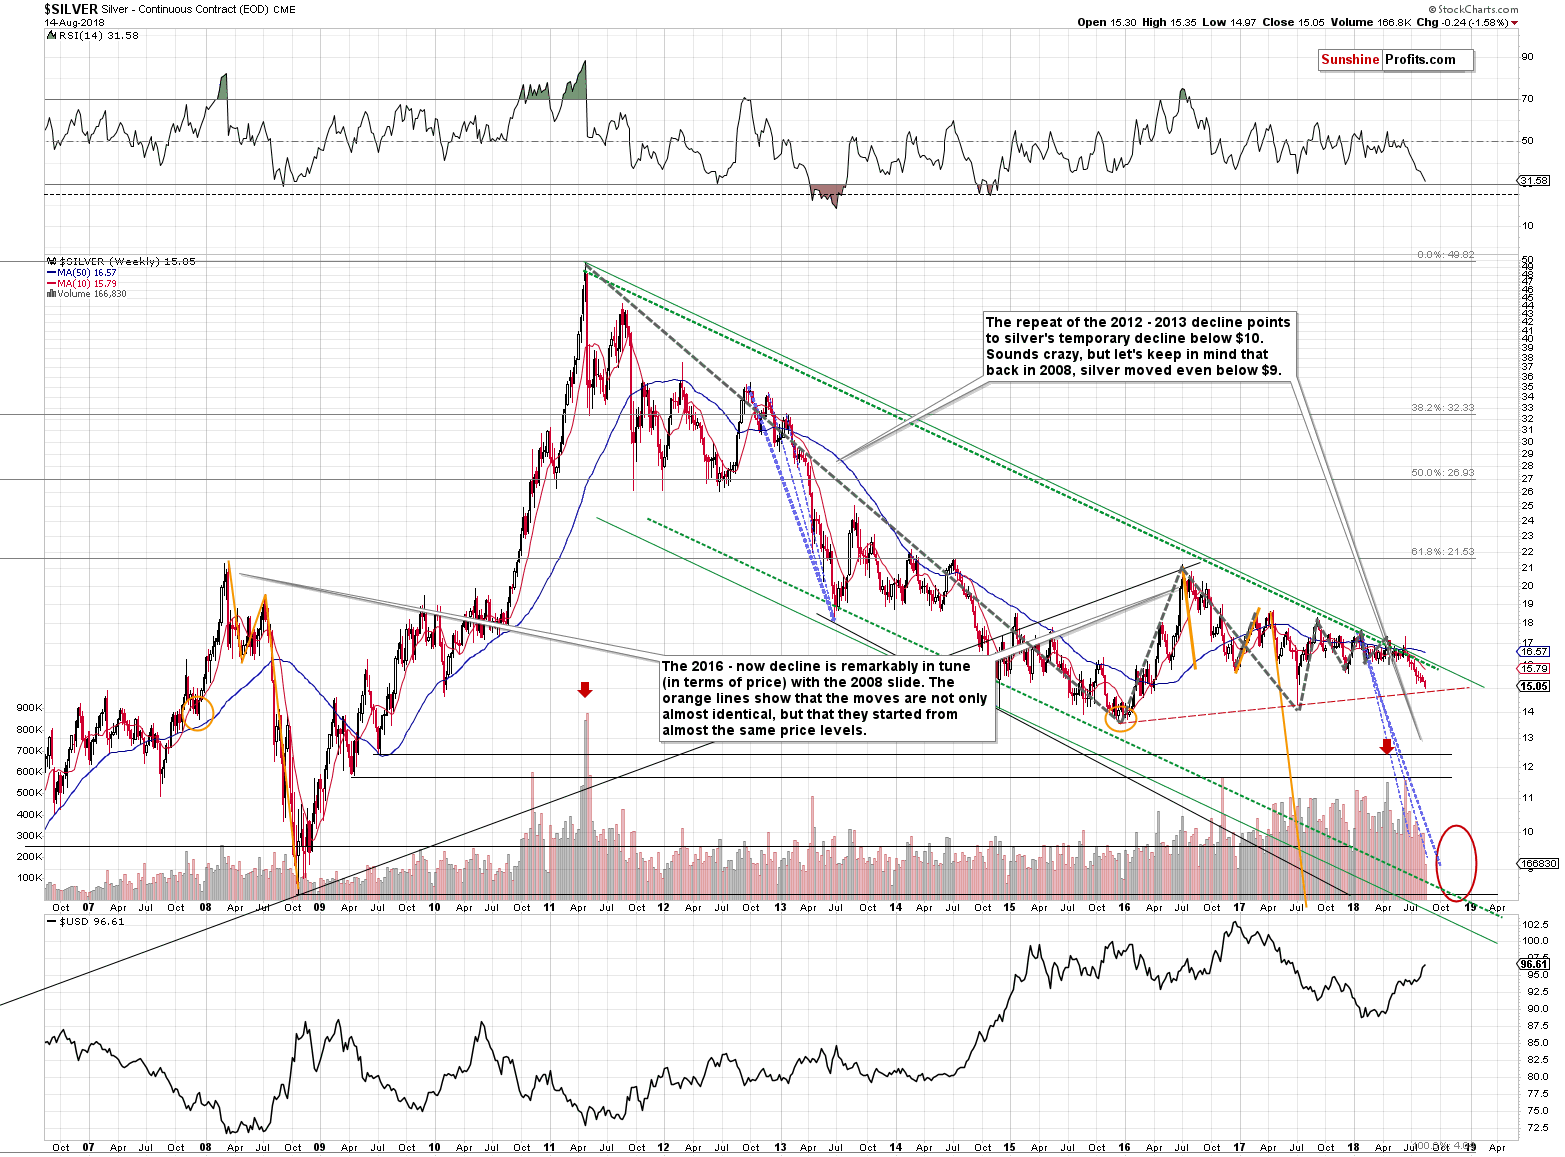
As you may recall, our final target for gold is at about $890 and the price target for silver is below $10, perhaps at $8.90 as that’s what the gold silver ratio at 100 would imply.
We haven’t recently discussed the price targets for the miners and the reason is the lack of clarity concerning them. We expect the miners to move below their 2015 and 2016 lows, but the extent of the breakdown is unclear.
The 80 level in the HUI Index is definitely possible and 60 is extremely oversold, but still possible. This means that GDX could decline to $10 or even $7. GDX has been holding up better than the HUI, so it might be the case that the actual bottom is formed at $12 - $10, instead of $10 - $7. The analogous price range for the GDXJ is $17 - $14.
Summary
Summing up, there are multiple very meaningful reasons due to which the precious metals sector is likely to move lower in the following weeks and months and this week’s declines show that the slide has already begun. In other words, it seems that our sizable profits on the short positions are going to become even bigger shortly. We may have a local bottom later this month, though, and we’ll keep you informed regarding the possibility of seeing a bigger turnaround.
On a different note, we would like to remind you that it is still possible to subscribe to our services using the lifetime subscription type. This means no more price increases, no hassle with updating card details and no risk of disrupting the access to our service. And it’s cheaper over the very long run. The profits on the current position (and in this year overall) are likely huge and the above might be a very good way to re-invest the gains in the signals that contributed to them. If you’re interested, please contact us for details.
As always, we will keep you – our subscribers – informed.
To summarize:
Trading capital (supplementary part of the portfolio; our opinion): Full short positions (250% of the full position) in gold, silver and mining stocks are justified from the risk/reward perspective with the following stop-loss orders and exit profit-take price levels:
- Gold: profit-take exit price: $1,062; stop-loss: $1,272; initial target price for the DGLD ETN: $82.96; stop-loss for the DGLD ETN $46.38
- Silver: profit-take exit price: $12.72; stop-loss: $16.46; initial target price for the DSLV ETN: $46.97; stop-loss for the DSLV ETN $24.07
- Mining stocks (price levels for the GDX ETF): profit-take exit price: $13.12; stop-loss: $23.64; initial target price for the DUST ETF: $80.97; stop-loss for the DUST ETF $20.87
Note: the above is a specific preparation for a possible sudden price drop, it does not reflect the most likely outcome. You will find more detailed explanation in our August 1 Alert. In case one wants to bet on junior mining stocks’ prices (we do not suggest doing so – we think senior mining stocks are more predictable in the case of short-term trades – if one wants to do it anyway, we provide the details), here are the stop-loss details and target prices:
- GDXJ ETF: profit-take exit price: $17.52; stop-loss: $34.82
- JDST ETF: initial target price: $154.97 stop-loss: $42.78
Long-term capital (core part of the portfolio; our opinion): No positions (in other words: cash)
Insurance capital (core part of the portfolio; our opinion): Full position
Important Details for New Subscribers
Whether you already subscribed or not, we encourage you to find out how to make the most of our alerts and read our replies to the most common alert-and-gold-trading-related-questions.
Please note that the in the trading section we describe the situation for the day that the alert is posted. In other words, it we are writing about a speculative position, it means that it is up-to-date on the day it was posted. We are also featuring the initial target prices, so that you can decide whether keeping a position on a given day is something that is in tune with your approach (some moves are too small for medium-term traders and some might appear too big for day-traders).
Plus, you might want to read why our stop-loss orders are usually relatively far from the current price.
Please note that a full position doesn’t mean using all of the capital for a given trade. You will find details on our thoughts on gold portfolio structuring in the Key Insights section on our website.
As a reminder – “initial target price” means exactly that – an “initial” one, it’s not a price level at which we suggest closing positions. If this becomes the case (like it did in the previous trade) we will refer to these levels as levels of exit orders (exactly as we’ve done previously). Stop-loss levels, however, are naturally not “initial”, but something that, in our opinion, might be entered as an order.
Since it is impossible to synchronize target prices and stop-loss levels for all the ETFs and ETNs with the main markets that we provide these levels for (gold, silver and mining stocks – the GDX ETF), the stop-loss levels and target prices for other ETNs and ETF (among other: UGLD, DGLD, USLV, DSLV, NUGT, DUST, JNUG, JDST) are provided as supplementary, and not as “final”. This means that if a stop-loss or a target level is reached for any of the “additional instruments” (DGLD for instance), but not for the “main instrument” (gold in this case), we will view positions in both gold and DGLD as still open and the stop-loss for DGLD would have to be moved lower. On the other hand, if gold moves to a stop-loss level but DGLD doesn’t, then we will view both positions (in gold and DGLD) as closed. In other words, since it’s not possible to be 100% certain that each related instrument moves to a given level when the underlying instrument does, we can’t provide levels that would be binding. The levels that we do provide are our best estimate of the levels that will correspond to the levels in the underlying assets, but it will be the underlying assets that one will need to focus on regarding the signs pointing to closing a given position or keeping it open. We might adjust the levels in the “additional instruments” without adjusting the levels in the “main instruments”, which will simply mean that we have improved our estimation of these levels, not that we changed our outlook on the markets. We are already working on a tool that would update these levels on a daily basis for the most popular ETFs, ETNs and individual mining stocks.
Our preferred ways to invest in and to trade gold along with the reasoning can be found in the how to buy gold section. Additionally, our preferred ETFs and ETNs can be found in our Gold & Silver ETF Ranking.
As a reminder, Gold & Silver Trading Alerts are posted before or on each trading day (we usually post them before the opening bell, but we don't promise doing that each day). If there's anything urgent, we will send you an additional small alert before posting the main one.
=====
Hand-picked precious-metals-related links:
PRECIOUS-Gold hits over 18-month low as dollar flares on Turkey woes
Gold Futures Volume Doubled in Turkey During Currency Crisis
Top global investment bank unhappy with Gold Fields ‘debacle’
Paulson keeps stake in gold investments during second-quarter: filing
=====
In other news:
Stocks Decline as Caution Lingers; Lira Advances: Markets Wrap
Turkey tantrum? Investors fret over contagion from lira plunge
UK inflation rises for first time in 2018, London house prices fall
Turkey Limits Banks’ Ability to Short Lira in Latest Crisis Move
Metals Poisoned by Turkey Contagion as Copper Nears Bear Market
The FBI Says There's Going to be a Huge Bank Heist in the Coming Days
=====
Thank you.
Sincerely,
Przemyslaw Radomski, CFA
Founder, Editor-in-chief, Gold & Silver Fund Manager
Gold & Silver Trading Alerts
Forex Trading Alerts
Oil Investment Updates
Oil Trading Alerts

