

Briefly: in our opinion, full (250% of the regular size of the position) speculative short positions in gold, silver and mining stocks are justified from the risk/reward perspective at the moment of publishing this alert.
And so, it happened. Gold closed below $1,200 and silver closed below $15. What seemed to be almost impossible at the beginning of the year has become reality. But the most unbelievable part of yesterday’s decline is that while it may seem like an important bottom that ends a sizable medium-term decline, it isn’t. It’s just the first part of a huge decline and multiple signals have been pointing to this outcome. But, it’s only now – after the breakdowns below important price levels – becoming apparent to gold perma-bulls that something is not right. Actually, it is very right, as all markets move from being overbought to oversold and gold hasn’t reached the latter stage yet even though it looked like it was the case in late 2015. Gold is not yet very oversold from the long-term point of view (just look at the gold analyses that are out there – most of them are bullish and people should be scared and bearish at the bottom), but it’s getting there. And the odds are that before the bottom is in, the profits on our short positions will become quite extreme.
Let’s see what happened yesterday and what’s likely to happen next, starting with the USD Index chart (charts courtesy of http://stockcharts.com).
USDX Breakout
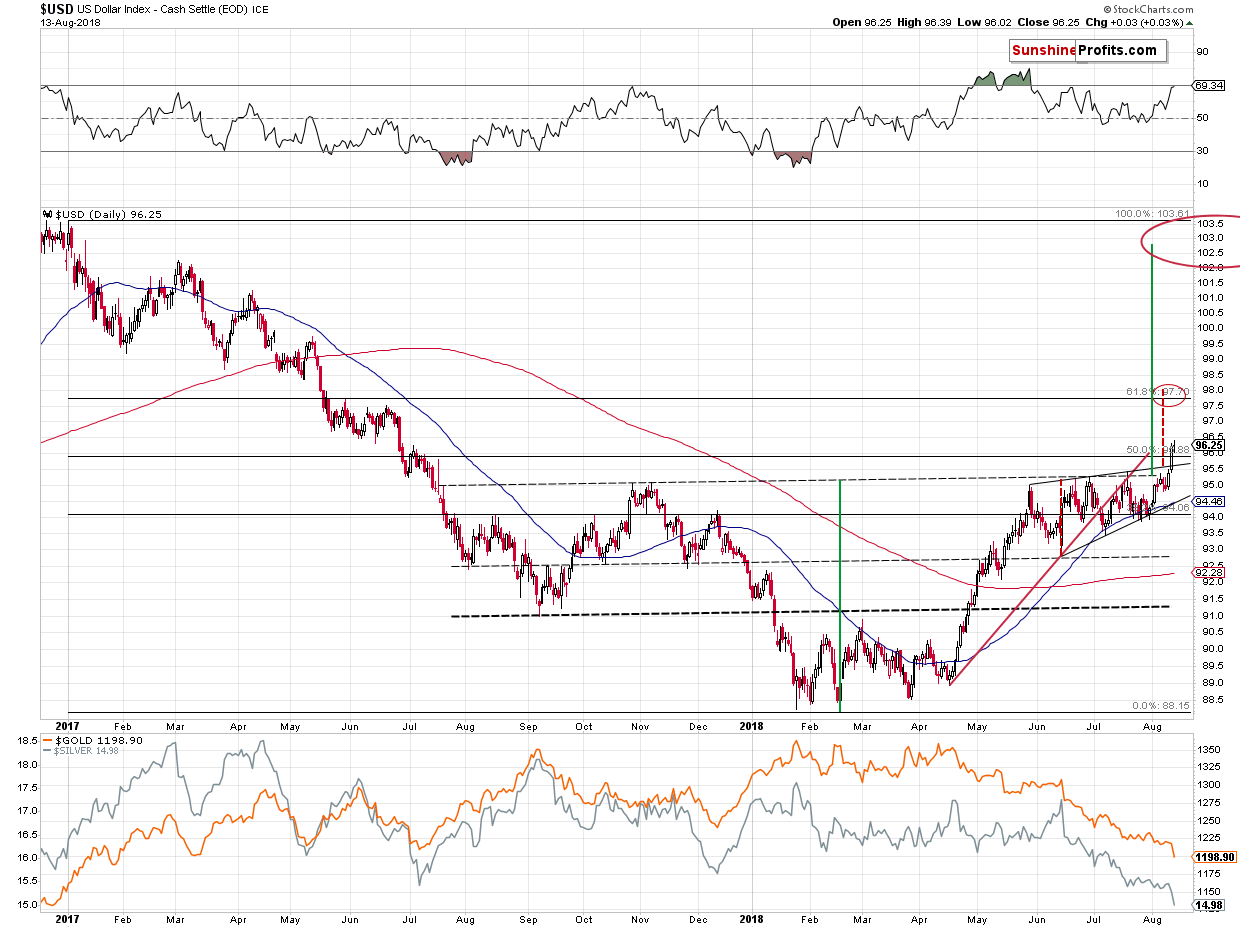
Nothing really happened yesterday and that was a very important nothing. This “nothing” means that there was no invalidation of the previous breakout and it’s becoming very likely that the breakout will be confirmed by yet another close today. This will confirm a breakout above both the rising wedge pattern and the big, medium-term, reverse head-and-shoulders pattern. The former suggests a move to about 98, and the latter suggest a move to about 103.
Both are very bullish for the USDX and bearish for the precious metals market. We might have a situation in which the USDX rallies to 98 first, then corrects and then moves up higher – to 103 or so. This could result in mirror moves in the precious metals market.
But how low might metals and miners decline in the near term?
Before moving to individual gold, silver, and mining stock charts, please take a look at the bottom part of the above chart. It features gold and silver in terms of daily closing prices. As you can see, silver broke below all previous lows and gold broke below all lows except for the late-2016 and late-January 2017 ones. The late-January 2017 low is not particularly important, so the next strong support is provided by the December 2016 low.
Gold’s Near-Term Outlook
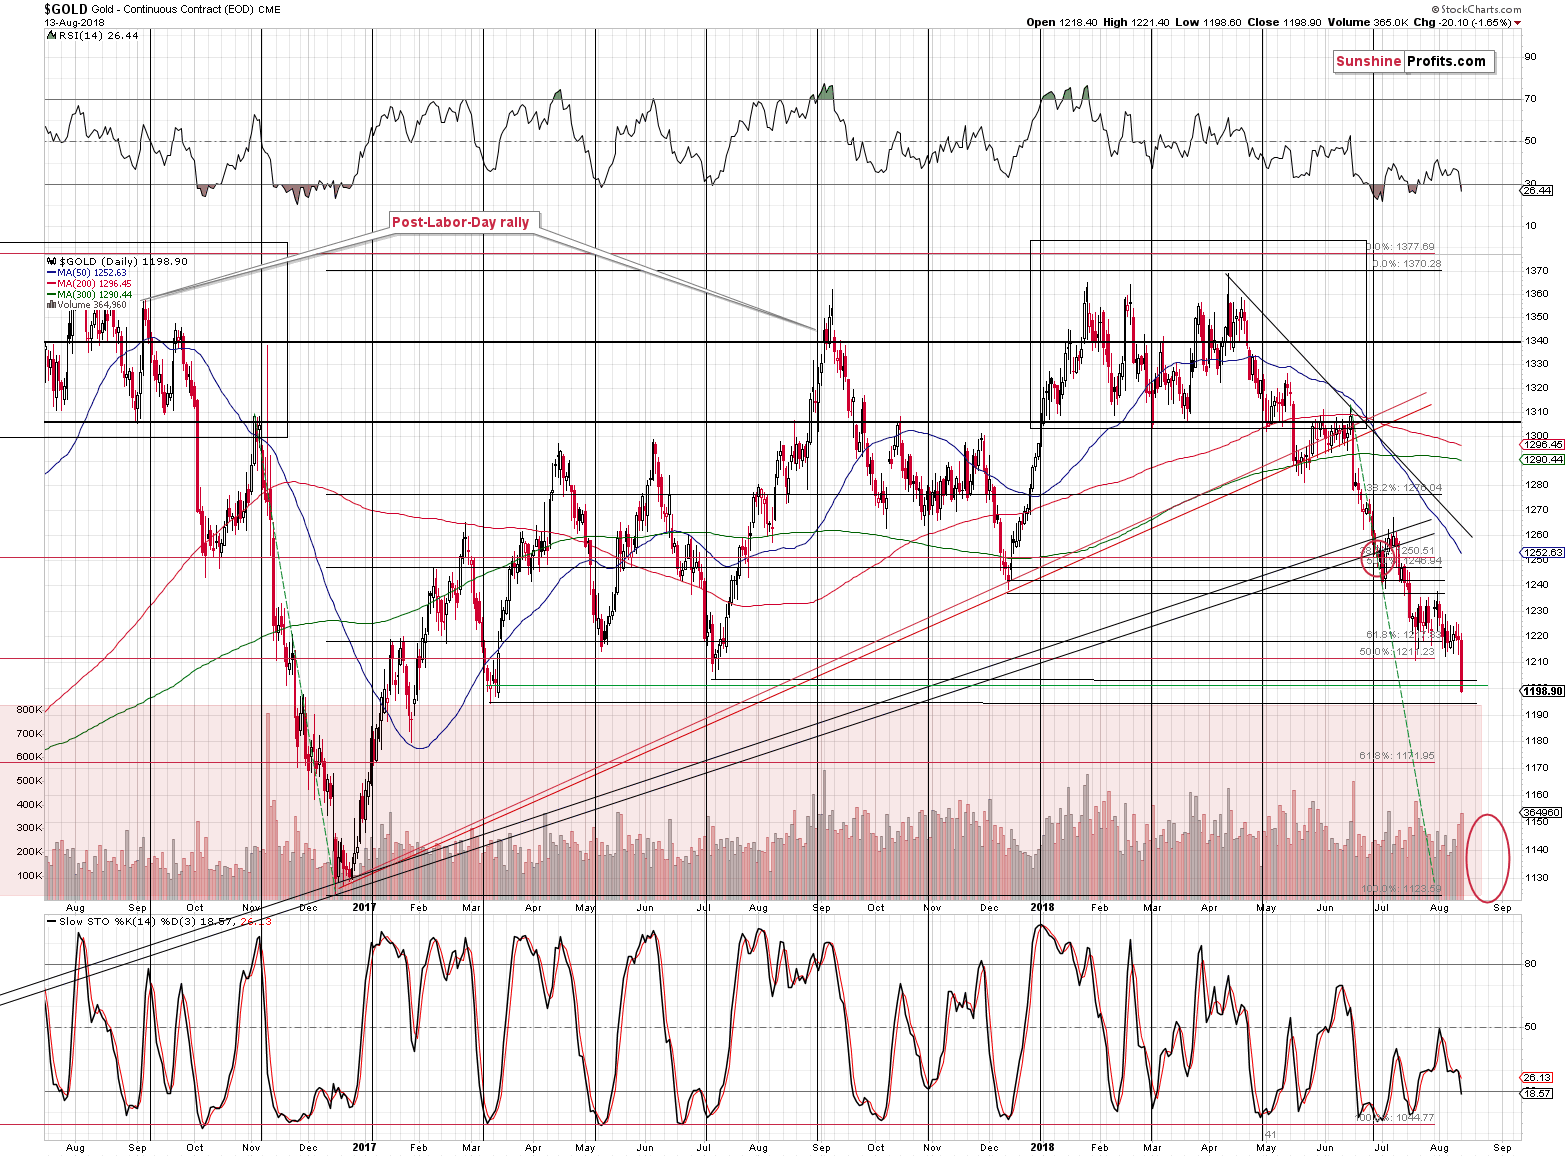
You can see the same thing on the above chart, but at first sight it’s not clear whether gold broke below the March 2017 low. In intraday terms it didn’t, but in the case of the daily closing prices it did, and the green horizontal line represents that.
The volume on which gold declined was relatively big, which emphasizes the importance of yesterday’s move.
The RSI is below 30 and it would be a bullish factor if we didn’t expect this decline to be a big, medium-term one – and we do. So, it’s not a major factor, just as it wasn’t one in late 2016.
The next strong support is at the December 2016 low and that’s where our next short-term target is.
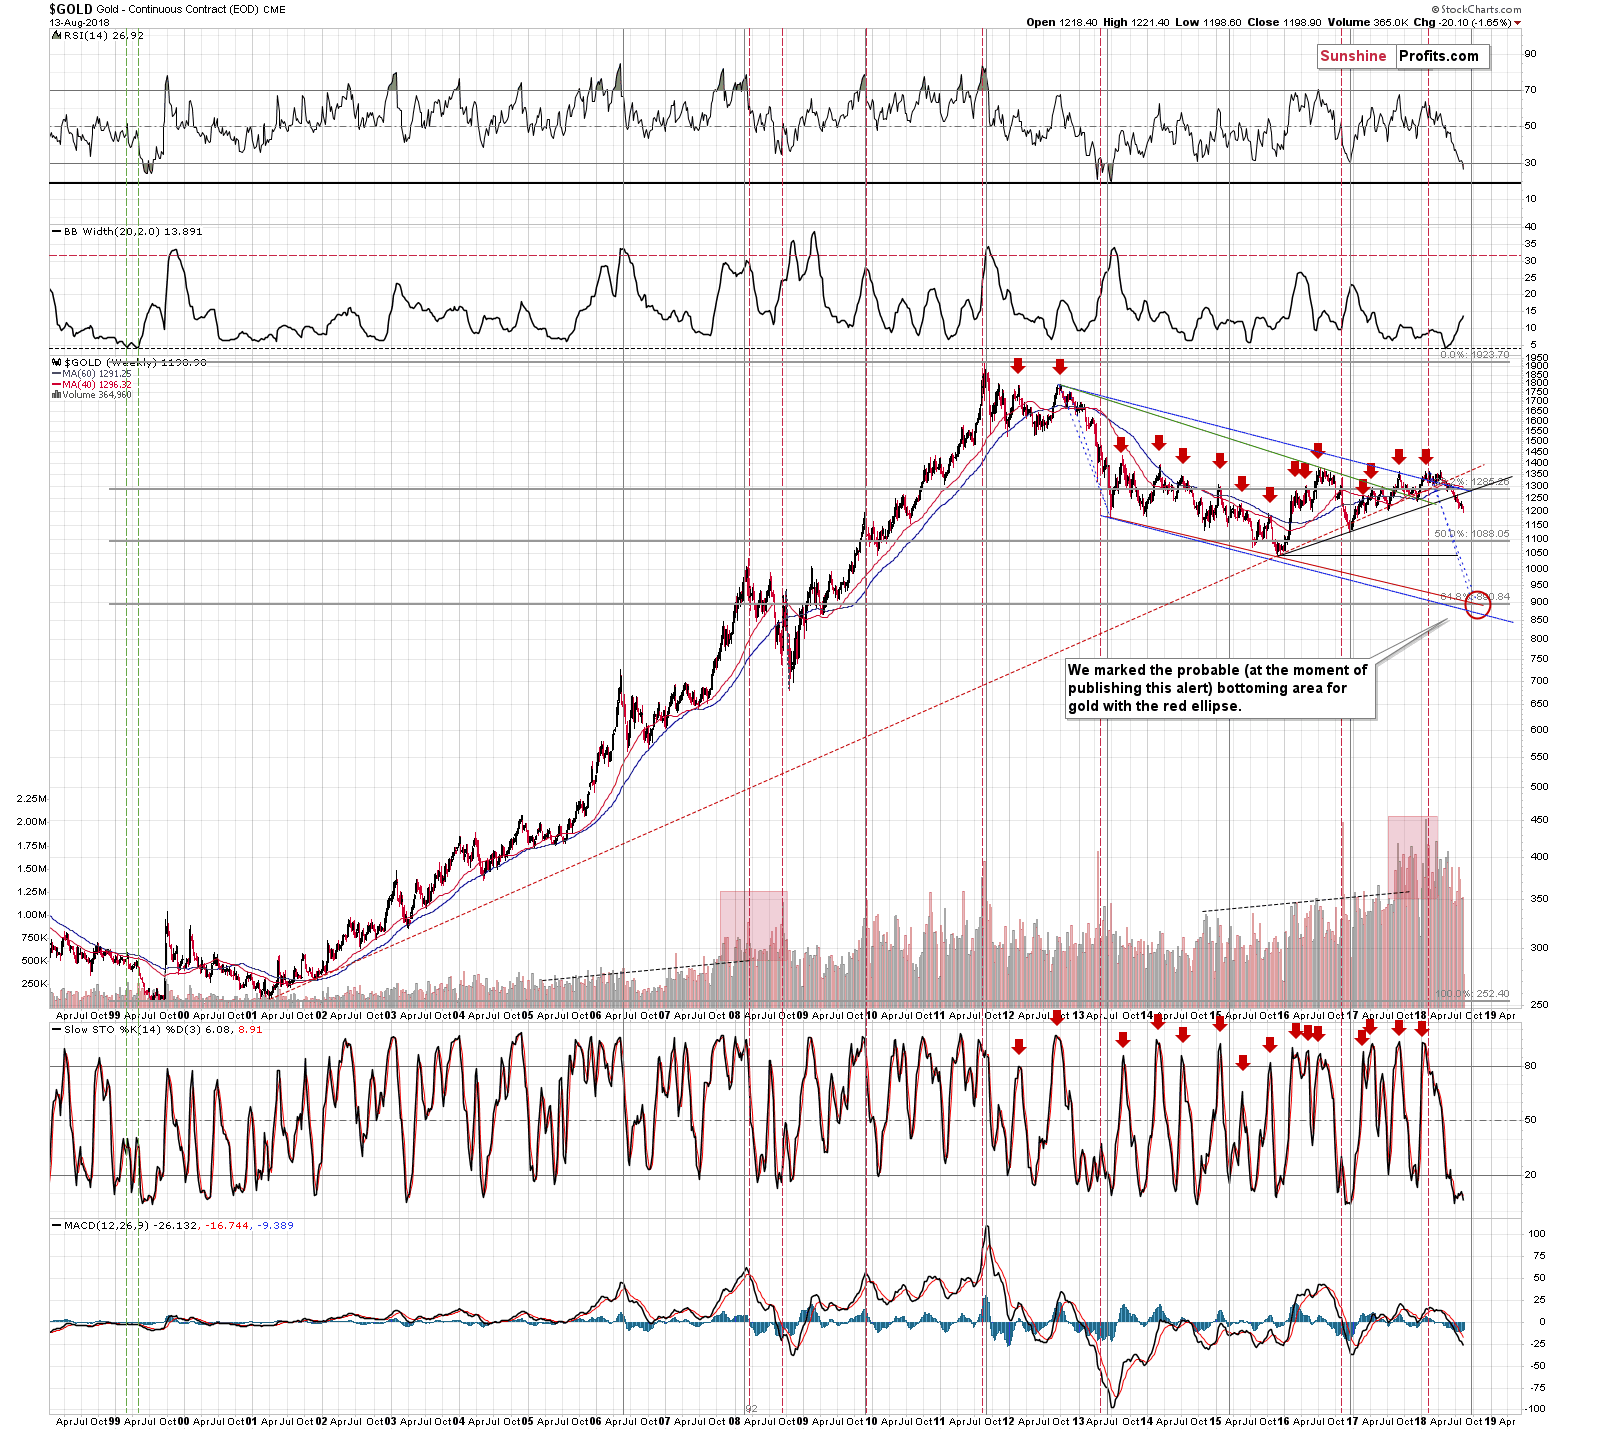
From the long-term point of view, it’s even clearer that the only nearby support level is provided by the December 2016 low. The higher local bottoms are not even visible from this perspective. The next key support is at the December 2015 low, but gold will need to get below the former support first. Naturally, it is possible for gold to slide through it without looking back and we are prepared for this scenario by having exit price orders below the December 2016 lows (closer to the December 2015 low in gold), but it’s more likely that we’ll see some kind of local bottom with gold at $1,120 - $1,130 or so.
Silver’s Near-term Outlook
In yesterday’s Alert, we commented on silver’s performance in the following way:
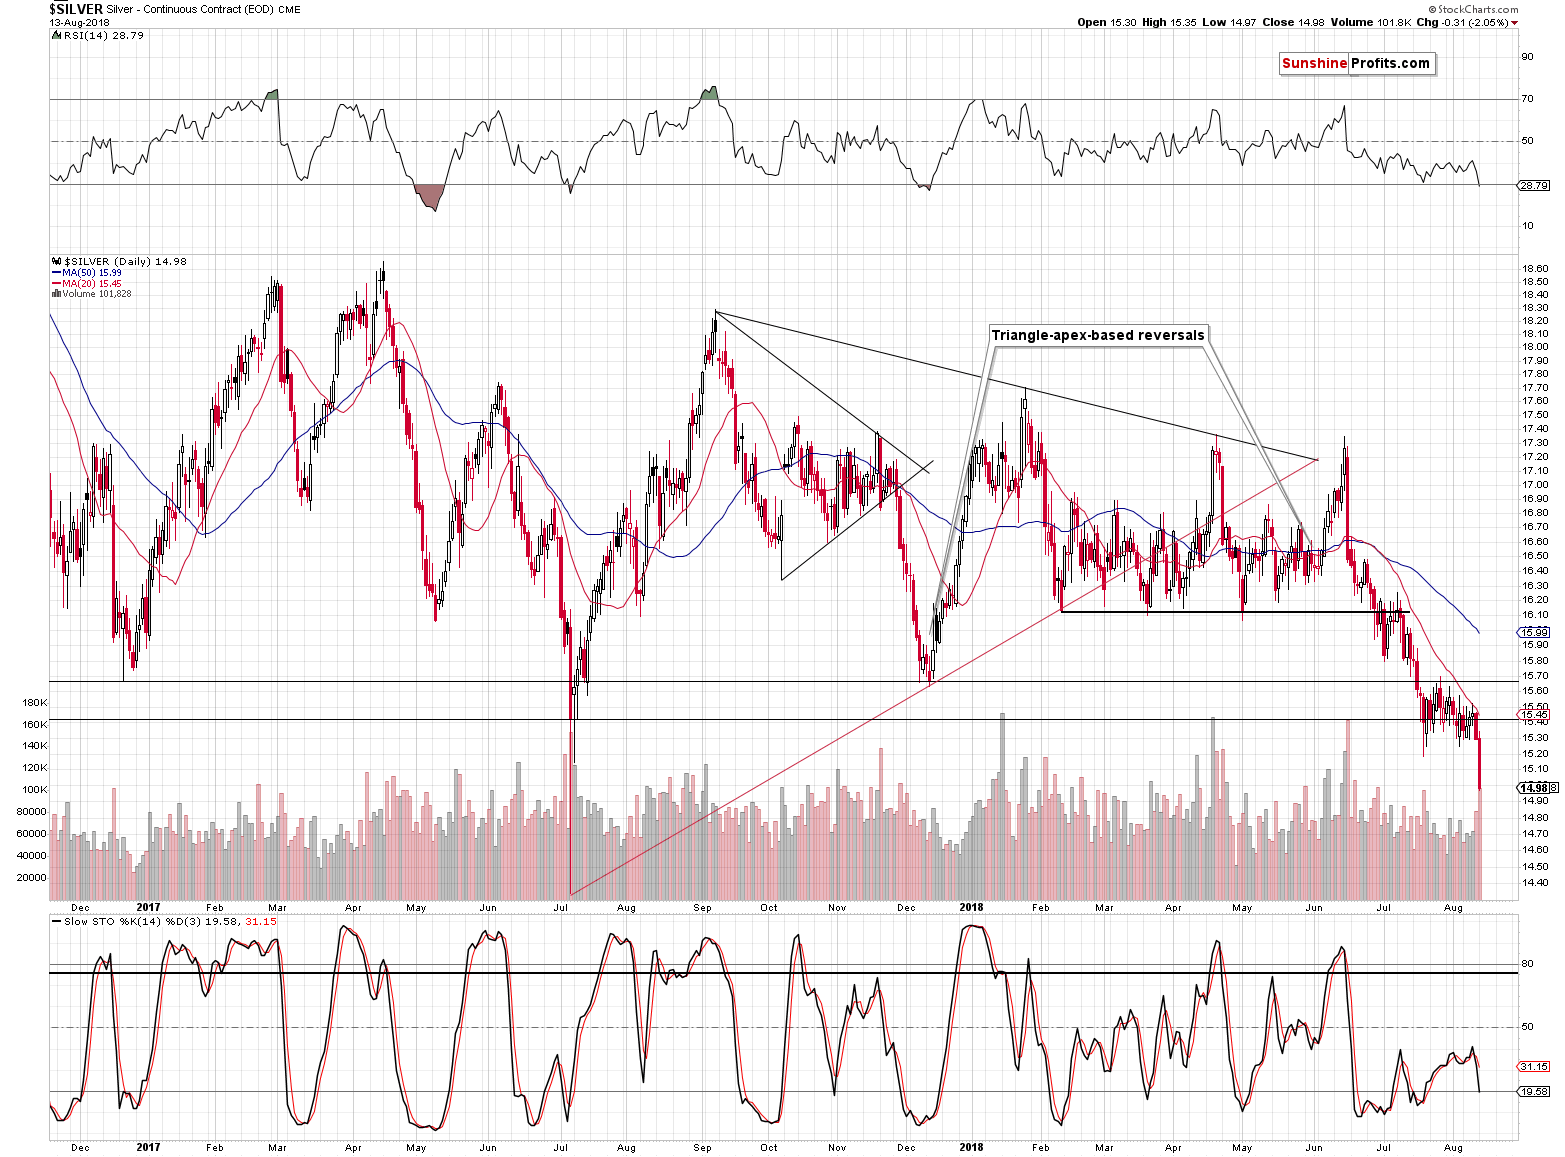
The same goes for silver’s crystal-clear breakdown in terms of weekly closing prices and another breakdown in daily prices. The volume on which silver declined was big on a relative basis and the white metal continues to move lower in today’s pre-market trading, which means that the breakdown is very likely to be confirmed. The implications are already bearish.
The breakdown was definitely confirmed as silver closed about 50 cents below the lowest daily close of 2017. The outlook is clearly bearish, but the near-term target price isn’t. At least not based on the above chart.
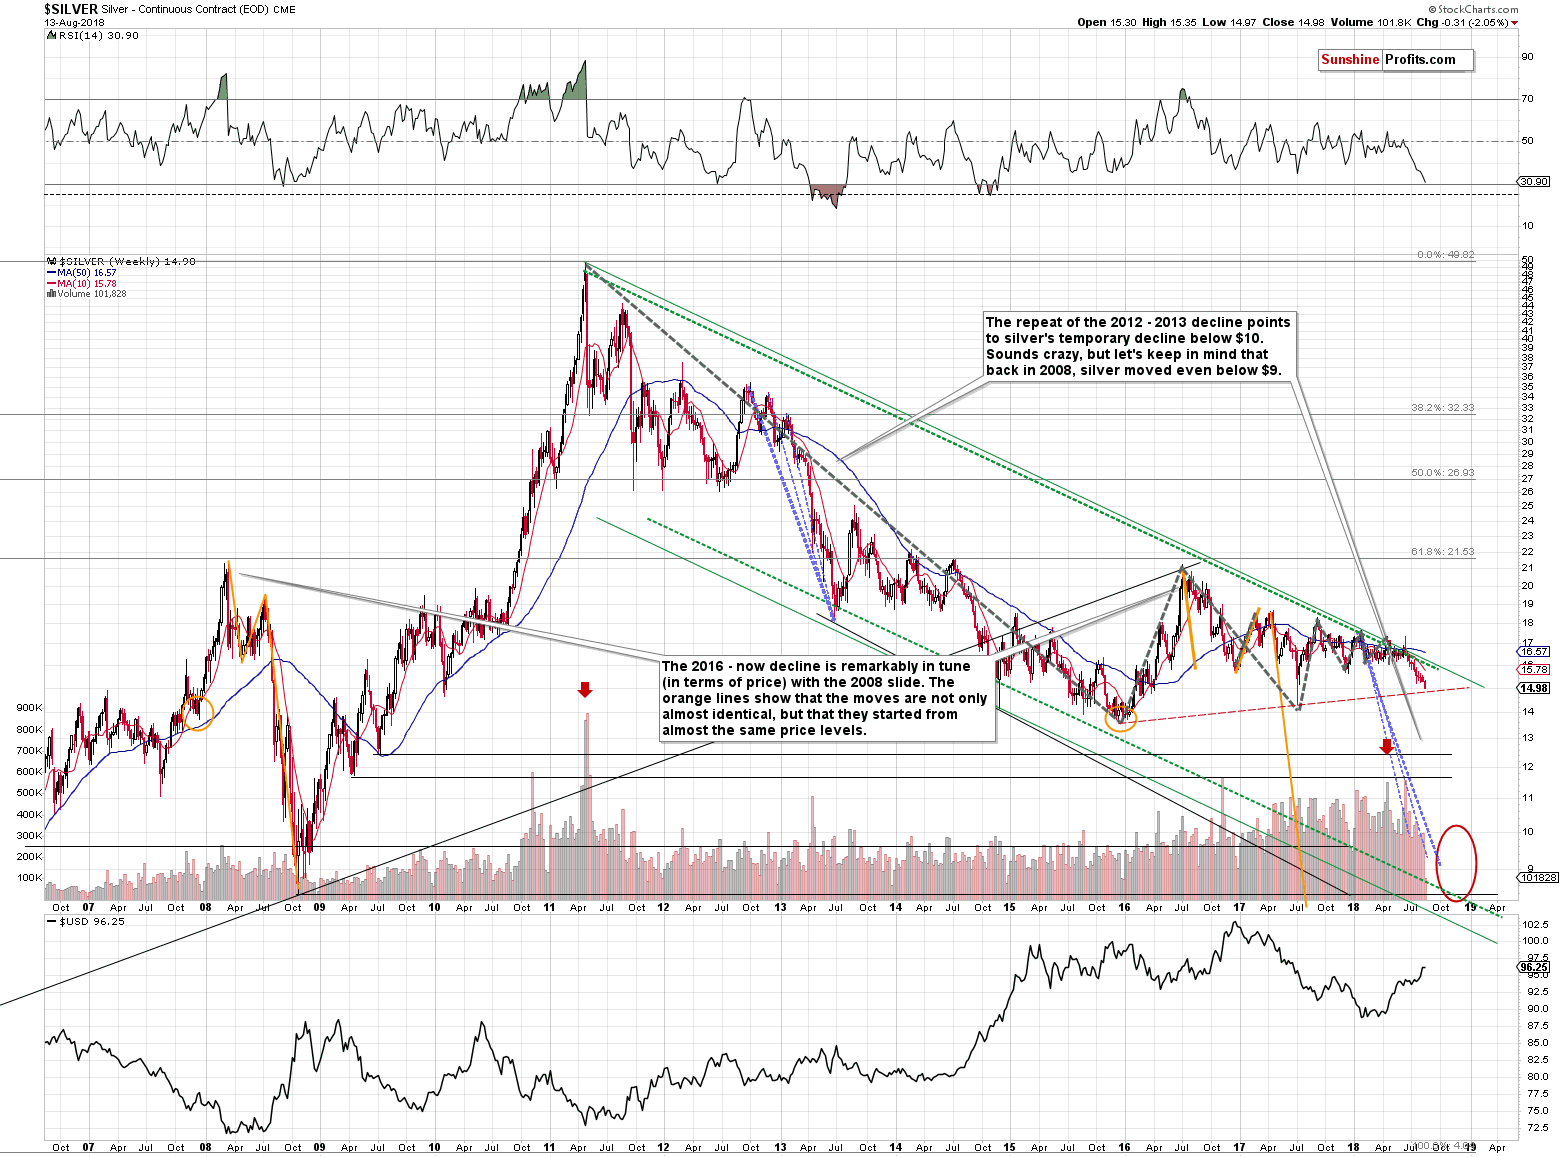
The rising, dashed, red line is too close to provide any reasonable support (assuming gold is going to move to $1,130 or so). The intraday 2017 bottom seems important, but the intraday / overnight extremes are often not as important as the daily closes. The next support is provided by the December 2015 lows.
But, can silver really move that low shortly?
One of the ways to determine a near-term target in a market that’s connected to a market for which we already have a target, is to check the relative dynamics. That’s a fancy name for checking how a given market multiplied the other market’s moves during the most recent price swing. It’s important to use the “most recent” move because the dynamics change over time.
We’ll use the downswing that started in July and ended yesterday. We’ll use this particular move because that’s the most short-term move that seems similar in terms of strength of reaction in gold, silver and gold stocks (we’ll use the same technique to the latter in the next section).
Gold’s highest closing price of July was $1,259.60 and it closed at $1,198.90 yesterday.
Silver’s highest closing price of July was $16.14 and it closed at $14.98 yesterday.
Gold declined by 4.82%, while silver declined by 7.19%. This means that silver magnified gold’s decline by 1.49. In other words, silver declined approximately 50% more than gold.
If this remains in place and we expect gold to decline from $1,198.90 to $1,125 (by 6.16%), we can expect silver to decline by 50% more. This means a decline of 1.49 * 6.16% = 9.18%. Since silver closed at $14.98, this means a move to $13.60.
Silver’s 2015 low was $13.62, so the above is a clear indication that silver will indeed be likely to decline to its 2015 lows if gold moves to its late 2016 lows.
Naturally, silver may form a temporary bottom higher – perhaps at $13.85 or so, but it does look like we’re about to see another $1+ slide in the price of the white metal.
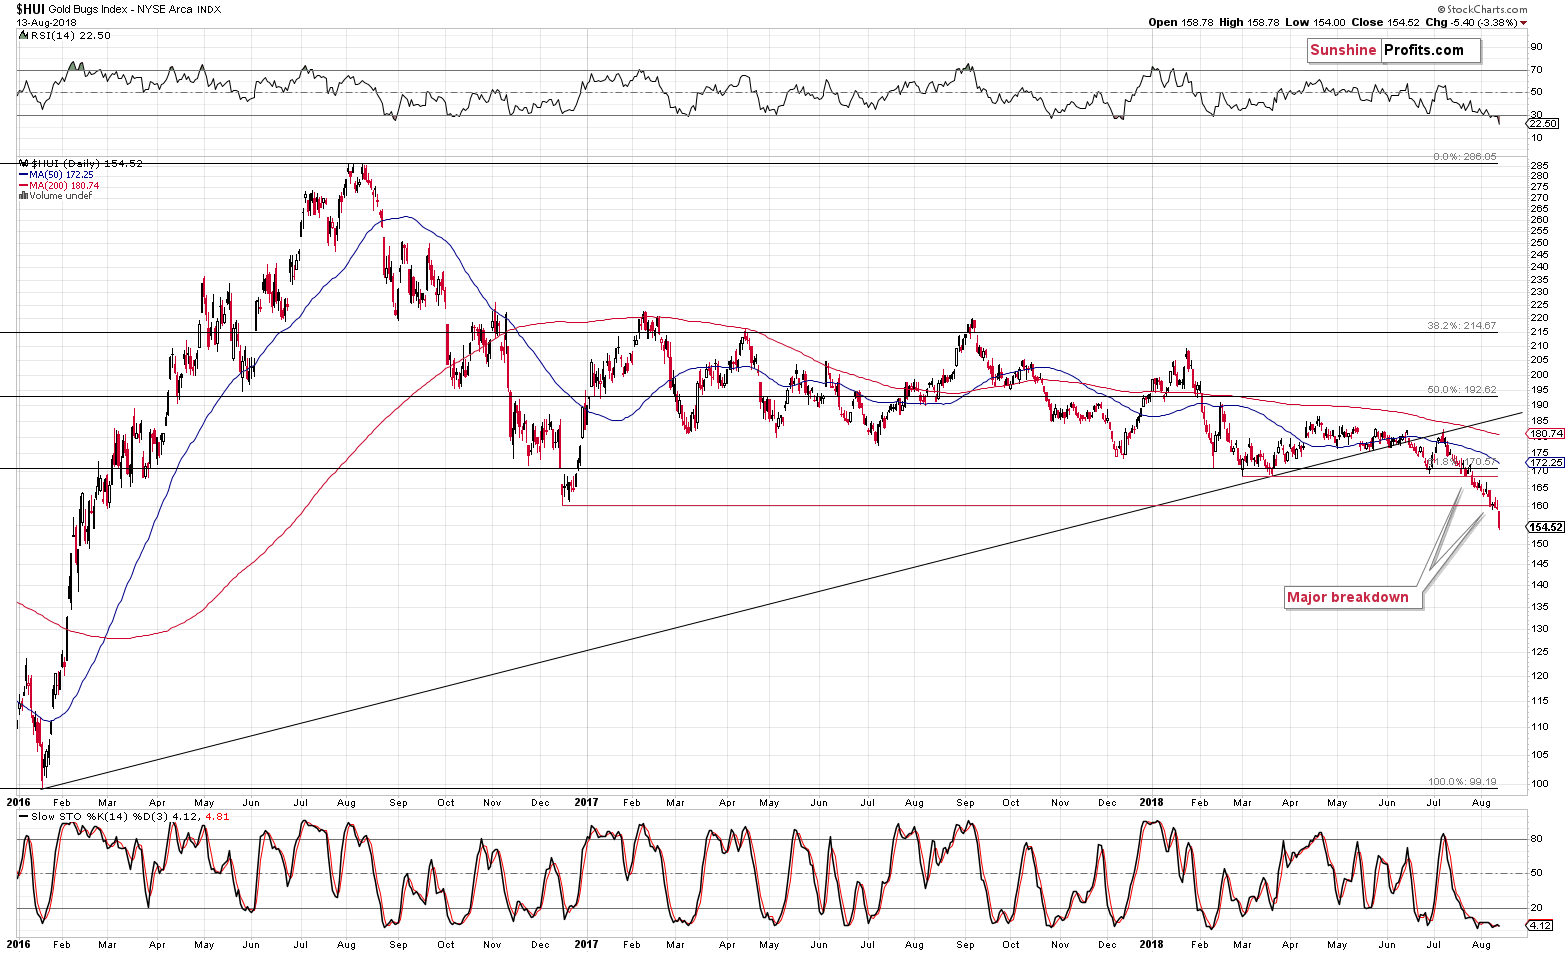
Mining Stocks Near-term Outlook
We have the same problem with mining stocks. On a side note, you know things are going well when you’re not sure how enormous your profits are going to be and you’re calling that a problem.
The HUI Index is after a major breakdown and there is no serious support in sight except for the 2016 low.
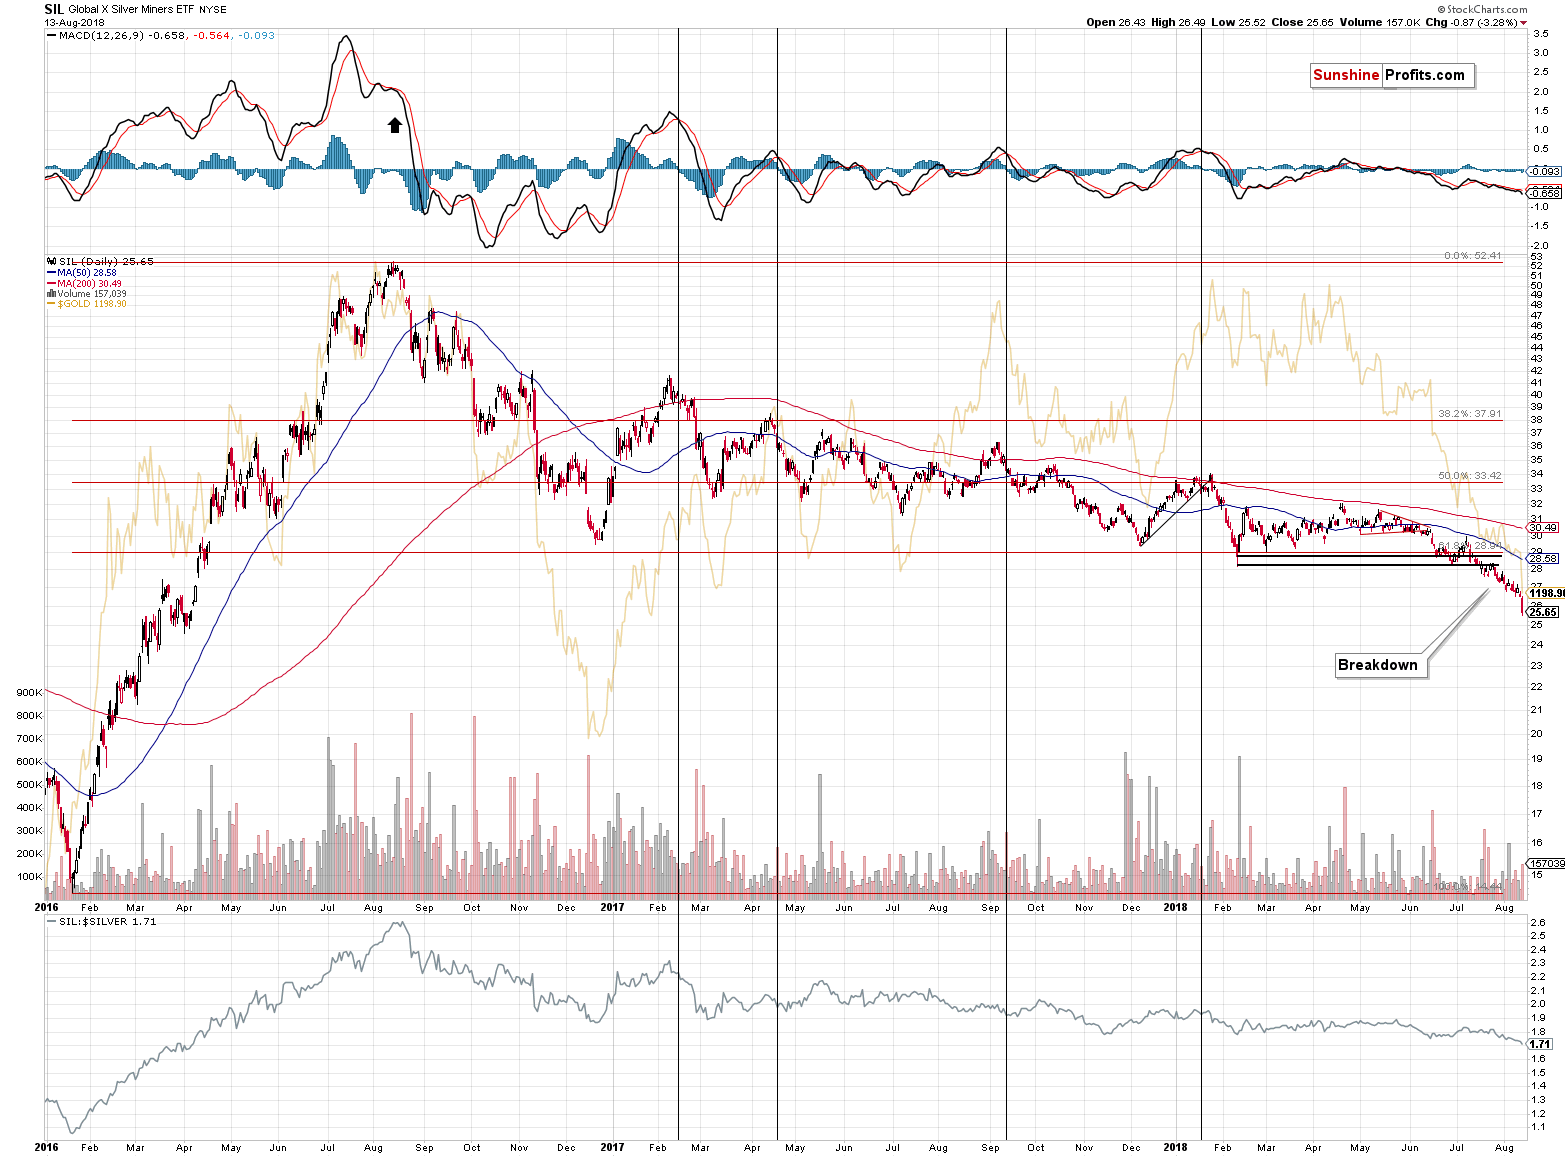
It’s the same with silver stocks. They are already well below their nearby key support levels. The only support that’s left is the 2016 bottom.
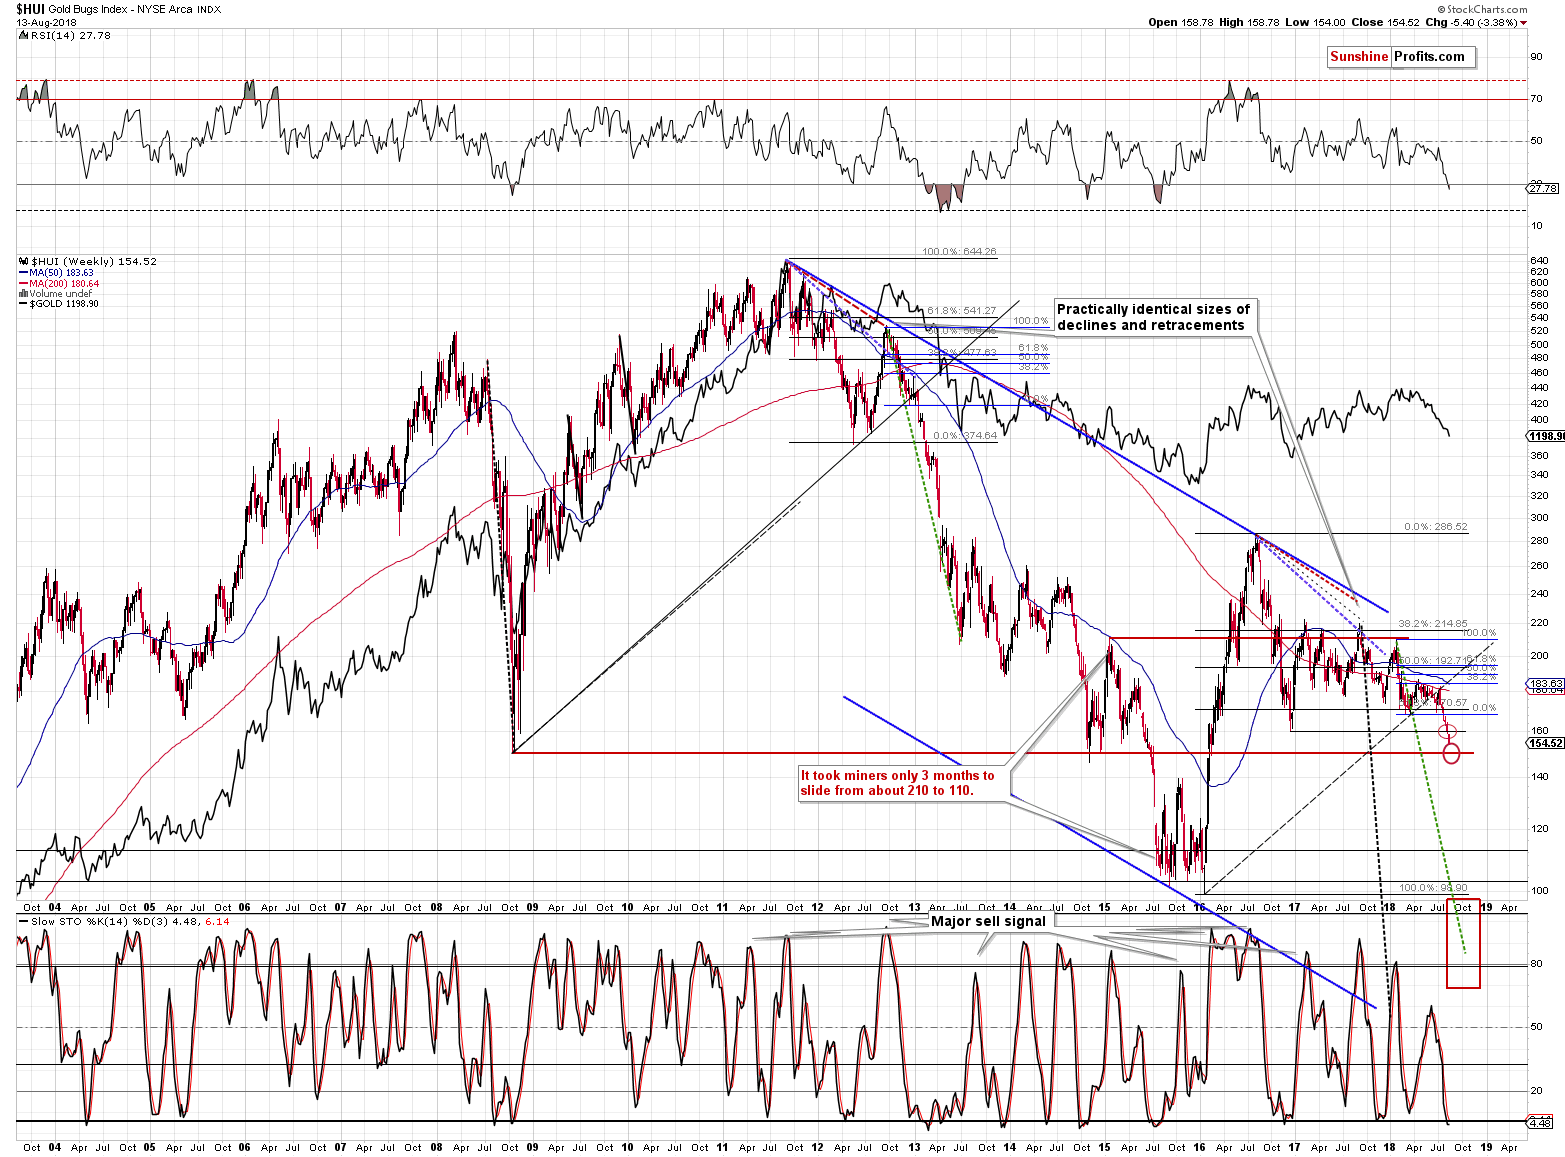
From the long-term point of view, we additionally have the 2008 bottom at 150, but it’s too close to be analogous to gold at $1,120 -$1,130 and we have the late 2015 top at about 140. There were also several local tops at about 120.
Let’s see what the relative dynamics tell us.
Gold’s highest closing price of July was $1,259.60, and it closed at $1,198.90 yesterday.
The HUI’s highest closing price of July was $179.70, and it closed at 154.52 yesterday.
Gold declined by 4.82%, while the HUI declined by 14.01%. This means that gold stocks magnified gold’s decline by 2.91. In other words, the HUI Index declined approximately 200% more than gold.
If this remains in place and we expect gold to decline from $1,198.90 to $1,125 (by 6.16%), we can expect HUI to decline by 200% more. This means a decline of 2.91 * 6.16% = 17.93%. Since HUI closed at 154.52, this means a move to 126.81.
This level doesn’t directly correspond to any other significant extreme, but it shows us more or less what to expect.
Based on our research (we will release a big research report on this in the following weeks), mining stocks tend to be the first to move in both directions, up or down, while silver tends to catch up in the final part of the move. This is more visible in the case of rallies, but this might also be useful during the current decline.
This is the early part of the decline, which suggests that mining stocks may get ahead of themselves and perhaps decline more than the relative dynamics suggest. This means that the next target would be between 100 and 120. That’s a rather wide target area but based on the details that we have right now we simply don’t have greater clarity.
As far as the GDX is concerned, this means a target between $13 and $15.
But, the most important signal will come from the gold market. If it moves below $1,150, we’ll check what nearby support levels we have for silver and mining stocks and these will become our target prices.
Final Price Targets
As you may recall, our final target for gold is at about $890 and the price target for silver is below $10, perhaps at $8.90 as that’s what the gold silver ratio at 100 would imply.
We haven’t recently discussed the price targets for the miners and the reason is the lack of clarity concerning them. We expect the miners to move below their 2015 and 2016 lows, but the extent of the breakdown is unclear.
The 80 level in the HUI Index is definitely possible and 60 is extremely oversold, but still possible. This means that GDX could decline to $10 or even $7. GDX has been holding up better than the HUI, so it might be the case that the actual bottom is formed at $12 - $10, instead of $10 - $7. The analogous price range for the GDXJ is $17 - $14.
Summary
Summing up, there are multiple very meaningful reasons due to which the precious metals sector is likely to move lower in the following weeks and months and yesterday’s declines show that the slide has already begun. In other words, it seems that our sizable profits on the short positions are going to become even bigger shortly. We may have a local bottom later this month, though, and we’ll keep you informed regarding the possibility of seeing a bigger turnaround.
As always, we’ll keep you – our subscribers – informed.
To summarize:
Trading capital (supplementary part of the portfolio; our opinion): Full short positions (250% of the full position) in gold, silver and mining stocks are justified from the risk/reward perspective with the following stop-loss orders and exit profit-take price levels:
- Gold: profit-take exit price: $1,062; stop-loss: $1,272; initial target price for the DGLD ETN: $82.96; stop-loss for the DGLD ETN $46.38
- Silver: profit-take exit price: $12.72; stop-loss: $16.46; initial target price for the DSLV ETN: $46.97; stop-loss for the DSLV ETN $24.07
- Mining stocks (price levels for the GDX ETF): profit-take exit price: $13.12; stop-loss: $23.64; initial target price for the DUST ETF: $80.97; stop-loss for the DUST ETF $20.87
In case one wants to bet on junior mining stocks’ prices (we do not suggest doing so – we think senior mining stocks are more predictable in the case of short-term trades – if one wants to do it anyway, we provide the details), here are the stop-loss details and initial target prices:
- GDXJ ETF: profit-take exit price: $17.52; stop-loss: $34.82
- JDST ETF: initial target price: $154.97 stop-loss: $42.78
Long-term capital (core part of the portfolio; our opinion): No positions (in other words: cash)
Insurance capital (core part of the portfolio; our opinion): Full position
Important Details for New Subscribers
Whether you already subscribed or not, we encourage you to find out how to make the most of our alerts and read our replies to the most common alert-and-gold-trading-related-questions.
Please note that the in the trading section we describe the situation for the day that the alert is posted. In other words, it we are writing about a speculative position, it means that it is up-to-date on the day it was posted. We are also featuring the initial target prices, so that you can decide whether keeping a position on a given day is something that is in tune with your approach (some moves are too small for medium-term traders and some might appear too big for day-traders).
Plus, you might want to read why our stop-loss orders are usually relatively far from the current price.
Please note that a full position doesn’t mean using all of the capital for a given trade. You will find details on our thoughts on gold portfolio structuring in the Key Insights section on our website.
As a reminder – “initial target price” means exactly that – an “initial” one, it’s not a price level at which we suggest closing positions. If this becomes the case (like it did in the previous trade) we will refer to these levels as levels of exit orders (exactly as we’ve done previously). Stop-loss levels, however, are naturally not “initial”, but something that, in our opinion, might be entered as an order.
Since it is impossible to synchronize target prices and stop-loss levels for all the ETFs and ETNs with the main markets that we provide these levels for (gold, silver and mining stocks – the GDX ETF), the stop-loss levels and target prices for other ETNs and ETF (among other: UGLD, DGLD, USLV, DSLV, NUGT, DUST, JNUG, JDST) are provided as supplementary, and not as “final”. This means that if a stop-loss or a target level is reached for any of the “additional instruments” (DGLD for instance), but not for the “main instrument” (gold in this case), we will view positions in both gold and DGLD as still open and the stop-loss for DGLD would have to be moved lower. On the other hand, if gold moves to a stop-loss level but DGLD doesn’t, then we will view both positions (in gold and DGLD) as closed. In other words, since it’s not possible to be 100% certain that each related instrument moves to a given level when the underlying instrument does, we can’t provide levels that would be binding. The levels that we do provide are our best estimate of the levels that will correspond to the levels in the underlying assets, but it will be the underlying assets that one will need to focus on regarding the signs pointing to closing a given position or keeping it open. We might adjust the levels in the “additional instruments” without adjusting the levels in the “main instruments”, which will simply mean that we have improved our estimation of these levels, not that we changed our outlook on the markets. We are already working on a tool that would update these levels on a daily basis for the most popular ETFs, ETNs and individual mining stocks.
Our preferred ways to invest in and to trade gold along with the reasoning can be found in the how to buy gold section. Additionally, our preferred ETFs and ETNs can be found in our Gold & Silver ETF Ranking.
As a reminder, Gold & Silver Trading Alerts are posted before or on each trading day (we usually post them before the opening bell, but we don't promise doing that each day). If there's anything urgent, we will send you an additional small alert before posting the main one.
=====
Latest Free Trading Alerts:
Annual core CPI jumped 2.4 percent, the fastest pace since September 2008. Is it the peak – or just the beginning of inflation? And what does it mean for the gold market?
=====
Hand-picked precious-metals-related links:
PRECIOUS-Gold rises as dollar edges lower
Ray Dalio’s Bridgewater Keeps Faith in Gold Despite Its Slide
European Gold bar and coin demand plunges during Q2: WGC
India's July gold imports surge as jewellers replenish inventory
Gold Abandoned By World’s Top Mutual Fund; Frank Holmes Says Rebound Still Possible
7IM drops gold and adopts general commodities strategy
Barrick shares bounce on final permits for giant Alaska gold mine
Gold Fields to Restructure Giant Loss-Making South Africa Mine
=====
In other news:
Futures rise as Turkish lira rebounds, tech stocks gain
Investors Haven’t Been This Bullish on U.S. Stocks Since 2015
China's economy cools further, investment growth at record low
Bitcoin Drops Below $6,000 as Almost Every Cryptocurrency Sinks
Rupee crashes to all-time low of 70.08 against US dollar
Oil edges up on Saudi output cut and Iran sanctions
=====
Thank you.
Sincerely,
Przemyslaw Radomski, CFA
Founder, Editor-in-chief, Gold & Silver Fund Manager
Gold & Silver Trading Alerts
Forex Trading Alerts
Oil Investment Updates
Oil Trading Alerts

