

Briefly: in our opinion, a full (300% of the regular position size) speculative short position in silver is justified from the risk/reward point of view at the moment of publishing this Alert.
“I got the blues, Got those inflation blues”
-- B.B. King
Today’s analysis will take a hybrid format. I’m going to tell you about the key chart (found below) for today in the video, and I’ll provide a brief description of other charts in writing.
So, here’s the key chart:
And here’s my video commentary about it:
In addition to the above, I would like to tell you that what we saw in silver or mining stocks continues to support the bearish case.
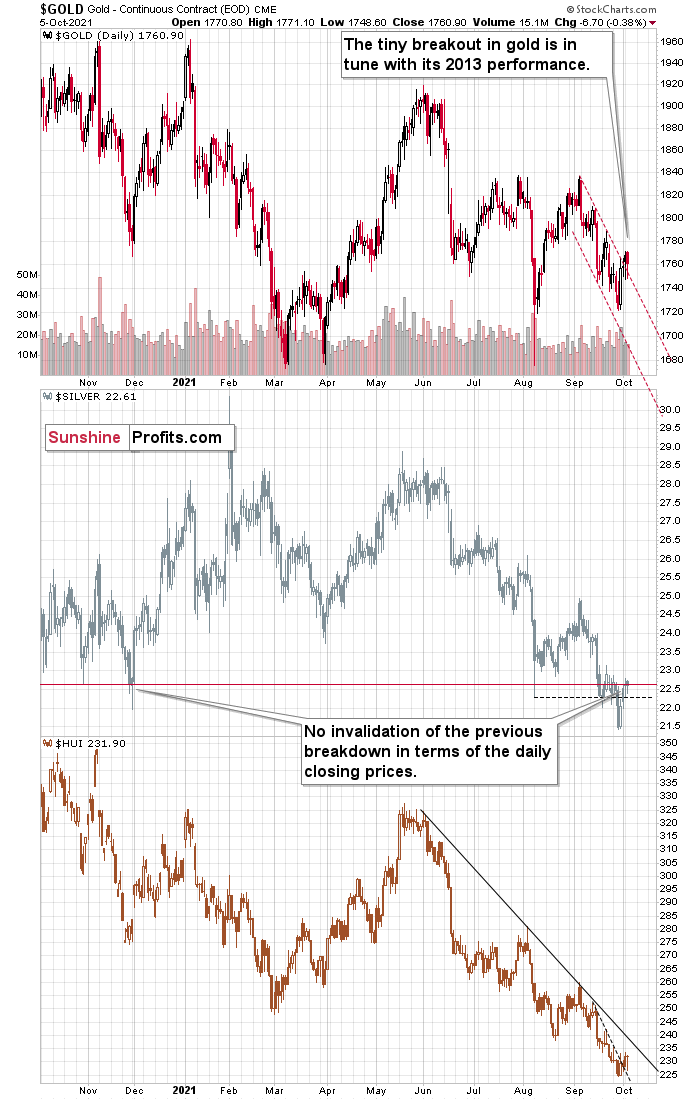
I already wrote about the similarity between now and 2013 numerous times, and also in yesterday’s analysis, so you already know that the current small breakout is also in tune with this self-similarity. It looks just like what happened in early 2013 and you will find details in my yesterday’s Gold & Silver Trading Alert.
As far as silver is concerned, please note that it’s trading practically right at its previous lows in terms of the closing prices. Silver did close yesterday’s session a few cents higher than it had closed in late November 2020, but this “invalidation” was barely visible, so I’m not taking it at its face value, especially that this “strength” in silver was not accompanied by strength in mining stocks.
True rallies begin with miners showing strength and that’s not taking place right now.
As you can see on the lower part of the above chart, the HUI Index – flagship proxy for gold stocks – is consolidating after a sizable downswing. The fact that it moved above it’s very short-term declining resistance line is of practically no significance, unless you are a day trader. Even if the HUI Index moves higher here (and it’s a big “if”), it’s unlikely to rally above the declining resistance line that already stopped it in early September. This means that the corrective upswing is either over, close to being over, or at least mostly done. Of course, there are no certainties in any market, but this seems very likely to me.

Junior miners moved slightly higher yesterday, but they remain below their August lows, so there was no invalidation of the breakdown below them.
All in all, the technical picture for the precious metals sector remains bearish, and silver seems to be poised to decline the most in the near term.
Also, I’ve been asked if the situation on the general stock market doesn’t impact junior mining stocks to the extent that it would make sense to short them instead of silver. My reply to that question is that a decline in the general stock market is likely to impact the entire precious metals sector, but primarily junior mining stocks, senior mining stocks and silver. The impact on miners and silver is both strong, but during the early part of the declines in the precious metals sector, miners would be likely to decline more (and be more affected), but in the final part of a given short-term move, silver is likely to decline the most, at least that’s what happens usually. Since these are note the early days of a short-term decline, but rather their final days, it seems to me that silver should be affected more than juniors.
Having said that, let’s take a look at the details from a more fundamental point of view.
Powell’s Got a Problem
With inflation surging and Fed Chairman Jerome Powell praying for a “transitory” miracle, the troubles confronting the Fed are accelerating, not decelerating.
To explain, I wrote on Sep. 24:
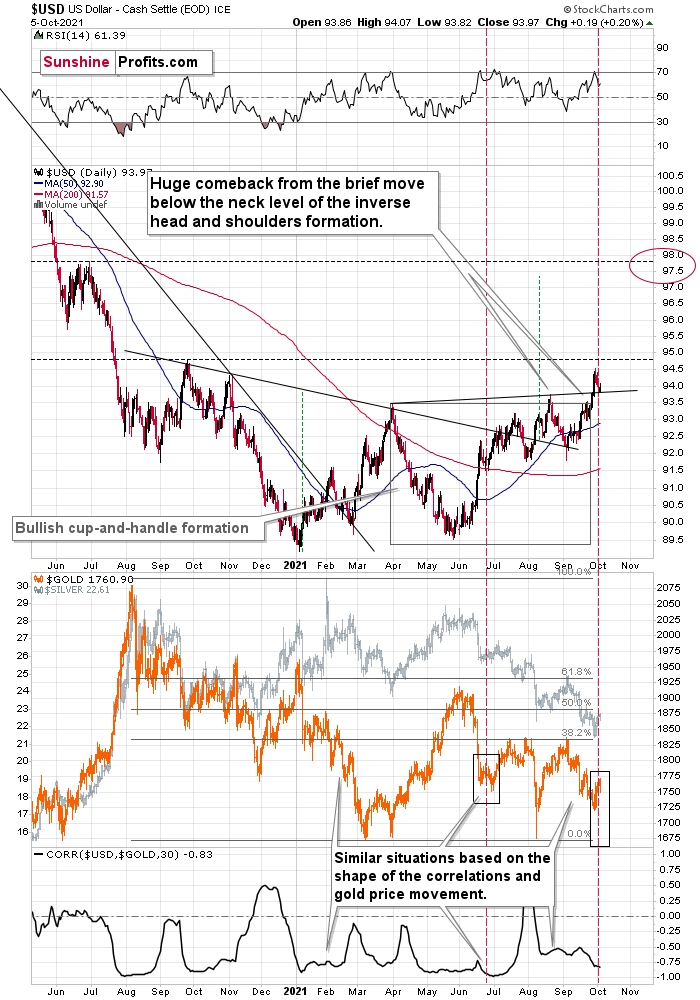
I’ve warned on several occasions that the only way for the Fed to control inflation is to increase the value of the U.S. dollar and decrease the value of commodities. However, with commodities’ fervor accelerating on Sep. 23 – a day when the USD Index declined – the price action should concern Chairman Jerome Powell. As a result, FOMC participants’ 2022 inflation forecast is likely wishful thinking and they may find that a faster liquidity drain (which is bullish for the U.S. dollar) is their only option to control the pricing pressures.
To that point, with energy prices increasingly unhinged and WTI on pace for its seventh-straight week of weekly gains, the S&P Goldman Sachs Commodity Index (S&P GSCI) has been on fire recently. For context, the S&P GSCI contains 24 commodities from all sectors: six energy products, five industrial metals, eight agricultural products, three livestock products and two precious metals. However, energy accounts for roughly 54% of the index’s movement.
Please see below:
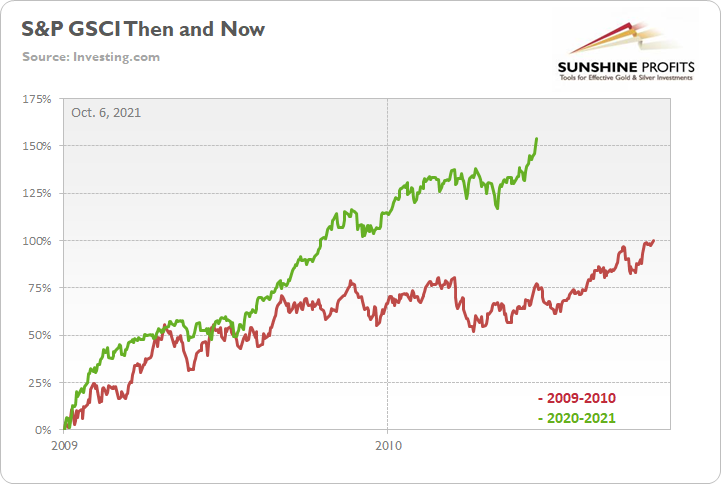
To explain, the green line above tracks the S&P GSCI’s current rally off of the bottom, while the red line above tracks the S&P GSCI’s rally off of the bottom in 2009-2010 (following the global financial crisis). If you analyze the middle of the chart, you can see that the S&P GSCI has completely run away from the 2009-2010 analogue. For context, at this point in 2009-2010, the S&P GSCI had rallied by 77% off of the bottom. However, as of the Oct. 5 close, the S&P GSCI has now rallied by 154% off of the April 2020 bottom.
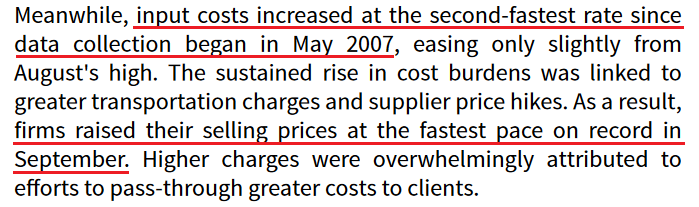
Furthermore, with higher energy and materials prices exacerbating the cost-push inflationary spiral, signs of stress remain abundant. For example, IHS Markit released its U.S. Manufacturing PMI on Oct. 1. And while the headline index declined from 61.1 in August to 60.7 in September, Chris Williamson, Chief Business Economist at IHS Markit, said that “prices charged for those goods leaving the factory gate also surged higher again in September, rising at a rate exceeding anything seen in nearly 15 years of survey history.”
Please see below:
 Source: IHS Markit
Singing a similar tune, the Institute for Supply Management (ISI) released its Services PMI on Oct. 5. For context, the U.S. service sector has suffered the brunt of the Delta variant’s wrath. And though pricing pressures aren’t as feverish as they are in the U.S. manufacturing sector, the report revealed that inflation increased at a “faster” pace and that “all 18 services industries reported an increase in prices paid during the month of September.”
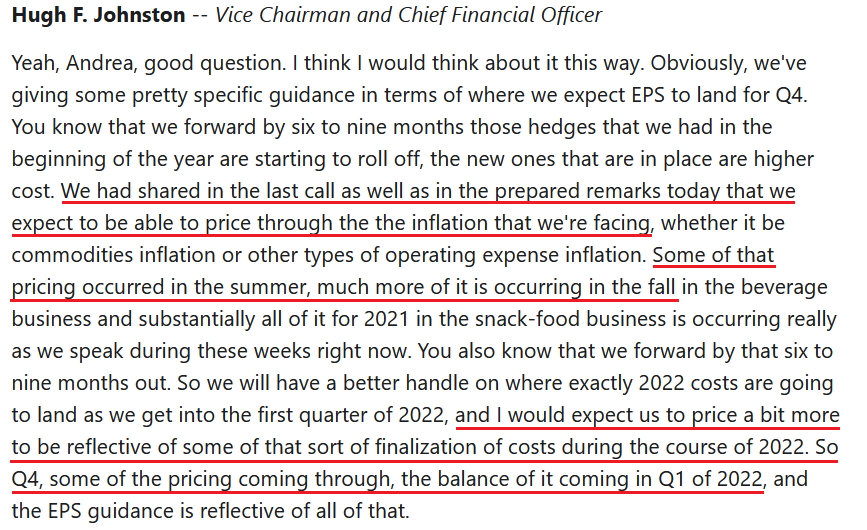
In addition, PepsiCo released its third-quarter earnings on Oct. 5. And after beating analysts’ estimates on both the top and bottom lines, the beverage giant raised its full-year guidance. However, while demand remains resilient, 11.6% year-over-year (YoY) consolidated net revenue growth coincided with a 3% decline in diluted earnings per share (EPS).
Despite that though, CEO Ramon Laguarta told analysts during the company’s Q3 earnings call that “what we're seeing across the world is much lower elasticity on the pricing that we've seen historically,” and as a result, price hikes are scheduled to commence in the coming months. For context, ‘elasticity’ attempts to quantify the change in demand that results from a change in price. And with CFO Hugh Johnston expecting charge inflation to outpace cost inflation going forward, “lower elasticity” is materially problematic for the Fed.
Please see below:
 Source: PepsiCo/The Motley Fool
If that wasn’t enough, BMO Harris Bank announced on Oct. 5 that it will increase its minimum hourly wage for all branch and call-center employees by a “20 Percent Minimum” to $18 an hour. For context, BMO Harris Bank has more than 500 branches and more than 12,000 employees in the U.S.
Please see below:
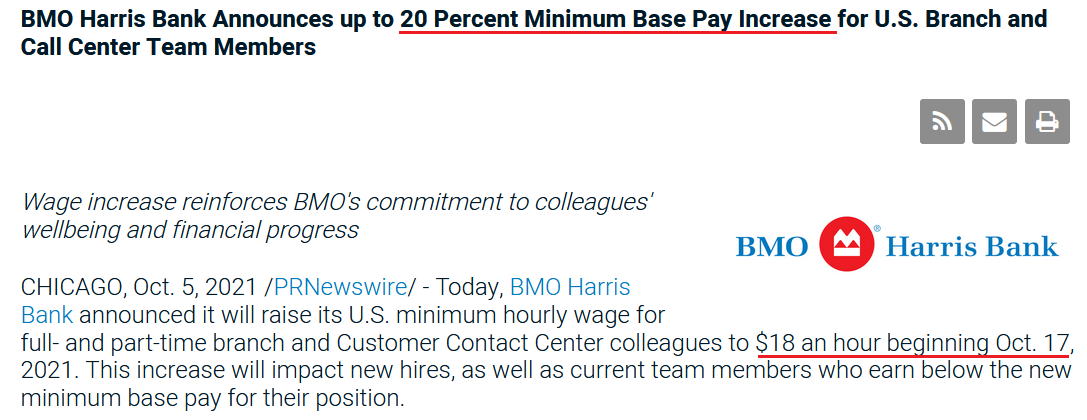 Source: BMO Harris Bank
More importantly, though, with Powell’s inflationary conundrum helping swing the double-edged sword that’s been fundamentally slashing the PMs, the USD Index rallied by 0.20% on Oct. 5 and U.S. Treasury yields strengthened across the board.
Please see below:
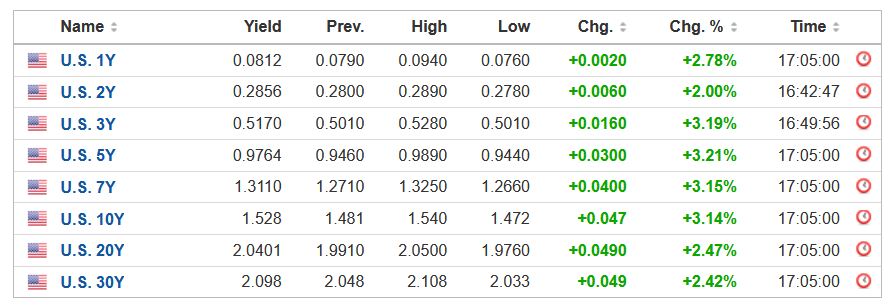 Source: Investing.com
As it relates to the dollar story, the USD Index’s fundamental strength is underwritten by the ‘dollar smile.’ To explain, when the U.S. economy is trudging along, the U.S. dollar tends to underperform. However, when the U.S. economy craters and a safe-haven bid emerges, the U.S. dollar often outperforms. Conversely (and similarly), when the U.S. economy is booming and higher interest rates materialize, the U.S. dollar also outperforms.
For context, I indicated on Sep. 22:
The USD Index and U.S. Treasury yields can move in the same direction or forge different paths. However, while a stock market crash is likely the most bearish fundamental outcome that could confront the PMs, scenario #2 is next in line. When U.S. economic strength provides a fundamental thesis for both the USD Index and U.S. Treasury yields to rise (along with real interest rates), the double-edged sword often leaves the PMs with deep lacerations.
To that point, with a mix of both playing out in the present, Sebastien Galy, senior macro strategist at Nordea, signalled clients that the dollar smile remains alive and well:
“The dollar should continue to be supported by expectations of an eventual series of Fed rate hikes and the value of the dollar as a safe haven against a potential equity correction…. The downward trend in EUR/USD is likely to return in the coming weeks and months, suggesting EUR/USD around the 1.10 handle and potentially below that before moving higher.”
As for the yield story, Lindsey Piegza, chief economist at Stifel Financial, told clients that “markets appear increasingly jittery as the realization of a higher sustained level of inflation eventually resulting in a higher level of rates appears to be finally sinking in.... Against the backdrop of elevated inflation and rapidly rising energy costs, many market participants are skeptical the FOMC will be able to maintain these low rates for another year, let alone two.”
The bottom line? With inflation running away from the Fed, suppressing commodity prices (by strengthening the U.S. dollar and/or raising interest rates) is the only way to calm the inflationary pressures. If not, surging commodity prices will likely further suppress consumer confidence, upend corporate profit margins, culminate with demand destruction and the stock market should suffer mightily (which is also bullish for the U.S. dollar). As a result, with Powell creating an even larger inflationary wildfire the longer he waits, the PMs could confront immense volatility over the medium term.
In conclusion, the PMs were mixed on Oct. 5, though trouble looms large in the months ahead. With the USD Index and U.S. Treasury yields ripe for upward re-ratings, the Fed’s “transitory” narrative hasn’t aged well. And with the PMs’ main villains doing a lot of their fundamental damage since Powell turned hawkish, more upside catalysts should emerge over the medium term. As a result, the PMs’ outlook remains profoundly bearish over the next few months.
Overview of the Upcoming Part of the Decline
- It seems to me that the corrective upswing in gold is over, and the big decline seems to be already underway. We are very likely in the final part of this short-term decline, which is why I expect silver to catch up with mining stocks and decline quite substantially.
- It seems that the first stop for gold will be close to its previous 2021 lows, slightly below $1,700. Then it will likely correct a bit, but it’s unclear if I want to exit or reverse the current short position based on that – it depends on the number and the nature of the bullish indications that we get at that time. Before the next big slide, I will likely prefer to get back to the short position in the junior mining stocks.
- After the above-mentioned correction, we’re likely to see a powerful slide, perhaps close to the 2020 low ($1,450 - $1,500).
- If we see a situation where miners slide in a meaningful and volatile way while silver doesn’t (it just declines moderately), I plan to – once again – switch from short positions in miners to short positions in silver. At this time, it’s too early to say at what price levels this could take place, and if we get this kind of opportunity at all – perhaps with gold close to $1,600.
- I plan to exit all remaining short positions when gold shows substantial strength relative to the USD Index while the latter is still rallying. This might take place with gold close to $1,350 - $1,400. I expect silver to fall the hardest in the final part of the move. This moment (when gold performs very strongly against the rallying USD and miners are strong relative to gold after its substantial decline) is likely to be the best entry point for long-term investments, in my view. This might also happen with gold close to $1,375, but it’s too early to say with certainty at this time. I expect the final bottom to take place near the end of the year, perhaps in mid-December.
- As a confirmation for the above, I will use the (upcoming or perhaps we have already seen it?) top in the general stock market as the starting point for the three-month countdown. The reason is that after the 1929 top, gold miners declined for about three months after the general stock market started to slide. We also saw some confirmations of this theory based on the analogy to 2008. All in all, the precious metals sector is likely to bottom about three months after the general stock market tops.
- The above is based on the information available today, and it might change in the following days/weeks.
You will find my general overview of the outlook for gold on the chart below:
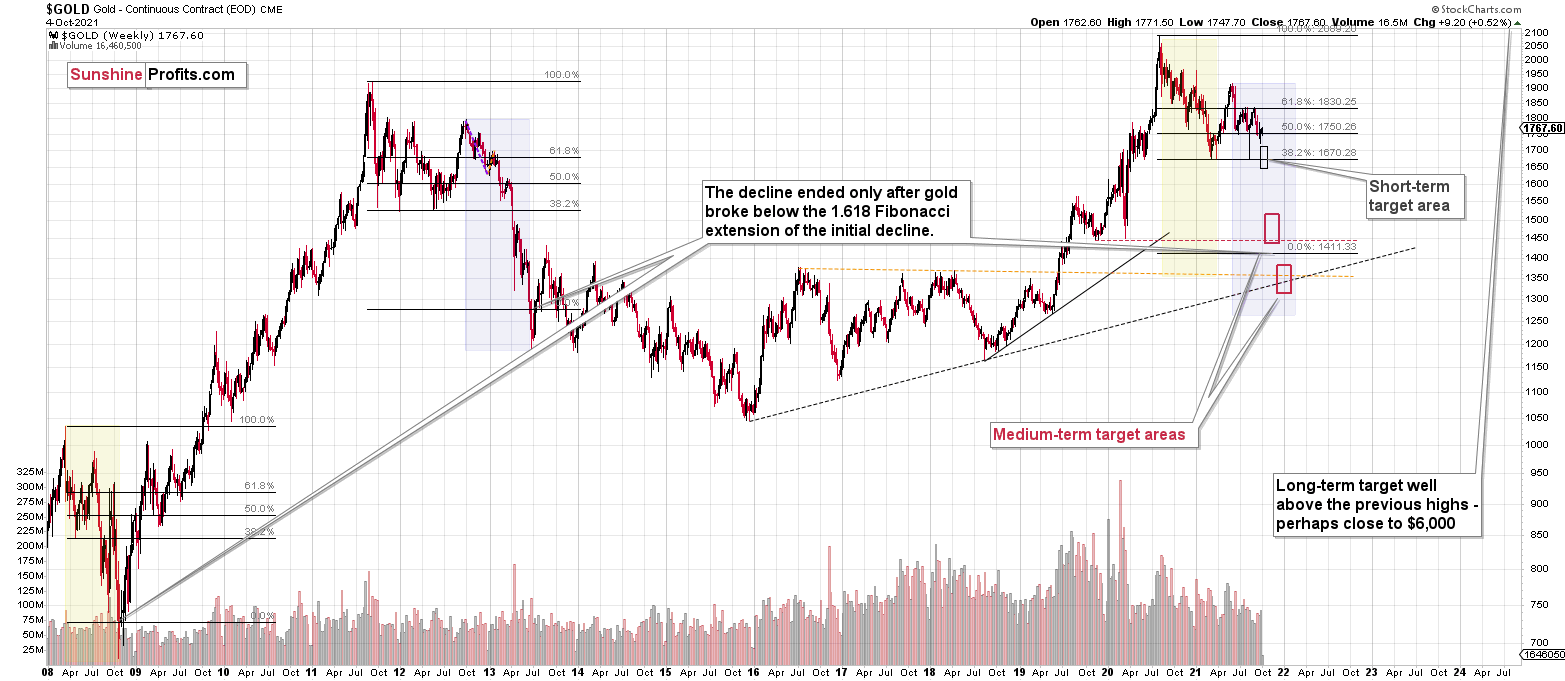
Please note that the above timing details are relatively broad and “for general overview only” – so that you know more or less what I think and how volatile I think the moves are likely to be – on an approximate basis. These time targets are not binding or clear enough for me to think that they should be used for purchasing options, warrants or similar instruments.
Summary
To summarize, the outlook for the precious metals sector remains extremely bearish for the next few months. It seems that we are in the final part of this short-term decline, which is why I expect silver to catch up with mining stocks and decline quite substantially.
Congratulations on reaping great profits from the previous short position in the junior mining stocks! While juniors are likely to decline more, it seems to me that the profits that one could get from shorting silver right now are likely to be even bigger.
From the medium-term point of view, the key two long-term factors remain the analogy to 2013 in gold and the broad head and shoulders pattern in the HUI Index. They both suggest much lower prices ahead.
It seems that our profits from the short positions are going to become truly epic in the following months.
After the sell-off (that takes gold to about $1,350 - $1,500), I expect the precious metals to rally significantly. The final part of the decline might take as little as 1-5 weeks, so it's important to stay alert to any changes.
Most importantly, please stay healthy and safe. We made a lot of money last March and this March, and it seems that we’re about to make much more on the upcoming decline, but you have to be healthy to enjoy the results.
As always, we'll keep you - our subscribers - informed.
By the way, we’re currently providing you with the possibility to extend your subscription by a year, two years or even three years with a special 20% discount. This discount can be applied right away, without the need to wait for your next renewal – if you choose to secure your premium access and complete the payment upfront. The boring time in the PMs is definitely over, and the time to pay close attention to the market is here. Naturally, it’s your capital, and the choice is up to you, but it seems that it might be a good idea to secure more premium access now while saving 20% at the same time. Our support team will be happy to assist you in the above-described upgrade at preferential terms – if you’d like to proceed, please contact us.
To summarize:
Trading capital (supplementary part of the portfolio; our opinion): Full speculative short position (300% of the full position) in silver is justified from the risk to reward point of view with the following binding exit profit-take price levels:
Silver futures profit-take exit price: $19.12
SLV profit-take exit price: $17.72
ZSL profit-take exit price: $41.38
HZD.TO profit-take exit price: $31.98
OR if gold reaches $1,683 – in this case, I think that taking profits and closing the short position in silver (and related instruments) will be justified from the risk to reward point of view, regardless of silver’s price.
I don’t have a stop-loss level for this trade.
For-your-information targets (our opinion; we continue to think that mining stocks are the preferred way of taking advantage of the upcoming price move, but if for whatever reason one wants / has to use silver or gold for this trade, we are providing the details anyway.):
Gold futures downside profit-take exit price: $1,683
GDXJ: $35.73
JDST: $16.28
GDXD: $33.48
All mining-stock-related instruments: if gold reaches $1,683 or the GDXJ reaches $35.73 (whichever is reached first), I would exit all remaining short positions in any mining stock trading vehicles aimed at profiting from the declines in the mining stocks.
Long-term capital (core part of the portfolio; our opinion): No positions (in other words: cash
Insurance capital (core part of the portfolio; our opinion): Full position
Whether you already subscribed or not, we encourage you to find out how to make the most of our alerts and read our replies to the most common alert-and-gold-trading-related-questions.
Please note that we describe the situation for the day that the alert is posted in the trading section. In other words, if we are writing about a speculative position, it means that it is up-to-date on the day it was posted. We are also featuring the initial target prices to decide whether keeping a position on a given day is in tune with your approach (some moves are too small for medium-term traders, and some might appear too big for day-traders).
Additionally, you might want to read why our stop-loss orders are usually relatively far from the current price.
Please note that a full position doesn't mean using all of the capital for a given trade. You will find details on our thoughts on gold portfolio structuring in the Key Insights section on our website.
As a reminder - "initial target price" means exactly that - an "initial" one. It's not a price level at which we suggest closing positions. If this becomes the case (like it did in the previous trade), we will refer to these levels as levels of exit orders (exactly as we've done previously). Stop-loss levels, however, are naturally not "initial", but something that, in our opinion, might be entered as an order.
Since it is impossible to synchronize target prices and stop-loss levels for all the ETFs and ETNs with the main markets that we provide these levels for (gold, silver and mining stocks - the GDX ETF), the stop-loss levels and target prices for other ETNs and ETF (among other: UGL, GLL, AGQ, ZSL, NUGT, DUST, JNUG, JDST) are provided as supplementary, and not as "final". This means that if a stop-loss or a target level is reached for any of the "additional instruments" (GLL for instance), but not for the "main instrument" (gold in this case), we will view positions in both gold and GLL as still open and the stop-loss for GLL would have to be moved lower. On the other hand, if gold moves to a stop-loss level but GLL doesn't, then we will view both positions (in gold and GLL) as closed. In other words, since it's not possible to be 100% certain that each related instrument moves to a given level when the underlying instrument does, we can't provide levels that would be binding. The levels that we do provide are our best estimate of the levels that will correspond to the levels in the underlying assets, but it will be the underlying assets that one will need to focus on regarding the signs pointing to closing a given position or keeping it open. We might adjust the levels in the "additional instruments" without adjusting the levels in the "main instruments", which will simply mean that we have improved our estimation of these levels, not that we changed our outlook on the markets. We are already working on a tool that would update these levels daily for the most popular ETFs, ETNs and individual mining stocks.
Our preferred ways to invest in and to trade gold along with the reasoning can be found in the how to buy gold section. Furthermore, our preferred ETFs and ETNs can be found in our Gold & Silver ETF Ranking.
As a reminder, Gold & Silver Trading Alerts are posted before or on each trading day (we usually post them before the opening bell, but we don't promise doing that each day). If there's anything urgent, we will send you an additional small alert before posting the main one.
Thank you.
Przemyslaw Radomski, CFA
Founder, Editor-in-chief

