

Briefly: in our opinion, full (300% of the regular position size) speculative short positions in junior mining stocks are justified from the risk/reward point of view at the moment of publishing this Alert.
Very little happened yesterday in gold, silver, and the USD Index, but there was a visible daily upswing in mining stocks. Did the outlook improve?
Probably not. The GDX ETF – classic proxy for mining stocks – moved higher yesterday, but this was a one-day phenomenon, and there was a good reason for it to happen. Namely, the general stock market moved back up after an intraday decline, and this show of strength seems to have been contagious.
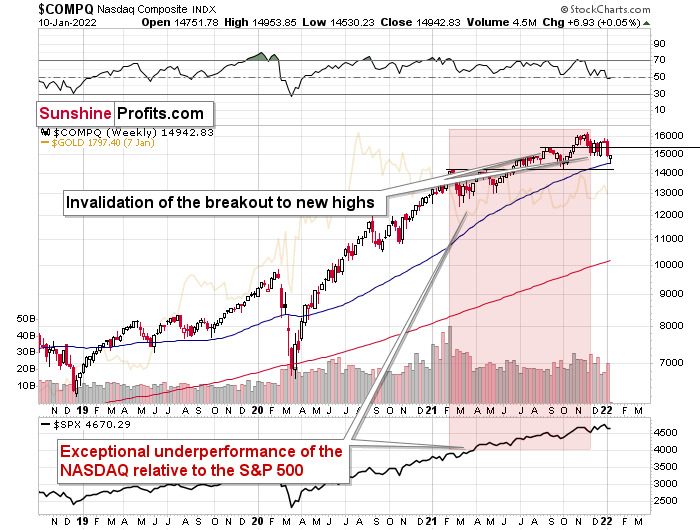
On the above NASDAQ chart, you can see that the tech stocks moved lower and then back up yesterday. The chart is based on weekly candlesticks, but this week includes just yesterday’s session so far, so what you see does a good job representing what just happened.
Is this a very bullish phenomenon? Not necessarily, because the tech stocks didn’t manage to rally back above the previous highs (marked with a horizontal black line). The breakdown below them was not invalidated.
While the final, medium-term (and perhaps long-term) top in stocks might already be in, the short term is rather unclear.
Mining stocks normally move based on the prices of the underlying metals: gold and silver, but every now and then, the general stock market impacts them to a considerable degree. Those cases are usually short-lived, so it seems that yesterday’s strength in miners is just a blip on the radar screen, nothing more.
Let’s check what gold and silver did yesterday.
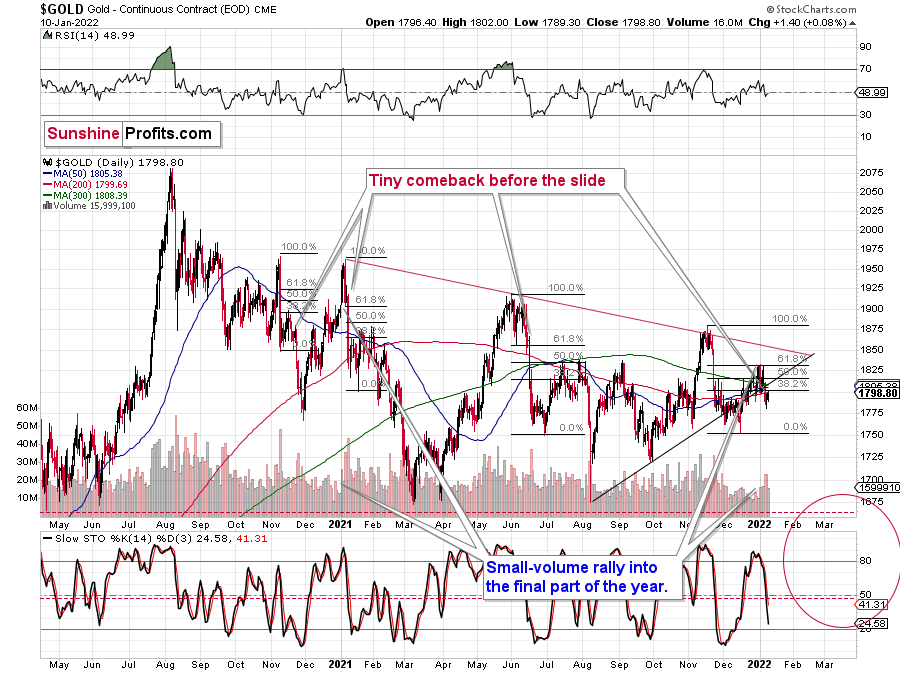
Gold was up by $1.40, and silver was up by $0.05. In other words, they were generally unchanged. Consequently, my yesterday’s comments on the above chart and the bearish price prediction for gold remain up-to-date:
As you can see on the above gold chart, despite the USD’s decline, gold was unable to get back above its previous rising support line. The sell signal from the Stochastic indicator (lower part of the chart) wasn’t invalidated either.
Yes, the shape of Friday’s session makes it look like a reversal hammer candlestick and the volume that accompanied this move was quite high, but it seems to me that the relative performance of gold vs. the USD Index and the fact that gold was unable to rally back above the previously broken support are more important.
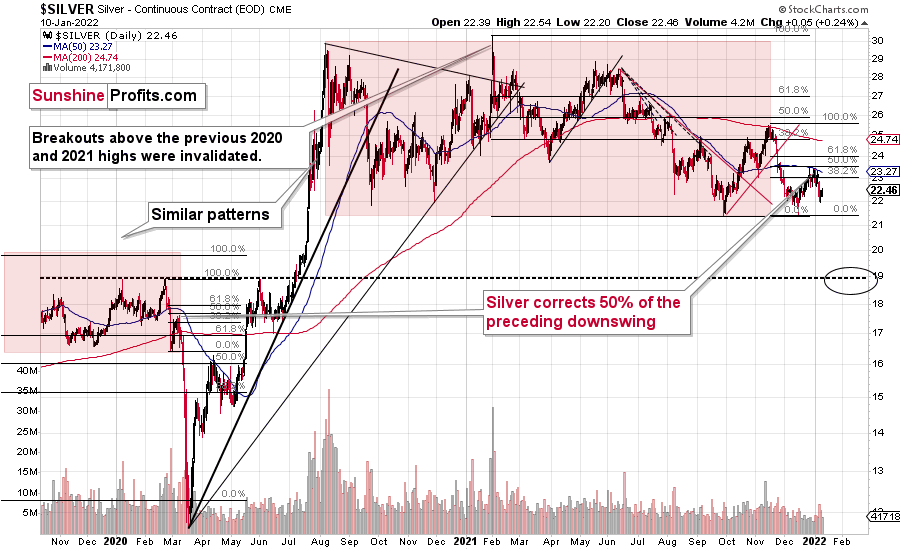
Besides, silver moved only slightly higher as well.
The rally in silver was too small to change anything.
Even though gold moved somewhat (less than $10 so far) higher today, this isn’t a game-changing move, but a post-decline breather that changes nothing, at least at this time.
Also, the key thing about the USD Index chart is that it didn’t move below its June 2020 low, and moved slightly higher after moving back to it recently.
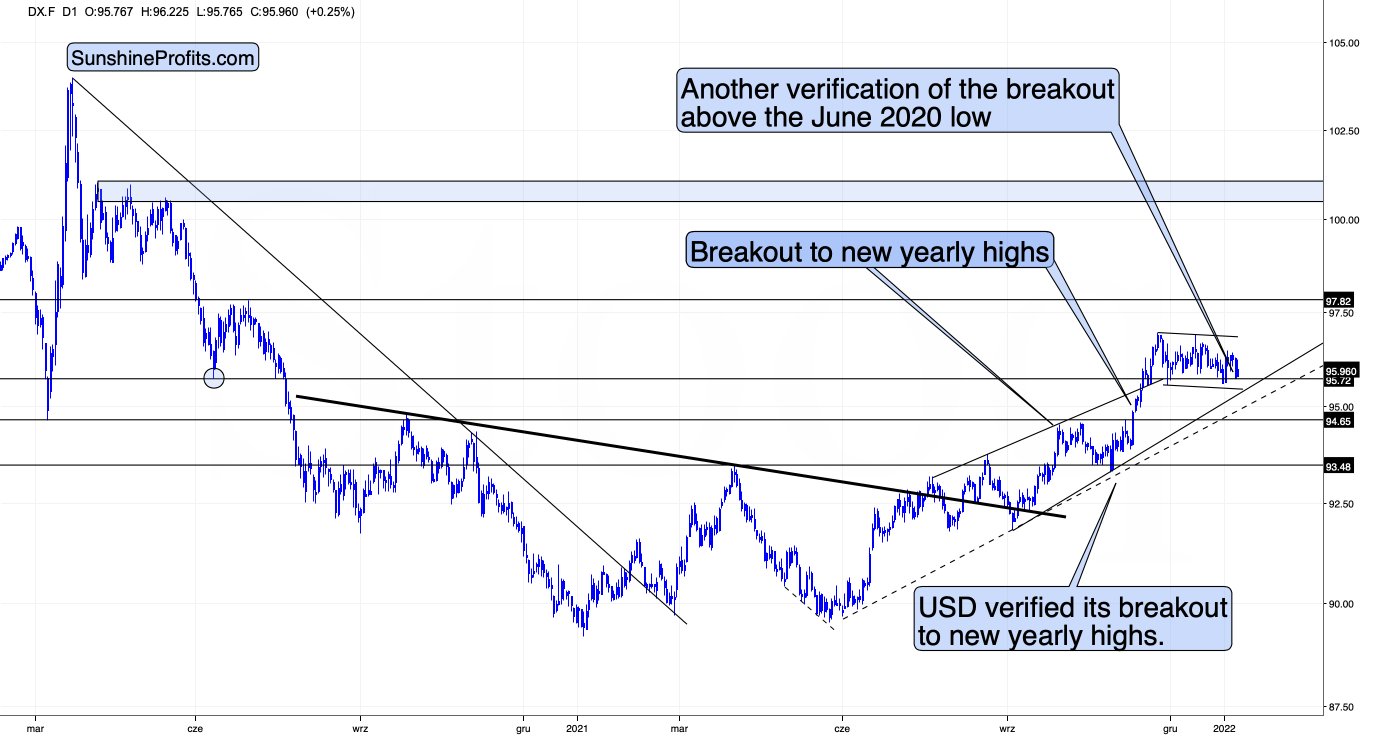
Technically, the USDX didn’t invalidate the breakout below the June 2020 low, so there were no bearish implications for the USD Index based on Friday’s (Jan. 7) or Monday’s (Jan. 10) sessions. This, combined with a weak reaction in the precious metals market, makes the situation particularly bearish for the latter.
The USD Index is likely to rally shortly – if not right away – and when that happens, the PMs are likely to respond by declining profoundly. I don’t think that predicting higher gold prices while there is a bullish outlook for the USDX is a good idea.
Having said that, let’s take a look at the markets from a more fundamental point of view.
Volatile Days Ahead
While the S&P 500 and the NASDAQ Composite recovered from sharp intraday losses on Jan. 10, investors’ mood swings signaled heightened anxiety. With the PMs whipsawing alongside the general stock market, more volatility should materialize in the weeks and months to come.
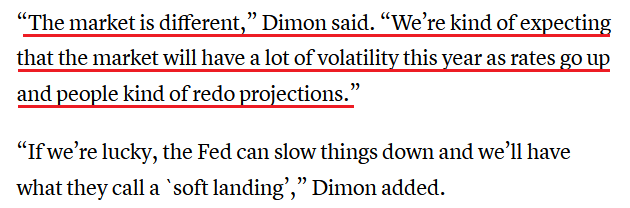
To explain, with the Fed on a hawkish warpath to fight rampant inflation, JPMorgan CEO Jamie Dimon told CNBC on Jan. 10 that a resilient U.S. economy could prove problematic for the financial markets in 2022.
“The consumer balance sheet has never been in better shape; they’re spending 25% more today than pre-COVID,” said Dimon. “Their debt-service ratio is better than it’s been since we’ve been keeping records for 50 years.”
As for inflation and the Fed:
“It’s possible that inflation is worse than they think and they raise rates more than people think. I personally would be surprised if it’s just four [interest rate] increases [in 2022],” he added.
How would the financial markets react?
 Source: CNBC
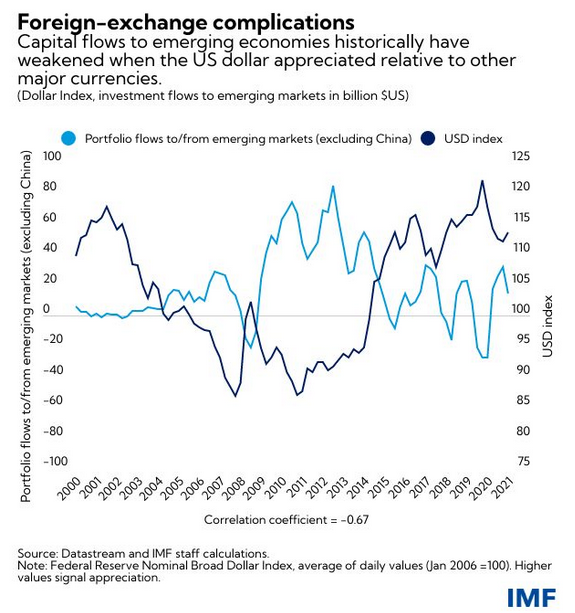
Singing a similar tune, the International Monetary Fund (IMF) warned on Jan. 10 that the Fed’s rate hike cycle could slaughter emerging markets. Its report revealed:
“For most of last year, investors priced in a temporary rise in inflation in the United States given the unsteady economic recovery and a slow unravelling of supply bottlenecks. Now sentiment has shifted. Prices are rising at the fastest pace in almost four decades and the tight labor market has started to feed into wage increases.”
While I warned for all of 2021 that inflationary pressures were bullish for the U.S. dollar and U.S. Treasury yields and bearish for the PMs, the IMF stated:
“Faster Fed rate increases in response could rattle financial markets and tighten financial conditions globally. These developments could come with a slowing of US demand and trade and may lead to capital outflows and currency depreciation in emerging markets.”
As a result, even the IMF is anxiously bullish on the USD Index:
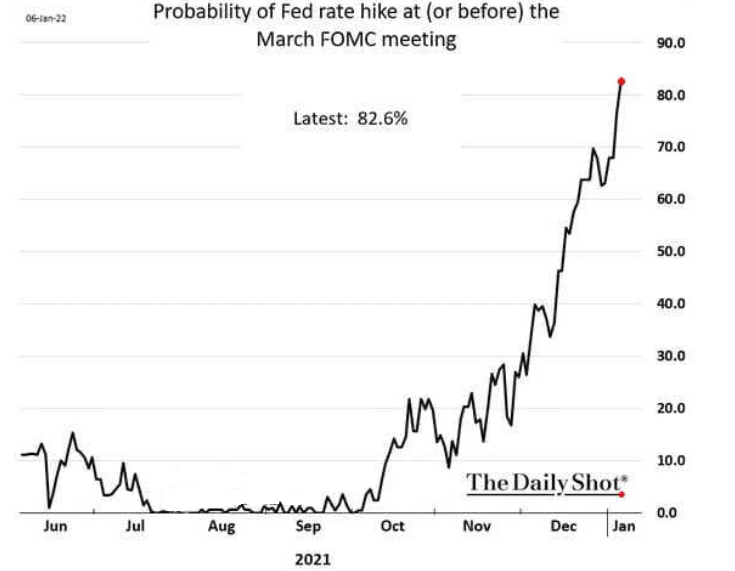
For a good reason. With September, July, June, and May all gone by the wayside, now, the market-implied probability of a Fed rate hike in March has risen to nearly 83%. For context, the probability of a March liftoff was less than 10% in early November.
Please see below:
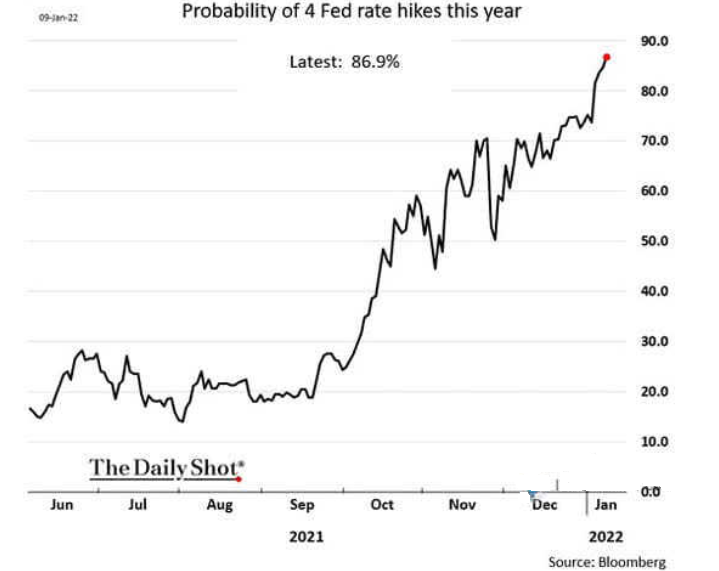
Likewise, the market-implied probability of four rate hikes by the Fed in 2022 has risen to nearly 87%. Again, the probability was less than 50% in early November.
Please see below:
Why the material shift? Well, while I’ve been warning for months that rampant inflation would elicit a hawkish about-face from the Fed, investors are finally coming around to this reality. With inflation still running hot, market participants understand that pricing pressures won’t subside without policy responses from the Fed. As a result, the “transitory” narrative is dead, and investors have lost one of their staunchest allies. This means that predicting silver and gold at higher levels in the medium term might not be the best idea.
To that point, Bank of America’s dove-hawk spectrum shows that the dovish brigade has lost several soldiers. With the hawks now on the offensive, the officials preaching monetary patience are few and far between.
Please see below:
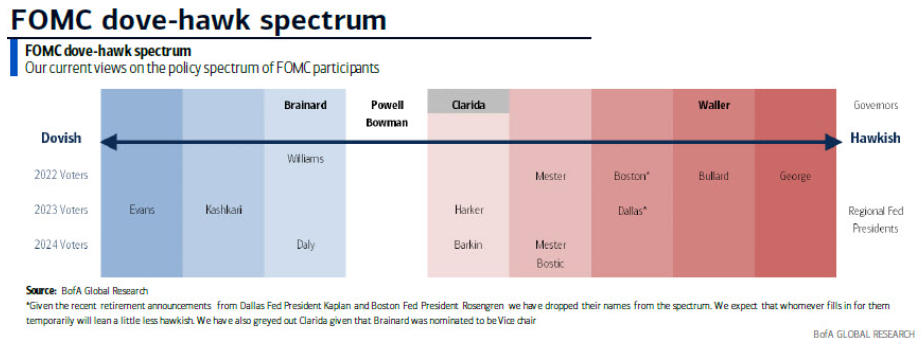
For context, Bank of America still places San Francisco Fed President Mary Daly in the dovish bucket. However, I noted on Dec. 23 that she has materially shifted her stance in recent weeks:
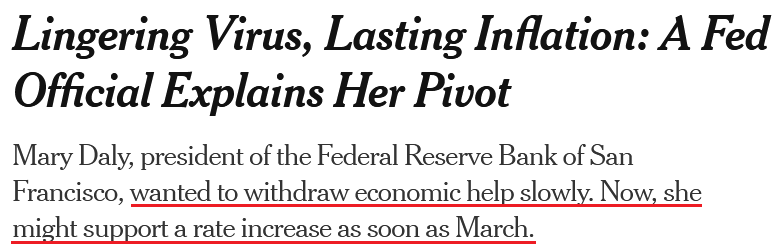 Source: The New York Times
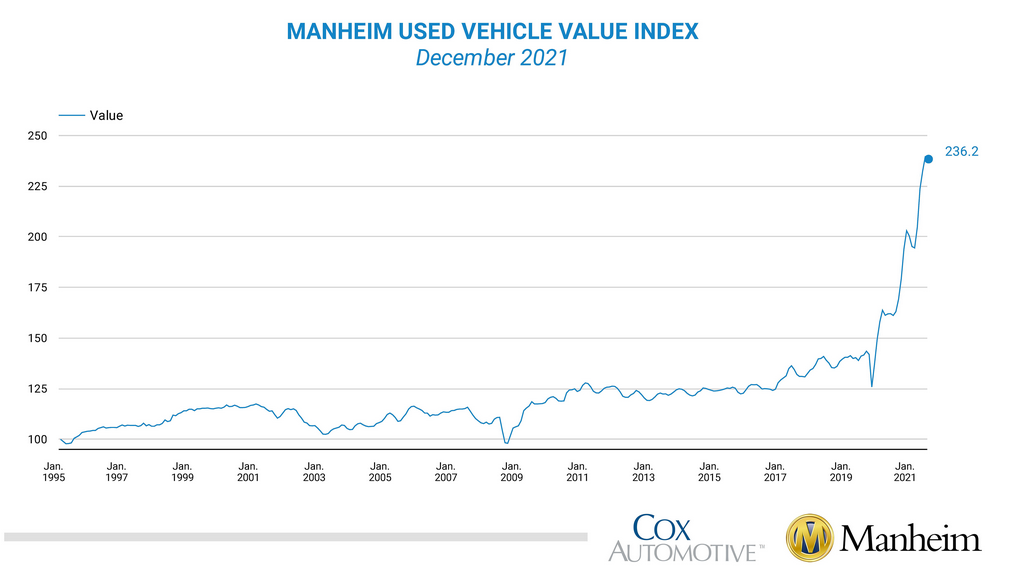
Furthermore, with inflationary pressures still bubbling, the Manheim Used Vehicle Value Index hit another all-time high of 236.2 in December, as “wholesale used vehicle prices (on a mix-, mileage-, and seasonally adjusted basis) increased 1.6% month-over-month.”
Please see below:
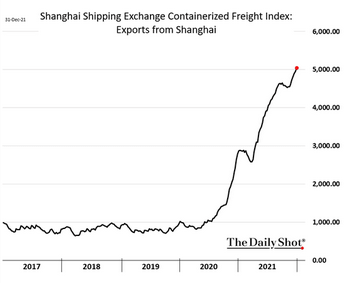
On top of that, the cost of shipping from Shanghai, China, is still increasing. With the U.S. importing more goods from China than any other nation, the inflationary impact on the U.S. economy is material.
Please see below:
Finally, while the GDXJ ETF benefited from the NASDAQ Composite’s intraday reversal on Jan. 10, I warned on Oct. 26 that monetary policy tightening would eventually upend the junior miners. I wrote:
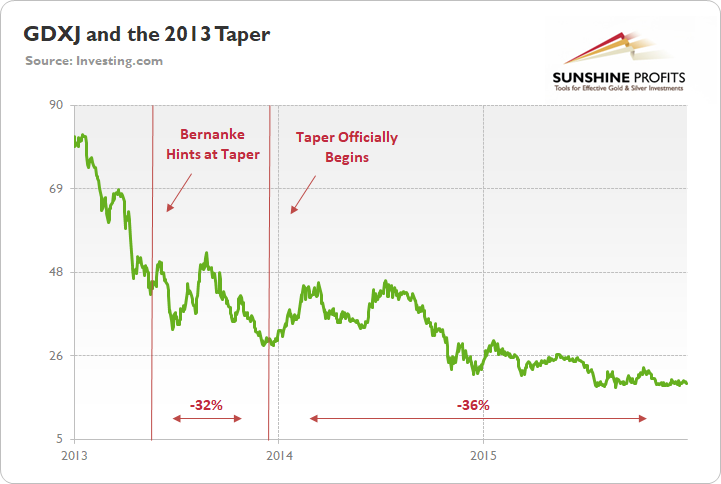
To explain, the green line above tracks the GDXJ ETF from the beginning of 2013 to the end of 2015. If you analyze the left side of the chart, you can see that when Fed Chairman Ben Bernanke hinted at tapering on May 22, 2013, the GDXJ ETF declined by 32% from May 22 until the taper began on Dec. 18.
Moreover, the onslaught didn’t end there. Once the taper officially began, the GDXJ ETF enjoyed a relief rally (similar to what we’re witnessing now), as long-term interest rates declined and the PMs assumed that the worst was in the rearview.
However, as the liquidity drain caught up to the junior miners over the medium term, the GDXJ ETF declined by another 36% from when the taper was announced on Dec. 18, 2013 until the end of 2015.
To that point, with part one already on the books, the second act will likely unfold once the Fed formally begins its taper in “either mid-November or mid-December.” Thus, history implies that the GDXJ ETF still has plenty of downside left.
While the junior miners' ETF has declined by more than 11% since Oct. 26, Goldman Sachs has come around to our way of thinking.
Please see below:
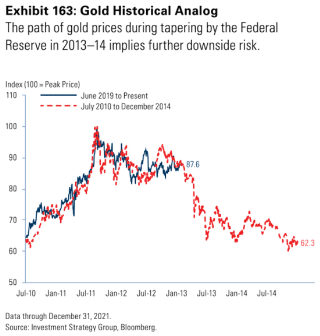
To explain, Goldman Sachs told its clients last week that the yellow metal has been following its ominous path since 2013/2014 (as you may recall, I’ve been writing about the 2013-now analogy for months). For context, the red line above tracks gold’s price action from July 2010 until December 2014, while the blue line above tracks gold’s price action from July 2019 until now.
If you analyze the symmetrical overlay, you can see that the pair have been in sync for some time. Moreover, if you focus your attention on the red line’s plight as time passes, it’s clear why Goldman Sachs is warning its clients about “further downside risk”.
To that point, with the investment bank forecasting a real (inflation-adjusted) interest rate regime change in 2022, gold is poised to suffer along the way.
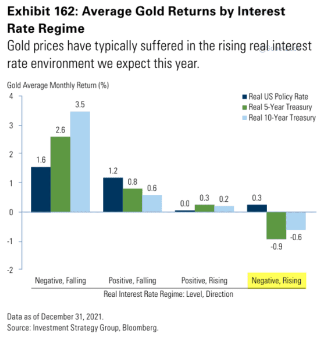
To explain, the various bars above track gold’s monthly returns when the real U.S. Federal Funds Rate (dark blue), the real U.S. 5-Year Treasury yield (green), and the real U.S. 10-Year Treasury yield (light blue) begin with positive/negative values and then increase/decrease.
If you focus your attention on the bars furthest to the right, you can see that when the real U.S. 5-Year Treasury yield and the real U.S. 10-Year Treasury yield are negative and then rise, gold suffers its worst monthly performances. Moreover, with the current fundamental environment presenting us with precisely that, similar results will likely materialize over the medium term.
The bottom line? While investors desperately bought the dip on Jan. 10, the more than 2% intraday swing in the NASDAQ Composite screamed of monetary policy anxiety. With another hot inflation print poised to hit the wire on Jan. 12, the reprieve will likely be short-lived. Furthermore, with the PMs suffering from a similar fundamental affliction – as both the PMs and technology stocks are extremely allergic to rising interest rates – volatility is likely here to stay. As a result, the Fed should continue to break investors’ hearts over the medium term.
In conclusion, the PMs rallied on Jan. 10, though their fundamental outlooks remain profoundly bearish. With interest rates poised to rise and the USD Index still undervalued, more headwinds should confront gold, silver, and mining stocks in the coming months. As a result, long-term buying opportunities are likely still a ways away.
Overview of the Upcoming Part of the Decline
- It seems to me that the corrective upswing is over, and that gold, silver, and mining stocks are now likely to continue their medium-term decline.
- It seems that the first (bigger) stop for gold will be close to its previous 2021 lows, slightly below $1,700. Then it will likely correct a bit, but it’s unclear if I want to exit or reverse the current short position based on that – it depends on the number and the nature of the bullish indications that we get at that time.
- After the above-mentioned correction, we’re likely to see a powerful slide, perhaps close to the 2020 low ($1,450 - $1,500).
- If we see a situation where miners slide in a meaningful and volatile way while silver doesn’t (it just declines moderately), I plan to – once again – switch from short positions in miners to short positions in silver. At this time, it’s too early to say at what price levels this could take place, and if we get this kind of opportunity at all – perhaps with gold close to $1,600.
- I plan to exit all remaining short positions once gold shows substantial strength relative to the USD Index while the latter is still rallying. This may be the case with gold close to $1,350 - $1,400. I expect silver to fall the hardest in the final part of the move. This moment (when gold performs very strongly against the rallying USD and miners are strong relative to gold after its substantial decline) is likely to be the best entry point for long-term investments, in my view. This can also happen with gold close to $1,375, but at the moment it’s too early to say with certainty.
- As a confirmation for the above, I will use the (upcoming or perhaps we have already seen it?) top in the general stock market as the starting point for the three-month countdown. The reason is that after the 1929 top, gold miners declined for about three months after the general stock market started to slide. We also saw some confirmations of this theory based on the analogy to 2008. All in all, the precious metals sector is likely to bottom about three months after the general stock market tops.
- The above is based on the information available today, and it might change in the following days/weeks.
You will find my general overview of the outlook for gold on the chart below:
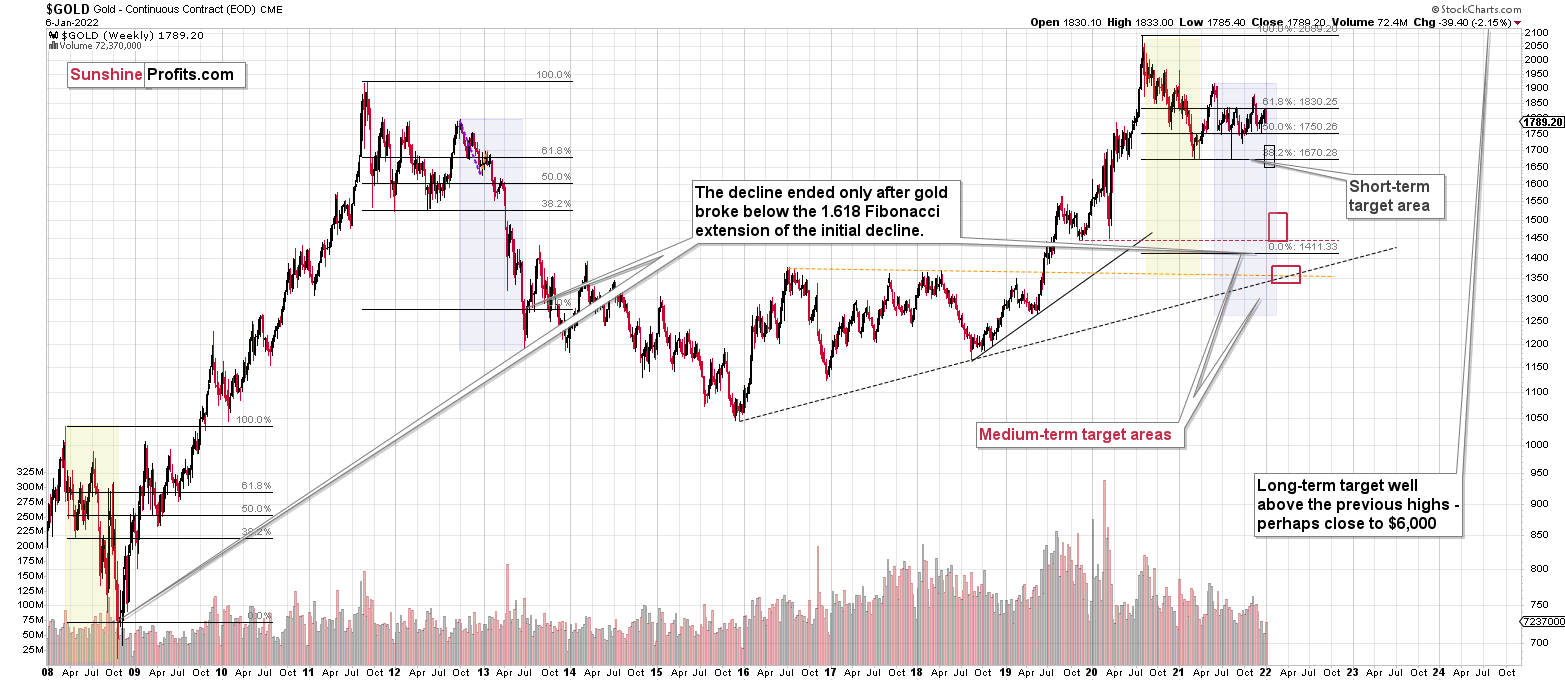
Please note that the above timing details are relatively broad and “for general overview only” – so that you know more or less what I think and how volatile I think the moves are likely to be – on an approximate basis. These time targets are not binding or clear enough for me to think that they should be used for purchasing options, warrants or similar instruments.
Summary
Summing up, it seems to me that the corrective upswing is over, and that gold, silver, and mining stocks are now likely to continue their medium-term decline. I continue to think that junior mining stocks are currently likely to decline the most out of all parts of the precious metals sector.
From the medium-term point of view, the key two long-term factors remain the analogy to 2013 in gold and the broad head and shoulders pattern in the HUI Index. They both suggest much lower prices ahead.
It seems that our profits from the short positions are going to become truly epic in the following months.
After the sell-off (that takes gold to about $1,350 - $1,500), I expect the precious metals to rally significantly. The final part of the decline might take as little as 1-5 weeks, so it's important to stay alert to any changes.
Most importantly, please stay healthy and safe. We made a lot of money last March and this March, and it seems that we’re about to make much more on the upcoming decline, but you have to be healthy to enjoy the results.
As always, we'll keep you - our subscribers - informed.
To summarize:
Trading capital (supplementary part of the portfolio; our opinion): Full speculative short positions (300% of the full position) in junior mining stocks are justified from the risk to reward point of view with the following binding exit profit-take price levels:
Mining stocks (price levels for the GDXJ ETF): binding profit-take exit price: $35.73; stop-loss: none (the volatility is too big to justify a stop-loss order in case of this particular trade)
Alternatively, if one seeks leverage, we’re providing the binding profit-take levels for the JDST (2x leveraged) and GDXD (3x leveraged – which is not suggested for most traders/investors due to the significant leverage). The binding profit-take level for the JDST: $16.18; stop-loss for the JDST: none (the volatility is too big to justify a SL order in case of this particular trade); binding profit-take level for the GDXD: $32.08; stop-loss for the GDXD: none (the volatility is too big to justify a SL order in case of this particular trade).
For-your-information targets (our opinion; we continue to think that mining stocks are the preferred way of taking advantage of the upcoming price move, but if for whatever reason one wants / has to use silver or gold for this trade, we are providing the details anyway.):
Silver futures downside profit-take exit price: $19.12
SLV profit-take exit price: $17.72
ZSL profit-take exit price: $41.38
Gold futures downside profit-take exit price: $1,683
HGD.TO – alternative (Canadian) inverse 2x leveraged gold stocks ETF – the upside profit-take exit price: $12.48
HZD.TO – alternative (Canadian) inverse 2x leveraged silver ETF – the upside profit-take exit price: $30.48
Long-term capital (core part of the portfolio; our opinion): No positions (in other words: cash
Insurance capital (core part of the portfolio; our opinion): Full position
Whether you already subscribed or not, we encourage you to find out how to make the most of our alerts and read our replies to the most common alert-and-gold-trading-related-questions.
Please note that we describe the situation for the day that the alert is posted in the trading section. In other words, if we are writing about a speculative position, it means that it is up-to-date on the day it was posted. We are also featuring the initial target prices to decide whether keeping a position on a given day is in tune with your approach (some moves are too small for medium-term traders, and some might appear too big for day-traders).
Additionally, you might want to read why our stop-loss orders are usually relatively far from the current price.
Please note that a full position doesn't mean using all of the capital for a given trade. You will find details on our thoughts on gold portfolio structuring in the Key Insights section on our website.
As a reminder - "initial target price" means exactly that - an "initial" one. It's not a price level at which we suggest closing positions. If this becomes the case (like it did in the previous trade), we will refer to these levels as levels of exit orders (exactly as we've done previously). Stop-loss levels, however, are naturally not "initial", but something that, in our opinion, might be entered as an order.
Since it is impossible to synchronize target prices and stop-loss levels for all the ETFs and ETNs with the main markets that we provide these levels for (gold, silver and mining stocks - the GDX ETF), the stop-loss levels and target prices for other ETNs and ETF (among other: UGL, GLL, AGQ, ZSL, NUGT, DUST, JNUG, JDST) are provided as supplementary, and not as "final". This means that if a stop-loss or a target level is reached for any of the "additional instruments" (GLL for instance), but not for the "main instrument" (gold in this case), we will view positions in both gold and GLL as still open and the stop-loss for GLL would have to be moved lower. On the other hand, if gold moves to a stop-loss level but GLL doesn't, then we will view both positions (in gold and GLL) as closed. In other words, since it's not possible to be 100% certain that each related instrument moves to a given level when the underlying instrument does, we can't provide levels that would be binding. The levels that we do provide are our best estimate of the levels that will correspond to the levels in the underlying assets, but it will be the underlying assets that one will need to focus on regarding the signs pointing to closing a given position or keeping it open. We might adjust the levels in the "additional instruments" without adjusting the levels in the "main instruments", which will simply mean that we have improved our estimation of these levels, not that we changed our outlook on the markets. We are already working on a tool that would update these levels daily for the most popular ETFs, ETNs and individual mining stocks.
Our preferred ways to invest in and to trade gold along with the reasoning can be found in the how to buy gold section. Furthermore, our preferred ETFs and ETNs can be found in our Gold & Silver ETF Ranking.
As a reminder, Gold & Silver Trading Alerts are posted before or on each trading day (we usually post them before the opening bell, but we don't promise doing that each day). If there's anything urgent, we will send you an additional small alert before posting the main one.
Thank you.
Przemyslaw Radomski, CFA
Founder, Editor-in-chief

