

Briefly: in our opinion, full (300% of the regular position size) speculative short positions in junior mining stocks are justified from the risk/reward point of view at the moment of publishing this Alert.
Bond yields soared once again, just as I’ve been expecting them to for many months now. The reaction in some markets was as expected (the USD Index soared), but in some, it was perplexing. Gold moved lower a little, miners declined a bit more, and silver… rallied. Who’s faking it?
Well, perhaps nobody is. Let’s look at the yields’ movement first.
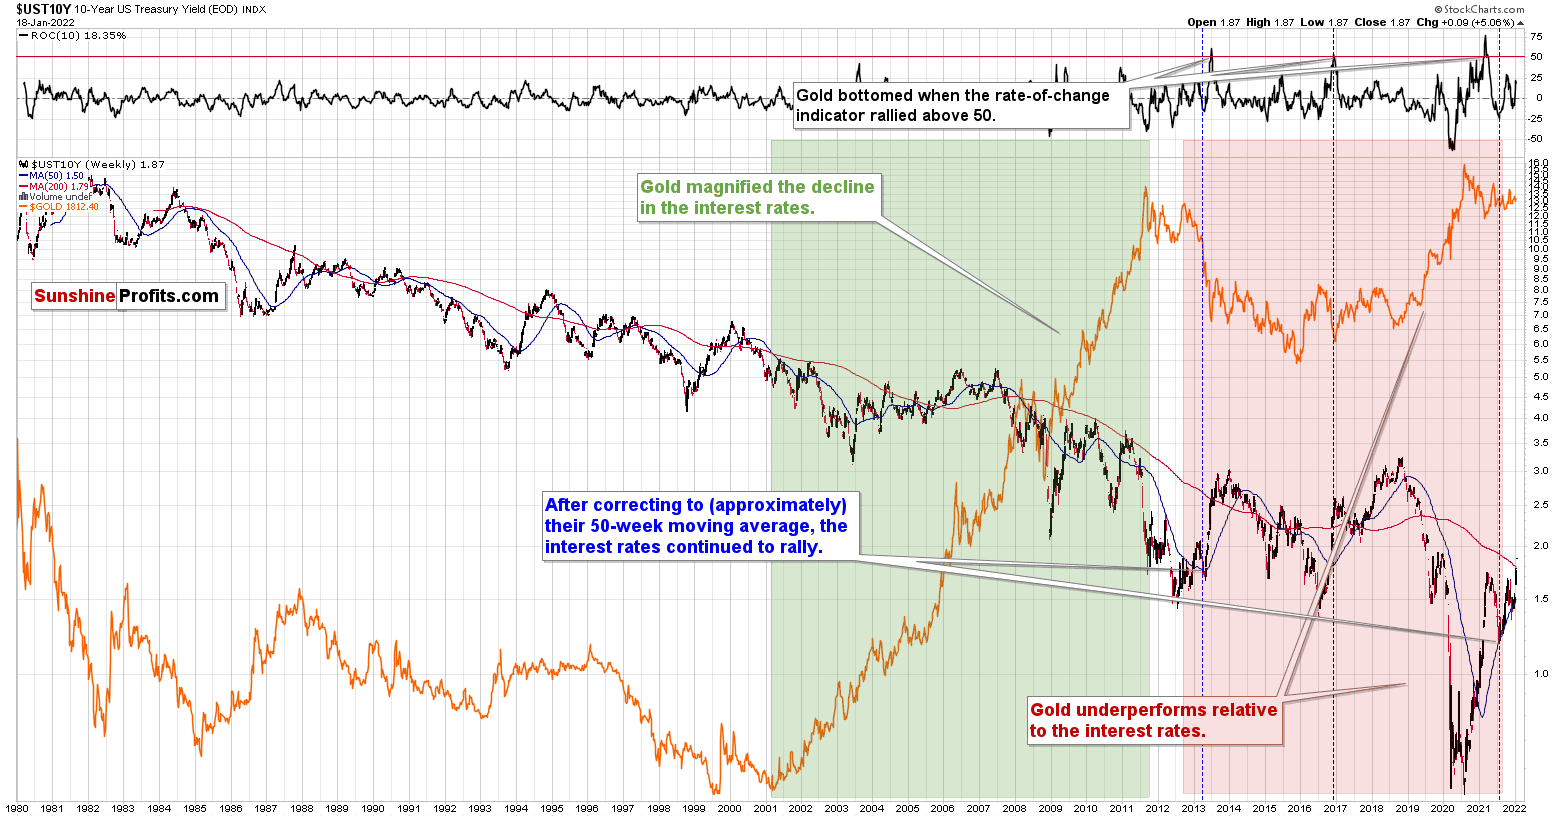
The 10-year bond yields have just moved to new yearly highs and are also above their 2021 highs. This happened just after they moved back to their 50-week moving average (marked in blue). For a long time, I’ve been writing that the 2013 performance is likely to be repeated also in this market, and that’s exactly what is taking place right now. Bond yields are doing what they did back then.
If history continues to rhyme, we can expect bond yields to rally further, the USD Index to gain, and we can predict gold at lower prices.
Speaking of the USD Index, let’s take a look at what it did yesterday.
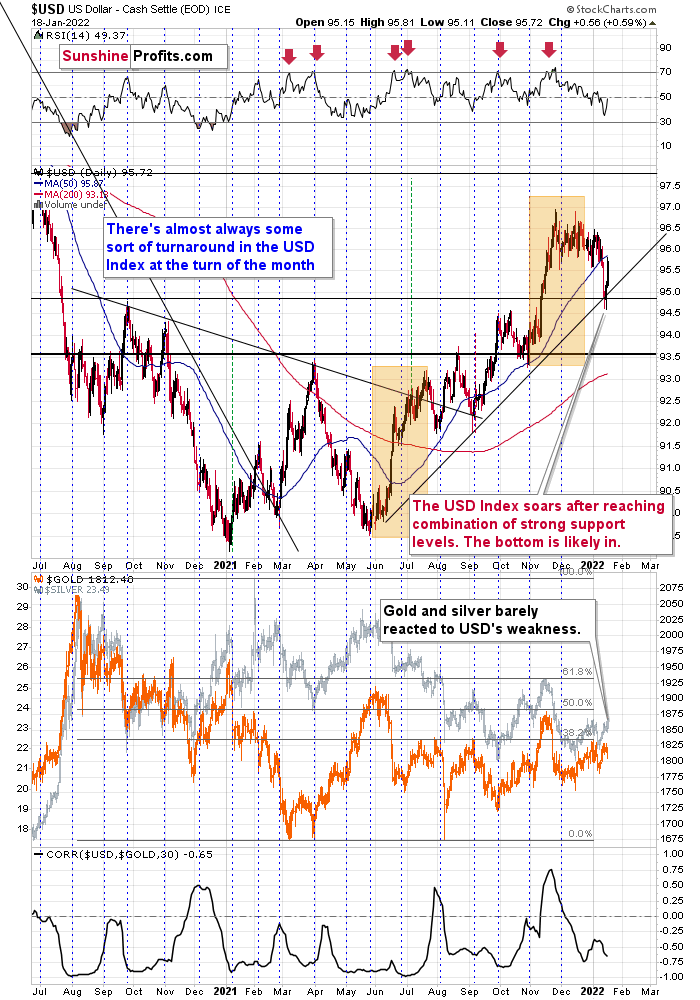
It soared over 0.5 index points, which was the largest daily increase so far this year. This happened after the USD Index moved to a combination of powerful support levels: the rising medium-term support line and the late-2020 high. The tiny attempts to move below those levels were quickly invalidated, and the USD Index was likely to rally back up; and so it did.
What’s next? The uptrend was not broken, so it’s likely to continue. In other words, the USD Index’s rally is likely to continue, and this, in turn, is likely to trigger declines across the precious metals sector.
Gold didn’t react with a significant decline yesterday – just a moderate/small one – which some might view as bullish. I’d say that it’s rather neutral.
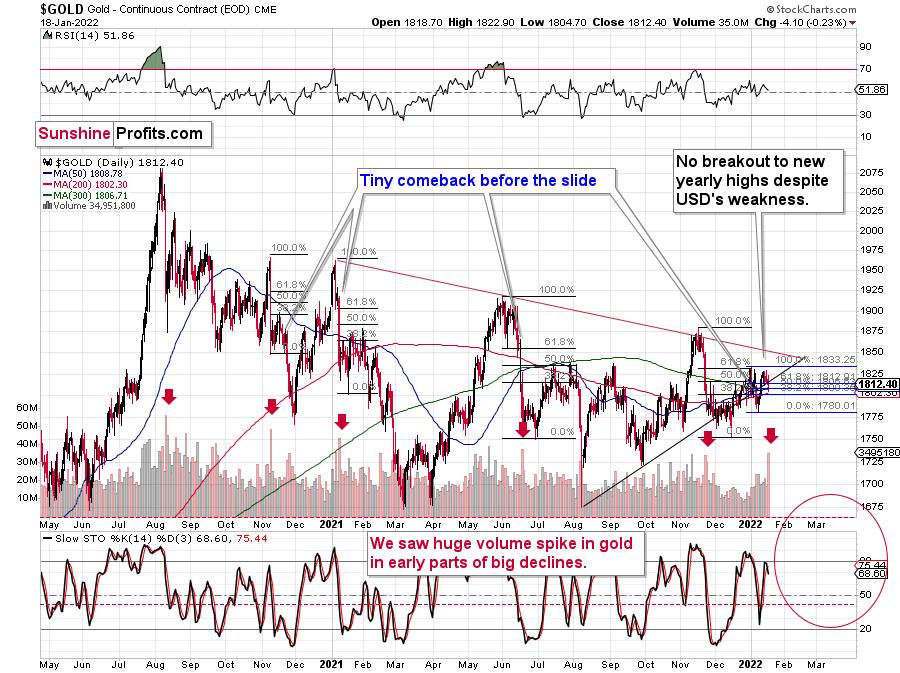
The rally above the 2021 highs in bond yields might have come as a shock to many investors, and they might not have been sure how to react or what to make of it. It might also have been the “buy the rumor, sell the fact” type of reaction. Either way, it seems to me that we’ll have to wait a few days and see how it plays out once the dust settles.
The volume that we saw yesterday was huge. After a period of relatively average volume, we saw this huge volume spike. I marked the previous cases with red arrows. In those cases, such volume accompanied gold’s sizable declines. This time, the volume spike accompanied a $4.10 decline, which might appear perplexing.
Fortunately, gold is not the only market that we can analyze, and – as it’s often the case – context provides us with details that help to make sense of what really happened. Let’s check the key supplemental factor – silver’s price action.
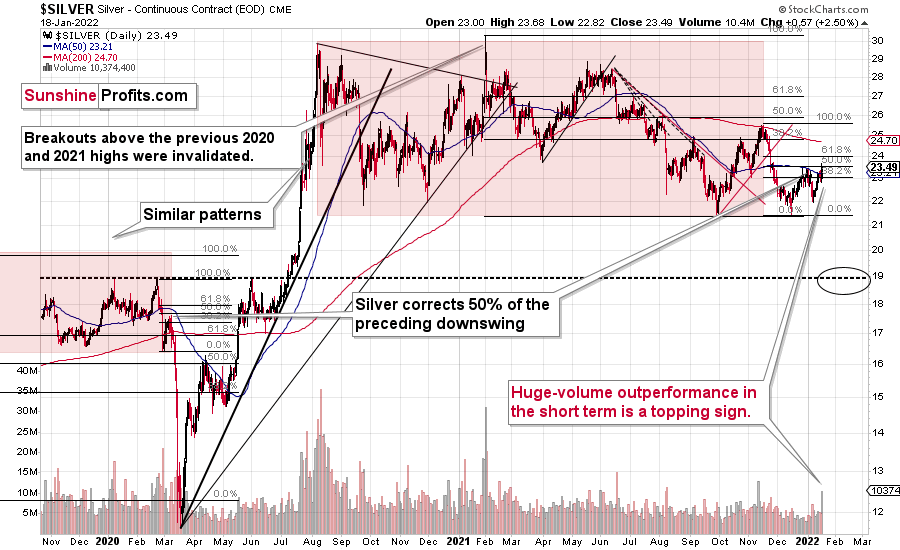
While gold declined a bit, silver soared over $0.5! The volume that accompanied this sizable daily upswing was the biggest that we’ve seen so far this year too. The latter provides additional confirmation of the importance of yesterday’s session.
What was it that happened yesterday that was so important?
Silver outperformed gold on a very short-term basis!
This is profoundly important, because that’s what has been accompanying gold’s, silver’s, and mining stocks’ tops for many years. Knowing to pay attention to even small signs of silver’s outperformance is one of the useful gold trading tips, and the extent of the outperformance is what determines the importance of the signal (and its bearishness). The extent was huge yesterday, so the implications are very bearish.
Yes, silver moved to new yearly highs as well, but silver is known for its fake breakouts (“fakeouts”), which usually happen without analogous moves in gold and mining stocks. Since neither gold nor miners moved to new yearly highs yesterday, it seems that silver “faked out” once again. Silver is up in today’s pre-market trading, and gold is up only slightly, but the latter is not even close to moving to new 2022 highs. The GDX ETF is actually down in today’s London trading (at the moment of writing these words).
Speaking of mining stocks, let’s take a look at what happened in them yesterday.
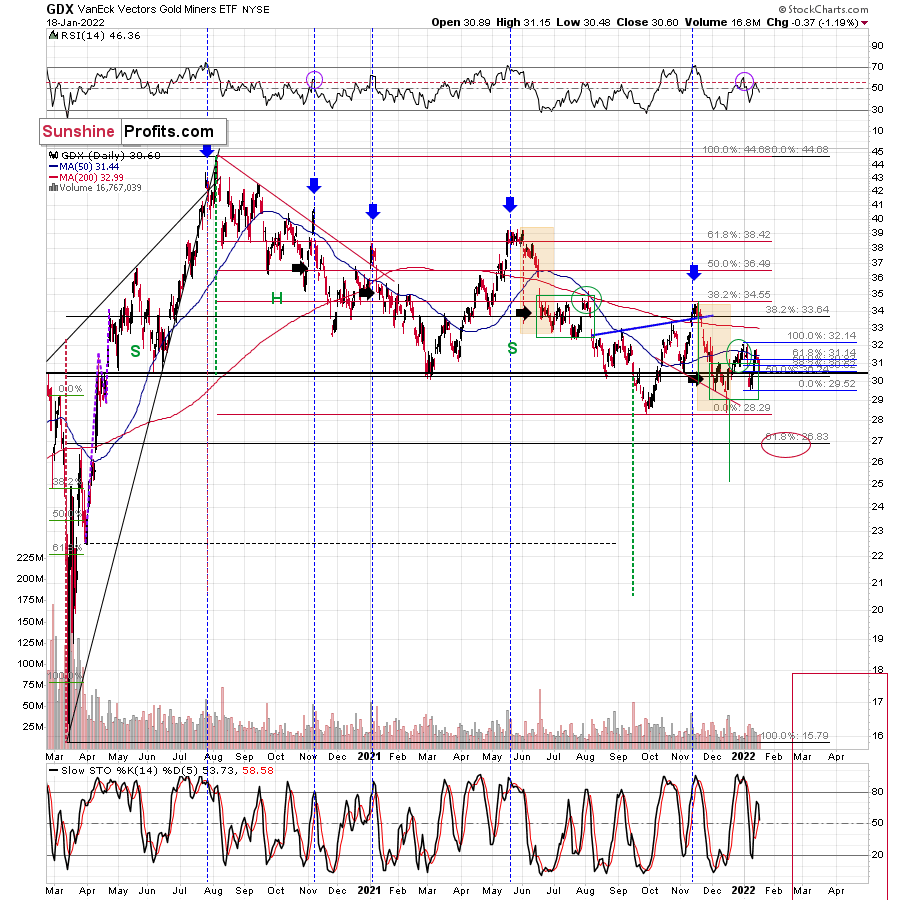
In short, they declined – by over 1%, which is about five times more than gold. Since silver outperformed gold, while gold miners underperformed it, the implications for the precious metals sector are bearish.
Having said that, let’s take a look at the markets from a more fundamental point of view.
Hang On to Your Hat
With the S&P 500 suffering another freak out on Jan. 18, the bond market rattled investors once again. With the Fed essentially warning bond investors that they’re on their own in 2022, U.S. Treasury yields have soared as the bulls’ bids dry up.
Please see below:
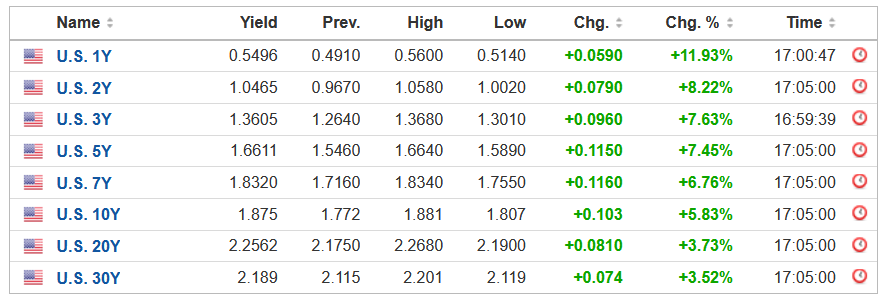 Source: Investing.com
Moreover, with the USD Index staging a comeback and interest rates poised to march higher over the medium term, the PMs’ fundamental outlooks continue to worsen. To explain, with the Fed transitioning from employment saviors to inflation fighters, nine officials have called for rate hikes since the New Year. With investors now realizing what I warned about throughout 2021, the narrative has flipped. For context, market participants initially expected the Fed to raise interest rates in 2023. Now, they’re bracing for more than one rate hike by March 2022.
Please see below:
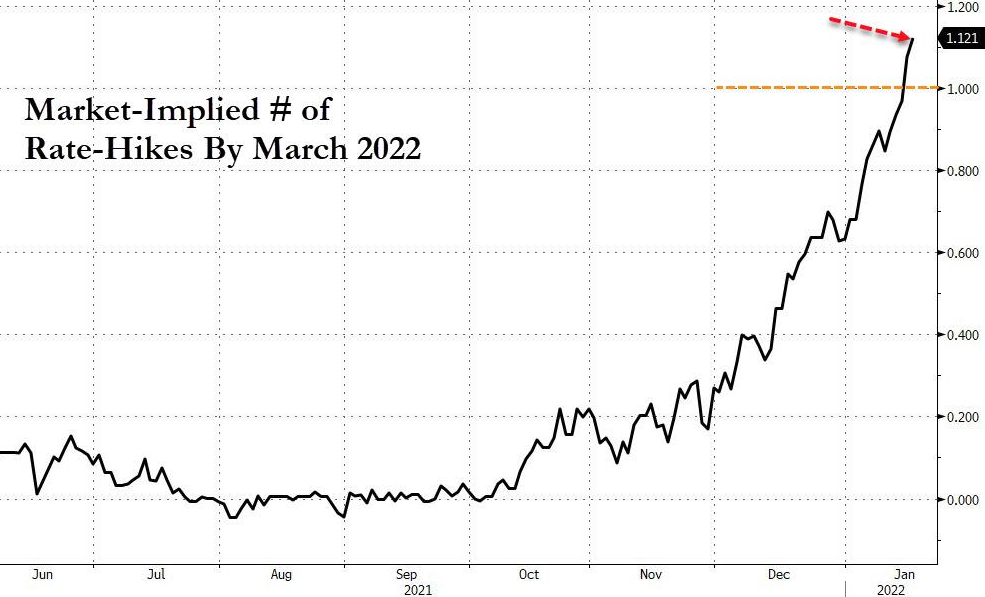 Source: Bloomberg/ZeroHedge
To explain, the odds of a March liftoff were closer to 10% in early November. However, if you analyze the right side of the chart above, you can see that the number of implied rate hikes has surpassed one. As a result, investors are worried that the Fed may hike rates by 50 basis points in March.
Moreover, the Fed isn’t the only central bank on a hawkish warpath. With liquidity drying up across the globe, higher real interest rates should be problematic for the PMs over the medium term.
Please see below:
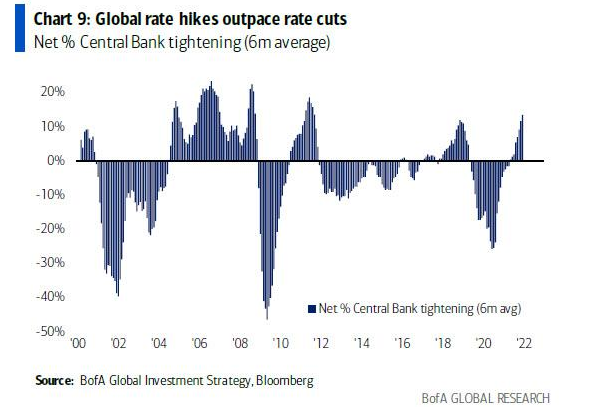
To explain, the blue bars above track the net percentage of global central banks that are tightening monetary policy. If you analyze the right side of the chart, you can see that rate hikes now outpace rate cuts (depicted by the blue bars rising).
Furthermore, when gold began its surge in late 2008 before peaking in late 2011, it coincided with rate cuts that massively outpaced rate hikes. For example, if you analyze the sharp drop in the blue bars from ‘08 to ’10, it’s no secret that gold benefited materially from the liquidity injections. However, when rate hikes outpaced rate cuts in 2011 and early 2012, gold ended up declining by nearly 50% from its peak and hitting a low in 2015.
Today, we have a parallel development. If you focus your attention on the blue bars in the ’20 column, it’s no surprise that massive rate cuts helped gold reach a new all-time high in 2020. With the dynamic reversing in 2021, it’s no surprise that gold materially underperformed. However, with the bulk of the rate hikes poised to commence in 2022, current fundamentals align with gold’s path from roughly 10 years ago. As a result, more downside should materialize as the rate surge continues.
To that point, while the Omicron variant has disrupted economic activity, the Fed should have little reason not to raise rates in the coming months. To explain, the New York Fed released its Empire Manufacturing Survey on Jan. 18: “after eighteen months of positive readings, the general business conditions fell a steep thirty-three points to -0.7.” In a nutshell: New York State manufacturing activity fell off a cliff in January.
However, while the latest coronavirus strain helped sink the headline index, firms remain optimistic about the medium term. Likewise, with six-month inflation expectations hitting new all-time highs, the Omicron speed bump shouldn’t change the Fed’s hawkish disposition. The report revealed:
“The index for future business conditions held steady at 35.1. The indexes for future prices paid and received both rose to record highs. The capital expenditures index climbed two points to 39.7, a multi-year high, and the technology spending index held steady at 31.9, suggesting that firms plan significant increases in both capital spending and technology spending in the months ahead.”
Please see below:
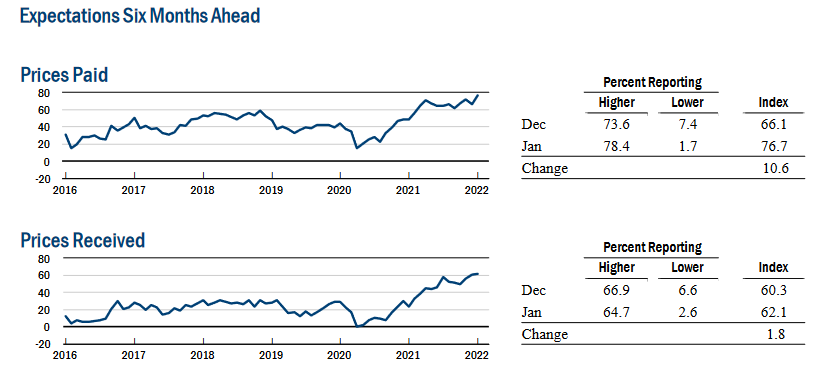 Source: New York Fed
What’s more, the Atlanta Fed’s wage tracker shows that American employees aged 16 to 24 saw their median wages increase by 10.50% year-over-year (YoY) in December – a new all-time high.
Please see below:
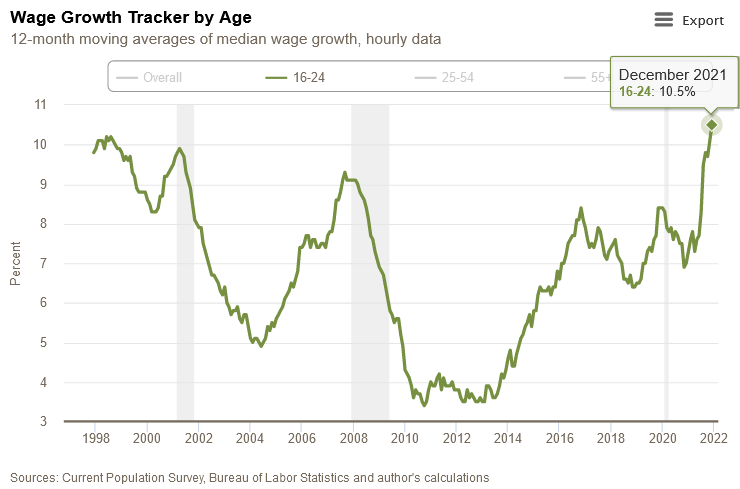
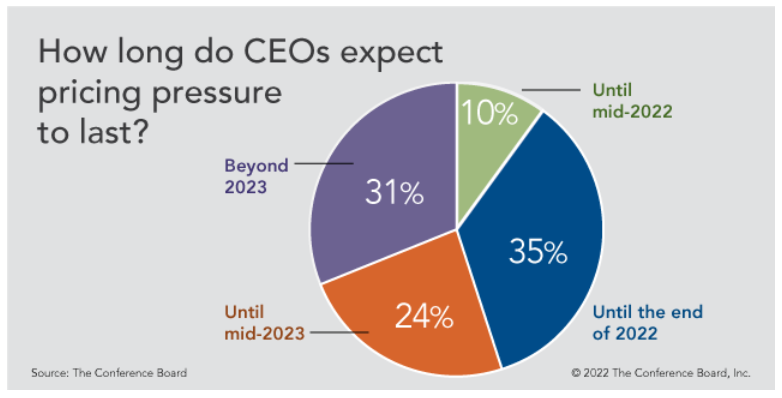
On top of that, The Confidence Board released its C-Suite Outlook 2022 report on Jan. 13. For context, the report asks CEOs about their expectations for growth, employment, and potential economic risks. While I warned for all of 2021 that inflation would prove more stubborn than investors thought, now, CEOs are showcasing heightened anxiety. The report revealed:
“At the start of 2021, inflation barely registered on CEOs’ radars. But as 2022 begins, inflation has soared to the top tier of concerns. Last year inflation ranked 22nd on CEOs’ worry list; it’s now risen to 2nd. What’s more, CEOs think rising prices are here to stay: 55 percent expect inflation to last into 2023 or longer.”
Please see below:
If that wasn’t enough, Philips – a global healthcare company specializing in medical devices and diagnostics – issued a profit warning on Jan. 12. While a product recall didn’t help, the firm flagged “intensified global supply chain shortages,” and CEO Frans van Houten said the following during the brief conference call:
“I don’t think that we have fully grasped the potential impact of Omicron as – I mean, people may not get very sick, but they all need to quarantine and leads to absenteeism and partly in Phillips, but more so I think with shipping companies and handling and drivers. And we’ve also seen that part of the supply issues that we talked about were related to shipping delays, port constraints, right? And, yeah, if something is two weeks longer in transit, actually, it’s hundreds of millions for us. So that also is part of the explanation of what happened in Q4.”
Finally, after U.S. retail sales disappointed on Jan. 14 – falling by 1.9% month-over-month (MoM) versus a decline of 0.1% expected – some investors assume that the weak print may give the Fed cause for pause. However, with depressed December data known to reverse sharply in January, another realization should keep the Fed on hawkish autopilot.
Please see below:
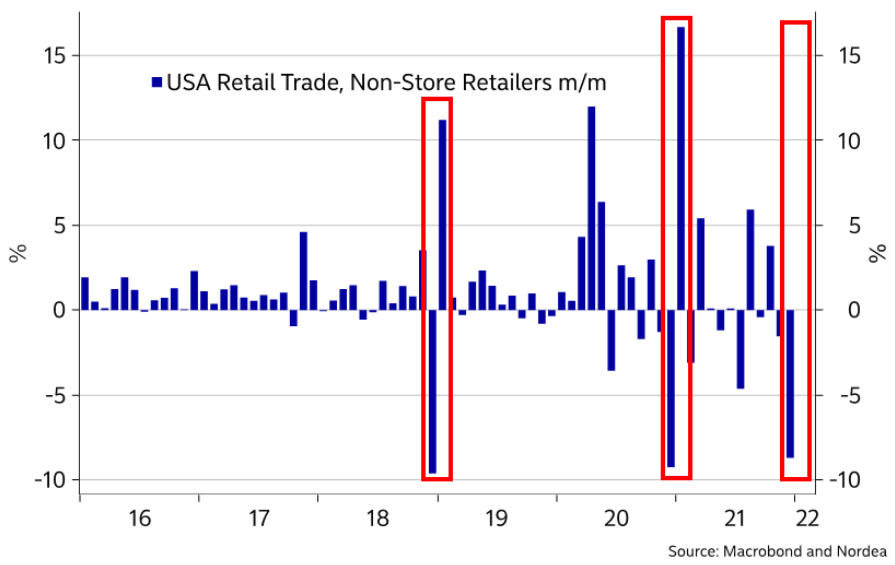
To explain, the blue bars above track the MoM percentage change in non-store (primarily online) retail sales. If you analyze the red rectangles in 2018 and 2020, you can see that sharp December decreases resulted in profound January increases. As a result, another positive re-enactment will likely materialize next month.
The bottom line? With inflation now accepted as far from “transitory,” the Fed can’t ignore the problem anymore. With market participants, CEOs, consumers, and employees noticing material increases in prices/wages, the financial markets are skittish for a good reason. Moreover, while the PMs were relatively relaxed amid the S&P 500’s sell-off on Jan. 18, higher real interest rates should shift sentiment over the medium term. As a result, while the PMs often ignore fundamental negatives for a few days or a week, don’t be surprised if more daily flash crashes materialize in the near future.
In conclusion, the PMs were mixed on Jan. 18, though, mining stocks were noticeable underperformers. While the general stock market is starting to fear the Fed’s wrath, the PMs should have the same trepidation. With the USD Index and U.S. Treasury yields seeking higher ground and the liquidity drain poised to intensify in the coming months, the PMs’ fundamental outlooks continue to deteriorate. Due to that, the weeks and months ahead will likely be unkind.
Overview of the Upcoming Part of the Decline
- It seems to me that the corrective upswing is over, and that gold, silver, and mining stocks are now likely to continue their medium-term decline.
- It seems that the first (bigger) stop for gold will be close to its previous 2021 lows, slightly below $1,700. Then it will likely correct a bit, but it’s unclear if I want to exit or reverse the current short position based on that – it depends on the number and the nature of the bullish indications that we get at that time.
- After the above-mentioned correction, we’re likely to see a powerful slide, perhaps close to the 2020 low ($1,450 - $1,500).
- If we see a situation where miners slide in a meaningful and volatile way while silver doesn’t (it just declines moderately), I plan to – once again – switch from short positions in miners to short positions in silver. At this time, it’s too early to say at what price levels this could take place, and if we get this kind of opportunity at all – perhaps with gold close to $1,600.
- I plan to exit all remaining short positions once gold shows substantial strength relative to the USD Index while the latter is still rallying. This may be the case with gold close to $1,350 - $1,400. I expect silver to fall the hardest in the final part of the move. This moment (when gold performs very strongly against the rallying USD and miners are strong relative to gold after its substantial decline) is likely to be the best entry point for long-term investments, in my view. This can also happen with gold close to $1,375, but at the moment it’s too early to say with certainty.
- As a confirmation for the above, I will use the (upcoming or perhaps we have already seen it?) top in the general stock market as the starting point for the three-month countdown. The reason is that after the 1929 top, gold miners declined for about three months after the general stock market started to slide. We also saw some confirmations of this theory based on the analogy to 2008. All in all, the precious metals sector is likely to bottom about three months after the general stock market tops.
- The above is based on the information available today, and it might change in the following days/weeks.
You will find my general overview of the outlook for gold on the chart below:
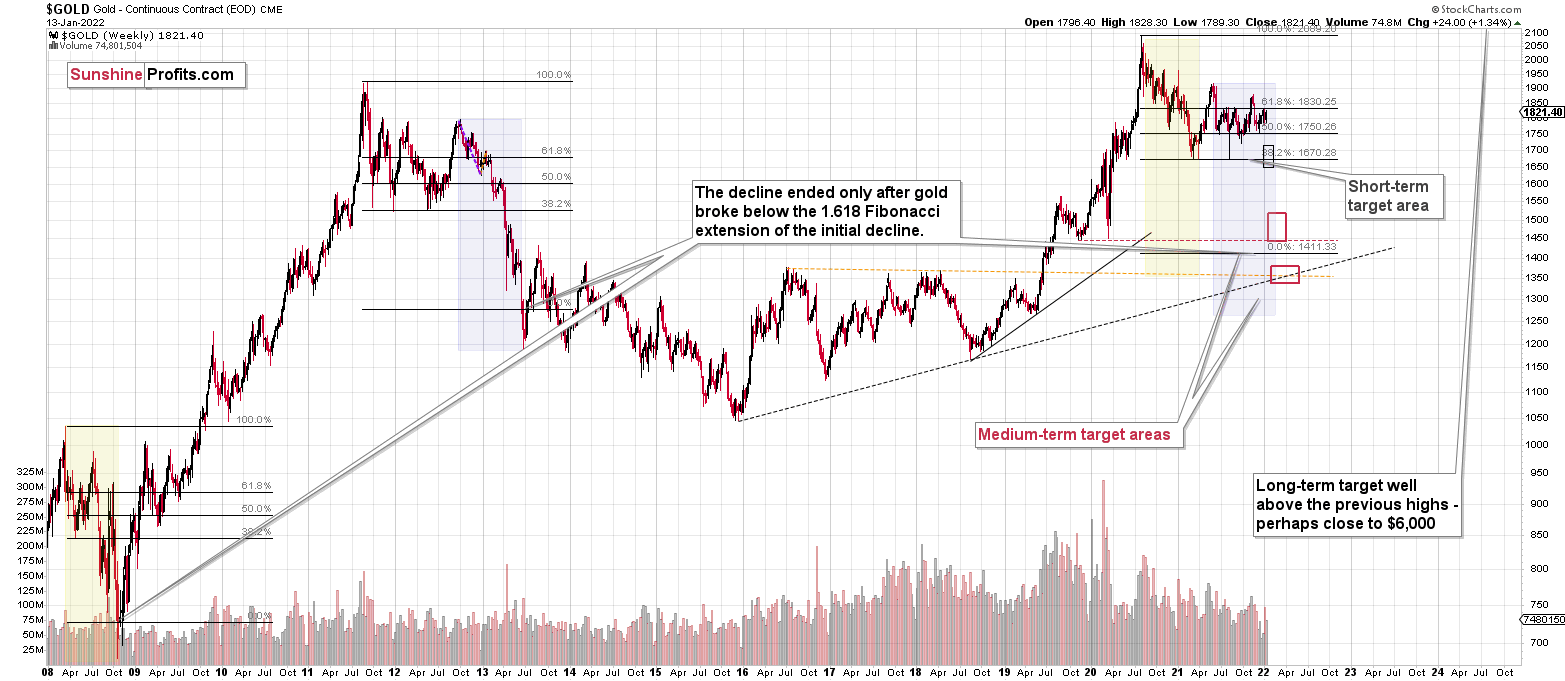
Please note that the above timing details are relatively broad and “for general overview only” – so that you know more or less what I think and how volatile I think the moves are likely to be – on an approximate basis. These time targets are not binding or clear enough for me to think that they should be used for purchasing options, warrants or similar instruments.
Summary
Summing up, it seems to me that the corrective upswing is over or very close to being over, and that gold, silver, and mining stocks are now likely to continue their medium-term decline (note: silver might continue to outperform and rally for a few more days – it’s practically impossible to tell how high it can go in the very near term, but either way, it’s likely that this decline will be reversed rather quickly). I continue to think that junior mining stocks are currently likely to decline the most out of all parts of the precious metals sector.
From the medium-term point of view, the key two long-term factors remain the analogy to 2013 in gold and the broad head and shoulders pattern in the HUI Index. They both suggest much lower prices ahead.
It seems that our profits from the short positions are going to become truly epic in the following months.
After the sell-off (that takes gold to about $1,350 - $1,500), I expect the precious metals to rally significantly. The final part of the decline might take as little as 1-5 weeks, so it's important to stay alert to any changes.
Most importantly, please stay healthy and safe. We made a lot of money last March and this March, and it seems that we’re about to make much more on the upcoming decline, but you have to be healthy to enjoy the results.
As always, we'll keep you - our subscribers - informed.
To summarize:
Trading capital (supplementary part of the portfolio; our opinion): Full speculative short positions (300% of the full position) in junior mining stocks are justified from the risk to reward point of view with the following binding exit profit-take price levels:
Mining stocks (price levels for the GDXJ ETF): binding profit-take exit price: $35.73; stop-loss: none (the volatility is too big to justify a stop-loss order in case of this particular trade)
Alternatively, if one seeks leverage, we’re providing the binding profit-take levels for the JDST (2x leveraged) and GDXD (3x leveraged – which is not suggested for most traders/investors due to the significant leverage). The binding profit-take level for the JDST: $16.18; stop-loss for the JDST: none (the volatility is too big to justify a SL order in case of this particular trade); binding profit-take level for the GDXD: $32.08; stop-loss for the GDXD: none (the volatility is too big to justify a SL order in case of this particular trade).
For-your-information targets (our opinion; we continue to think that mining stocks are the preferred way of taking advantage of the upcoming price move, but if for whatever reason one wants / has to use silver or gold for this trade, we are providing the details anyway.):
Silver futures downside profit-take exit price: $19.12
SLV profit-take exit price: $17.72
ZSL profit-take exit price: $41.38
Gold futures downside profit-take exit price: $1,683
HGD.TO – alternative (Canadian) inverse 2x leveraged gold stocks ETF – the upside profit-take exit price: $12.48
HZD.TO – alternative (Canadian) inverse 2x leveraged silver ETF – the upside profit-take exit price: $30.48
Long-term capital (core part of the portfolio; our opinion): No positions (in other words: cash
Insurance capital (core part of the portfolio; our opinion): Full position
Whether you already subscribed or not, we encourage you to find out how to make the most of our alerts and read our replies to the most common alert-and-gold-trading-related-questions.
Please note that we describe the situation for the day that the alert is posted in the trading section. In other words, if we are writing about a speculative position, it means that it is up-to-date on the day it was posted. We are also featuring the initial target prices to decide whether keeping a position on a given day is in tune with your approach (some moves are too small for medium-term traders, and some might appear too big for day-traders).
Additionally, you might want to read why our stop-loss orders are usually relatively far from the current price.
Please note that a full position doesn't mean using all of the capital for a given trade. You will find details on our thoughts on gold portfolio structuring in the Key Insights section on our website.
As a reminder - "initial target price" means exactly that - an "initial" one. It's not a price level at which we suggest closing positions. If this becomes the case (like it did in the previous trade), we will refer to these levels as levels of exit orders (exactly as we've done previously). Stop-loss levels, however, are naturally not "initial", but something that, in our opinion, might be entered as an order.
Since it is impossible to synchronize target prices and stop-loss levels for all the ETFs and ETNs with the main markets that we provide these levels for (gold, silver and mining stocks - the GDX ETF), the stop-loss levels and target prices for other ETNs and ETF (among other: UGL, GLL, AGQ, ZSL, NUGT, DUST, JNUG, JDST) are provided as supplementary, and not as "final". This means that if a stop-loss or a target level is reached for any of the "additional instruments" (GLL for instance), but not for the "main instrument" (gold in this case), we will view positions in both gold and GLL as still open and the stop-loss for GLL would have to be moved lower. On the other hand, if gold moves to a stop-loss level but GLL doesn't, then we will view both positions (in gold and GLL) as closed. In other words, since it's not possible to be 100% certain that each related instrument moves to a given level when the underlying instrument does, we can't provide levels that would be binding. The levels that we do provide are our best estimate of the levels that will correspond to the levels in the underlying assets, but it will be the underlying assets that one will need to focus on regarding the signs pointing to closing a given position or keeping it open. We might adjust the levels in the "additional instruments" without adjusting the levels in the "main instruments", which will simply mean that we have improved our estimation of these levels, not that we changed our outlook on the markets. We are already working on a tool that would update these levels daily for the most popular ETFs, ETNs and individual mining stocks.
Our preferred ways to invest in and to trade gold along with the reasoning can be found in the how to buy gold section. Furthermore, our preferred ETFs and ETNs can be found in our Gold & Silver ETF Ranking.
As a reminder, Gold & Silver Trading Alerts are posted before or on each trading day (we usually post them before the opening bell, but we don't promise doing that each day). If there's anything urgent, we will send you an additional small alert before posting the main one.
Thank you.
Przemyslaw Radomski, CFA
Founder, Editor-in-chief

