

Briefly: in our opinion, full (300% of the regular position size) speculative short positions in junior mining stocks are justified from the risk/reward point of view at the moment of publishing this Alert.
You will find my latest comments on today’s pre-market price moves in the below video:
Moreover, since today is the day when a new bitcoin ETF is being launched, I decided to comment on it in a separate video, as it seems similar to something that we already saw in the past… in silver. And it wasn’t pretty.
Having said that, let’s move to a more fundamental take on the markets.
The Dollar Story
With a tug-of-war for USD Index supremacy unfolding at the 94 level, the PMs are anxiously awaiting the final outcome. And because the EUR/USD is the head of the dollar basket’s snake – due to the fact that the currency pair accounts for nearly 58% of the USD Index’s movement – confusion has arisen over why the euro is strengthening when its fundamental prospects are so weak.
Well, with short-term bursts of optimism par for the course, it’s important to remember that asset prices rarely move in a straight line. Moreover, when analyzed in the context of the EUR/USD’s YTD performance, the recent uptick is largely immaterial.
Please see below:
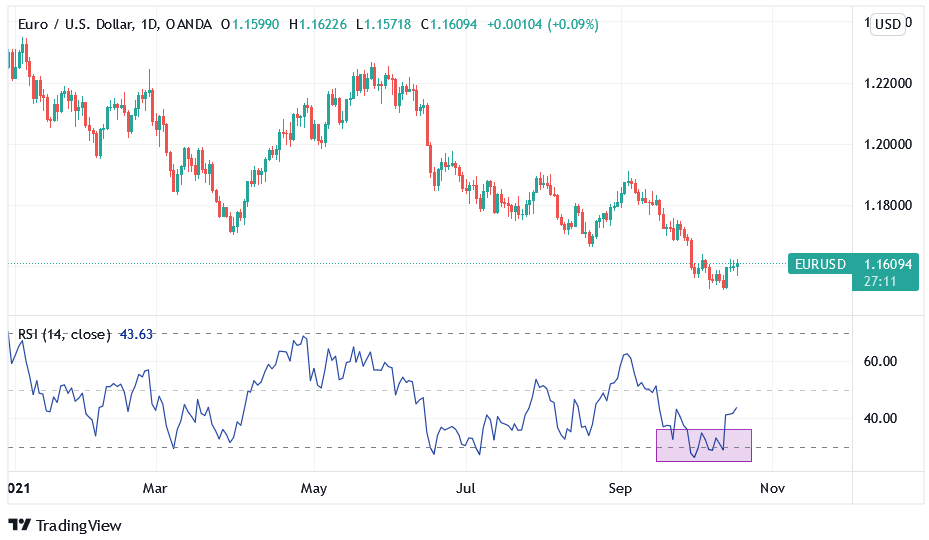
To explain, the candlestick chart above tracks the EUR/USD’s YTD movement. And with each enthusiastic rally eventually thwarted by fundamental realities, euro bulls have suffered mightily in 2021.
More importantly, though, if you analyze the shaded purple box on the bottom half of the chart, you can see that the EUR/USD’s RSI (Relative Strength Index) dipped below 30 (oversold conditions) and triggered a relief rally. Likewise, while similar oversold bounces occurred earlier in 2021, lower lows have plagued the currency pair throughout the year anyway. As a result, the small uptick has done nothing to dent our bearish medium-term (!) fundamental thesis for gold and silver.
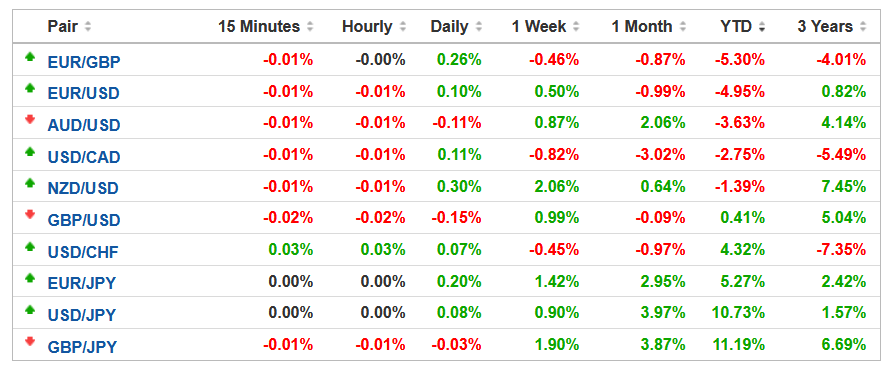
To that point, the euro is the third-worst-performing currency within the USD Index YTD. For context, the SEK (not listed below) is the second-worst performer, but the USD/SEK only accounts for 4.2% of the USD Index’s movement.
Please see below:
 Source: Investing.com
To explain, if you analyze the column above labeled “YTD,” you can see that the EUR/USD has declined by 4.95% in 2021. Moreover, the USD/JPY (13.6% of the USD Index’s movement) holds the top spot, with the currency pair appreciating by 10.73% and implying that the JPY has depreciated by roughly 10% versus the U.S. dollar.
Furthermore, with the Fed poised to announce its taper timeline at its Nov. 2/3 policy meeting, and the ECB running in the opposite direction, a sharp decline in the Fed/ECB ratio should weigh on the EUR/USD over the medium term. For context, the Fed/ECB ratio has already declined by 3.75% in 2021.
To explain, I wrote on Oct. 15:
The Fed/ECB ratio – which measures the relative money printing of the two central banks – stands at roughly 1.02. And since 2015, if we exclude the EUR/USD’s outlier strength in 2017-2018, when the Fed/ECB ratio sunk below 1, the EUR/USD spent most of its time in the 1.100 to 1.150 range. Moreover, when the Fed/ECB ratio sunk to an all-time low of 0.81 in September 2019, the EUR/USD closed the week at 1.1029.
Please see below:
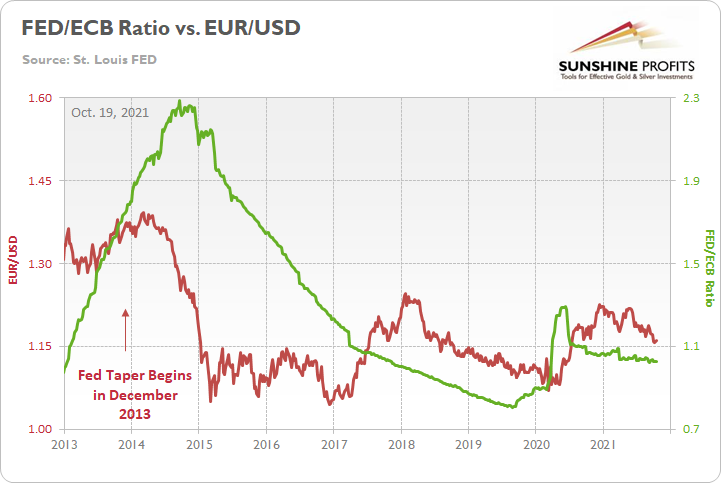
To explain, the red line above tracks the EUR/USD, while the green line above tracks the Fed/ECB ratio. If you focus your attention on the left side of the chart, the red arrow depicts when the Fed began reducing its bond-buying program in 2013. Moreover, if you analyze the performance of both variables, you can see that the EUR/USD fell off a cliff soon after and the Fed/ECB ratio plunged after a roughly 12-month delay.
However, unlike in 2013, this time around, the Fed/ECB ratio should decline immediately. And with the ratio likely to fall materially throughout 2022, the EUR/USD (excluding the abnormal strength that we witnessed in 2017-2018) has been unable to record lasting rallies when the ECB is outprinting the Fed. As a result, 1.1500 should break over the medium term, and assuming that the Fed/ECB ratio approaches its all-time low, the EUR/USD’s fair value likely lies in the 1.100 to 1.1250 range.
Circling back to the currency pairs’ performance chart, the GBP (11.9% of the USD Index’s movement) and the CAD (9.1% of the USD Index’s movement) have actually strengthened versus the U.S. dollar in 2021. For context, like the USD/JPY, the USD/CAD uses the U.S. dollar as the base currency and a YTD decline means that the Canadian dollar has strengthened.
What Do You Say, Canada?
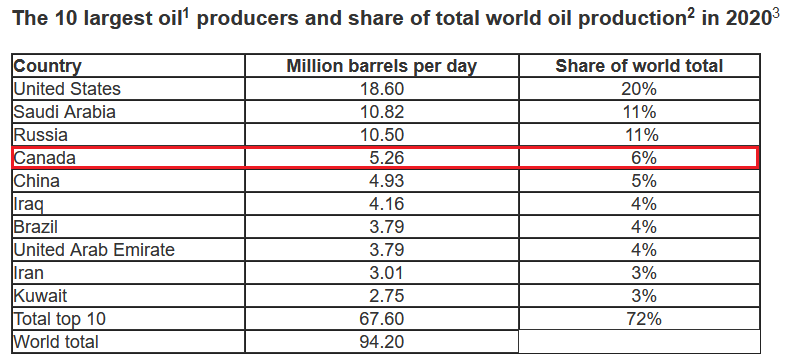
To that point, while the Bank of England has turned hawkish and potential interest rate hikes put a fundamental floor under the GBP, the CAD is a different story. To explain, Canada is the fourth-largest oil-producing country in the world, and with WTI gunning for its ninth-straight week of weekly gains, rising oil prices have uplifted the Canadian dollar.
Please see below:
 Source: the U.S. Energy Information Administration (EIA)
Conversely, while crude’s fervor is bullish for the Canadian dollar and bearish for the USD/CAD, a continuation of the theme is mutually exclusive to the Fed’s 2% inflation goal.
To explain, I wrote on Sep. 30:
Powell’s only hope to curb inflation is to strengthen the U.S. dollar and weaken commodity prices. For context, major futures contracts are priced in U.S. dollars. And when the dollar rallies, it’s more expensive for foreign buyers (in their currency) to purchase the underlying commodities. As a result, a stronger U.S. dollar often stifles demand. And with the current supply/demand dynamics favoring higher commodity prices, Powell will have to work his magic, strengthen the dollar and reduce commodities demand if he wants his inflation problem to subside.
Please see below:
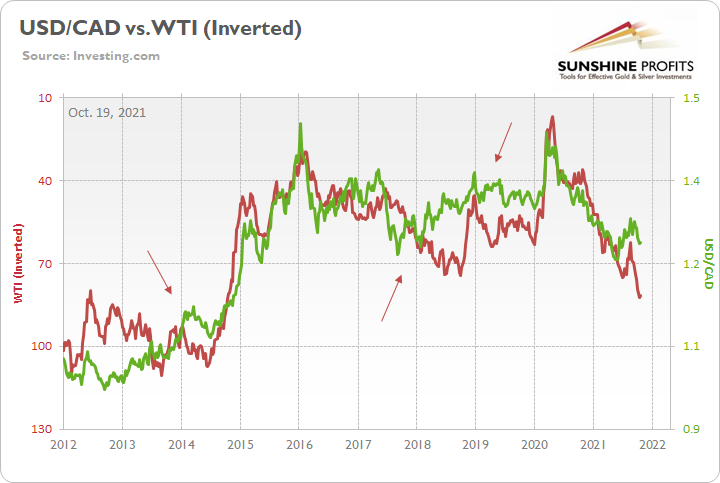
To explain, the green line above tracks the USD/CAD, while the red line above tracks the inverted WTI futures price. For context, inverted means that the latter’s scale is flipped upside down, and that a rising red line represents falling crude prices, while a falling red line represents rising crude prices. If you analyze the relationship, you can see that a stronger USD/CAD often stifles WTI’s bull markets.
To that point, if you focus your attention on the three red arrows, you can see that when the WTI rallied alongside the USD/CAD, the divergences ended with crude oil reversing sharply within three to nine months. As a result, with the Fed no longer ‘all in’ on “transitory” and a November taper announcement likely a done deal, the central bank needs the green line to rise to help calm the inflationary pressures. Thus, with a stronger USD/CAD poised to help Powell achieve his goal, his days of talking down the U.S. dollar are likely over.
As further evidence, the chart below demonstrates how the entire commodities complex makes a living off of a weaker U.S. dollar.
Please see below:
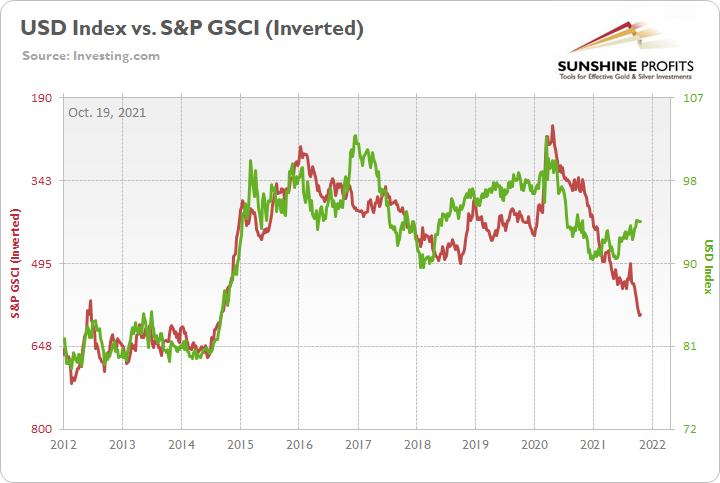
To explain, the green line above tracks the USD Index, while the red line above tracks the inverted S&P Goldman Sachs Commodity Index (S&P GSCI). For context, the S&P GSCI contains 24 commodities from all sectors: six energy products, five industrial metals, eight agricultural products, three livestock products and two precious metals. However, energy accounts for roughly 54% of the index’s movement.
If you analyze the relationship, you can see that a stronger USD Index often curbs commodity inflation. And while the S&P GSCI has surged in recent weeks, even as the USD Index has strengthened, the relationship has stood the test of time — the sharp rally (plunge) in the USD Index (S&P GSCI) in 2014-2015 is a cautionary tale of how quickly things can change.
The bottom line? If Powell allows the U.S. dollar to weaken, his inflationary problem will only intensify. Thus, not only does the greenback have technicals, fundamentals and sentiment (speculative futures positioning) on its side, but the Fed will likely become the U.S. dollar’s staunchest ally. And unless Fed officials want to see 6% and 7% year-over-year prints on the headline Consumer Price Index (CPI), their days of playing ‘PMs up, USD Index down’ are likely over.
In conclusion, the PMs traded in the red on Oct. 18 as U.S. Treasury yields rallied across much of the curve. And while the EUR/USD has strengthened in recent days, lower lows should still materialize over the medium term. Moreover, with the Fed’s taper announcement likely to commence in the coming weeks, the forthcoming liquidity drain is fundamentally bullish for the U.S. dollar. And with the PMs often moving in the opposite direction, a stronger greenback will likely weigh on the PMs’ performance over the next few months.
Overview of the Upcoming Part of the Decline
- It seems to me that the current corrective upswing in gold is over, and the next short-term move lower is about to begin. Since it seems to be another short-term move more than it seems to be a continuation of the bigger decline, I think that junior miners would be likely to (at least initially) decline more than silver.
- It seems that the first stop for gold will be close to its previous 2021 lows, slightly below $1,700. Then it will likely correct a bit, but it’s unclear if I want to exit or reverse the current short position based on that – it depends on the number and the nature of the bullish indications that we get at that time.
- After the above-mentioned correction, we’re likely to see a powerful slide, perhaps close to the 2020 low ($1,450 - $1,500).
- If we see a situation where miners slide in a meaningful and volatile way while silver doesn’t (it just declines moderately), I plan to – once again – switch from short positions in miners to short positions in silver. At this time, it’s too early to say at what price levels this could take place, and if we get this kind of opportunity at all – perhaps with gold close to $1,600.
- I plan to exit all remaining short positions when gold shows substantial strength relative to the USD Index while the latter is still rallying. This might take place with gold close to $1,350 - $1,400. I expect silver to fall the hardest in the final part of the move. This moment (when gold performs very strongly against the rallying USD and miners are strong relative to gold after its substantial decline) is likely to be the best entry point for long-term investments, in my view. This might also happen with gold close to $1,375, but it’s too early to say with certainty at this time. I expect the final bottom to take place near the end of the year, perhaps in mid-December.
- As a confirmation for the above, I will use the (upcoming or perhaps we have already seen it?) top in the general stock market as the starting point for the three-month countdown. The reason is that after the 1929 top, gold miners declined for about three months after the general stock market started to slide. We also saw some confirmations of this theory based on the analogy to 2008. All in all, the precious metals sector is likely to bottom about three months after the general stock market tops.
- The above is based on the information available today, and it might change in the following days/weeks.
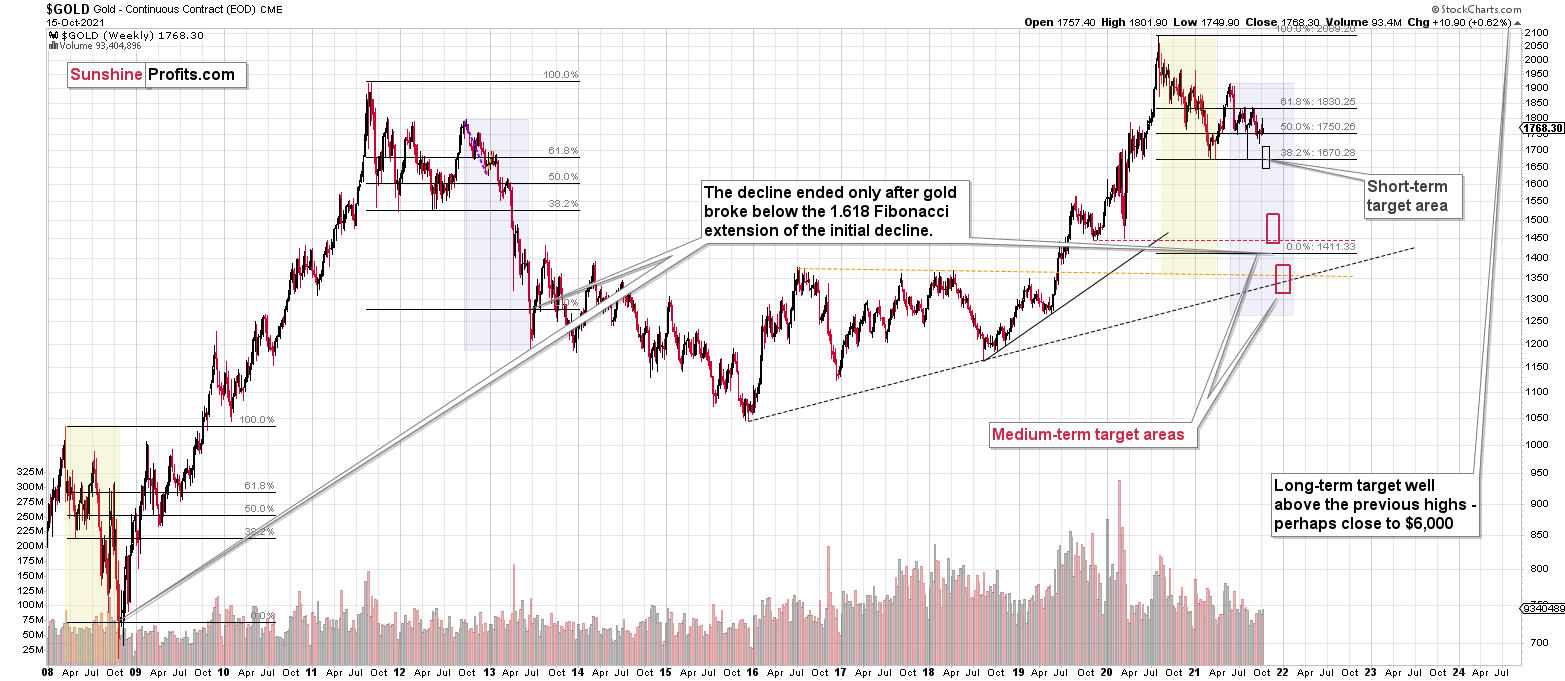
You will find my general overview of the outlook for gold on the chart below:
Please note that the above timing details are relatively broad and “for general overview only” – so that you know more or less what I think and how volatile I think the moves are likely to be – on an approximate basis. These time targets are not binding or clear enough for me to think that they should be used for purchasing options, warrants or similar instruments.
Summary
To summarize, the outlook for the precious metals sector remains extremely bearish for the next few months. Since it seems that the PMs are starting another short-term move lower more than it seems that they are continuing their bigger decline, I think that junior miners would be likely to (at least initially) decline more than silver.
From the medium-term point of view, the key two long-term factors remain the analogy to 2013 in gold and the broad head and shoulders pattern in the HUI Index. They both suggest much lower prices ahead.
It seems that our profits from the short positions are going to become truly epic in the following months.
After the sell-off (that takes gold to about $1,350 - $1,500), I expect the precious metals to rally significantly. The final part of the decline might take as little as 1-5 weeks, so it's important to stay alert to any changes.
Most importantly, please stay healthy and safe. We made a lot of money last March and this March, and it seems that we’re about to make much more on the upcoming decline, but you have to be healthy to enjoy the results.
As always, we'll keep you - our subscribers - informed.
By the way, we’re currently providing you with the possibility to extend your subscription by a year, two years, or even three years with a special 20% discount. This discount can be applied right away, without the need to wait for your next renewal – if you choose to secure your premium access and complete the payment upfront. The boring time in the PMs is definitely over, and the time to pay close attention to the market is here. Naturally, it’s your capital, and the choice is up to you, but it seems that it might be a good idea to secure more premium access now while saving 20% at the same time. Our support team will be happy to assist you in the above-described upgrade at preferential terms – if you’d like to proceed, please contact us.
To summarize:
Trading capital (supplementary part of the portfolio; our opinion): Full speculative short positions (300% of the full position) in junior mining stocks are justified from the risk to reward point of view with the following binding exit profit-take price levels:
Mining stocks (price levels for the GDXJ ETF): binding profit-take exit price: $35.73; stop-loss: none (the volatility is too big to justify a stop-loss order in case of this particular trade)
Alternatively, if one seeks leverage, we’re providing the binding profit-take levels for the JDST (2x leveraged) and GDXD (3x leveraged – which is not suggested for most traders/investors due to the significant leverage). The binding profit-take level for the JDST: $16.18; stop-loss for the JDST: none (the volatility is too big to justify a SL order in case of this particular trade); binding profit-take level for the GDXD: $32.08; stop-loss for the GDXD: none (the volatility is too big to justify a SL order in case of this particular trade).
For-your-information targets (our opinion; we continue to think that mining stocks are the preferred way of taking advantage of the upcoming price move, but if for whatever reason one wants / has to use silver or gold for this trade, we are providing the details anyway.):
Silver futures downside profit-take exit price: $19.12
SLV profit-take exit price: $17.72
ZSL profit-take exit price: $41.38
Gold futures downside profit-take exit price: $1,683
HGD.TO – alternative (Canadian) inverse 2x leveraged gold stocks ETF – the upside profit-take exit price: $12.48
Long-term capital (core part of the portfolio; our opinion): No positions (in other words: cash
Insurance capital (core part of the portfolio; our opinion): Full position
Whether you already subscribed or not, we encourage you to find out how to make the most of our alerts and read our replies to the most common alert-and-gold-trading-related-questions.
Please note that we describe the situation for the day that the alert is posted in the trading section. In other words, if we are writing about a speculative position, it means that it is up-to-date on the day it was posted. We are also featuring the initial target prices to decide whether keeping a position on a given day is in tune with your approach (some moves are too small for medium-term traders, and some might appear too big for day-traders).
Additionally, you might want to read why our stop-loss orders are usually relatively far from the current price.
Please note that a full position doesn't mean using all of the capital for a given trade. You will find details on our thoughts on gold portfolio structuring in the Key Insights section on our website.
As a reminder - "initial target price" means exactly that - an "initial" one. It's not a price level at which we suggest closing positions. If this becomes the case (like it did in the previous trade), we will refer to these levels as levels of exit orders (exactly as we've done previously). Stop-loss levels, however, are naturally not "initial", but something that, in our opinion, might be entered as an order.
Since it is impossible to synchronize target prices and stop-loss levels for all the ETFs and ETNs with the main markets that we provide these levels for (gold, silver and mining stocks - the GDX ETF), the stop-loss levels and target prices for other ETNs and ETF (among other: UGL, GLL, AGQ, ZSL, NUGT, DUST, JNUG, JDST) are provided as supplementary, and not as "final". This means that if a stop-loss or a target level is reached for any of the "additional instruments" (GLL for instance), but not for the "main instrument" (gold in this case), we will view positions in both gold and GLL as still open and the stop-loss for GLL would have to be moved lower. On the other hand, if gold moves to a stop-loss level but GLL doesn't, then we will view both positions (in gold and GLL) as closed. In other words, since it's not possible to be 100% certain that each related instrument moves to a given level when the underlying instrument does, we can't provide levels that would be binding. The levels that we do provide are our best estimate of the levels that will correspond to the levels in the underlying assets, but it will be the underlying assets that one will need to focus on regarding the signs pointing to closing a given position or keeping it open. We might adjust the levels in the "additional instruments" without adjusting the levels in the "main instruments", which will simply mean that we have improved our estimation of these levels, not that we changed our outlook on the markets. We are already working on a tool that would update these levels daily for the most popular ETFs, ETNs and individual mining stocks.
Our preferred ways to invest in and to trade gold along with the reasoning can be found in the how to buy gold section. Furthermore, our preferred ETFs and ETNs can be found in our Gold & Silver ETF Ranking.
As a reminder, Gold & Silver Trading Alerts are posted before or on each trading day (we usually post them before the opening bell, but we don't promise doing that each day). If there's anything urgent, we will send you an additional small alert before posting the main one.
Thank you.
Przemyslaw Radomski, CFA
Founder, Editor-in-chief

