

Briefly: in our opinion, full (250% of the regular size of the position) speculative short positions in gold, silver and mining stocks are justified from the risk/reward perspective at the moment of publishing this Alert.
Gold and silver declined only a bit yesterday, while the USD Index moved visibly higher and while the end of the session for the mining stocks was not particularly encouraging, the initial hours of the session took the GDX ETF above its October highs. Did this early strength in the miners just confirm the bullish outlook for gold?
Absolutely not. It is the reversal and the invalidation of this small breakout above the October highs that matter, not the fact that there were higher prices in the early part of the session. And there is even rather disappointing (from gold bull’s point of view) explanation for this initial strength.
You see, exchanges have limits and rules that are in place to make the trading more efficient and one of these rules was in effect with regard to one of the popular precious metals ETFs. The ETF is JDST – the instrument used for profiting on declines in the junior gold and silver miners (mostly gold juniors – the index on which this instrument is based is at least 80% in gold juniors, and silver juniors take up no more than 20% thereof). The rule is the Rule 201 a.k.a. “the alternative uptick rule”. You can read more about this rule in this SEC article. The long story short is that if a given stock (or ETF/ETN as they are treated as stocks in this case) declines more than 10% on a given day, its short-selling on it becomes restricted for a few days. Without going into even greater details, this often interrupts the decline. This rule was triggered for the JDST and DUST was quite close to triggering it.
Consequently, the odds are that these instruments would have declined more on Friday if it wasn’t for this rule. Many people prefer to use these instruments (due to their leverage and ease of making transactions) instead of using the regular, non-leveraged ETFs, so part of the demand for the underlying equities (and for related short positions) comes from them. Since that demand was limited, the stocks didn’t move more and thus the non-leveraged ETFs (like GDX) and other indices didn’t move more either. It doesn’t have to be the case that things worked as described above, but it’s quite likely.
What does the above have to do with miners’ performance in the initial part of yesterday’s session? If people stopped trading or limited it based on the above mechanism on Friday, but they still wanted to place more bets on miners’ increase, then this demand didn’t disappear – it was delayed to Monday’s session. Therefore, the initial rally that we witnessed yesterday could have been nothing more than the rest of Friday’s demand. The demand from buyers that were overwhelmed by sellers before the end of the session.
From the fundamental point of view, the initial strength was therefore not bullish, but rather normal. From the technical point of view, we saw an invalidation of a breakout above the previous high, which is a very bearish development for the short term.
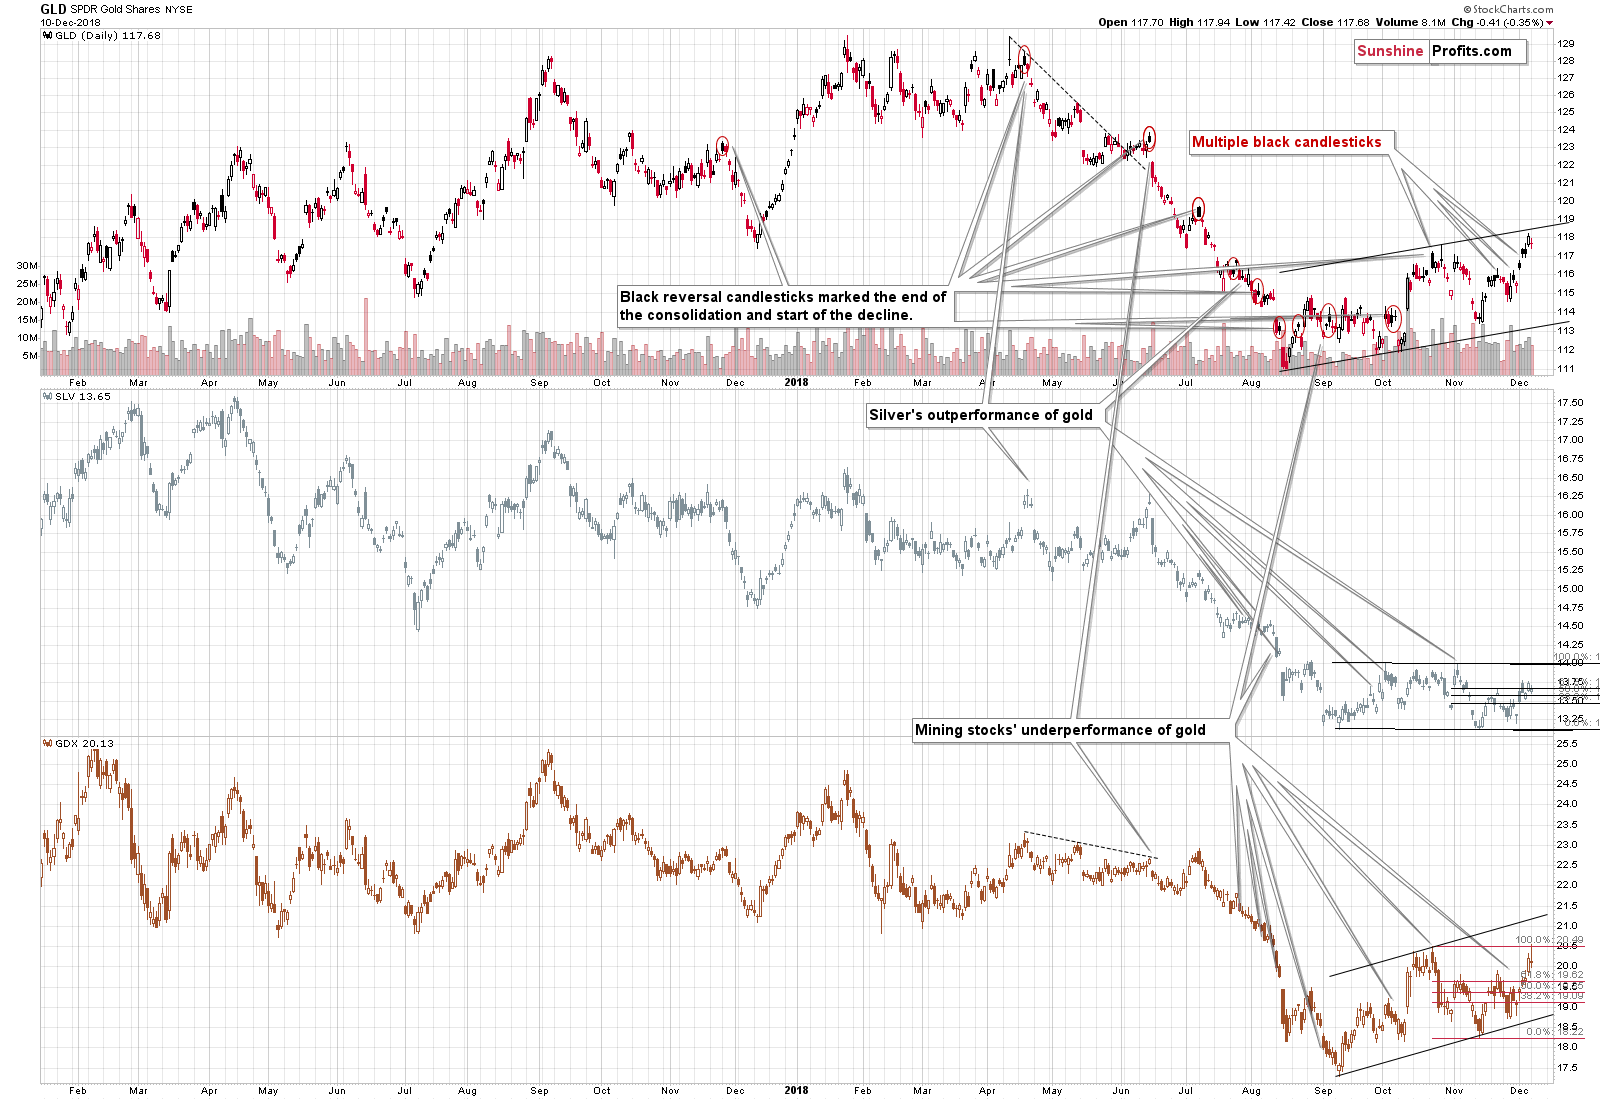
The above chart shows the reversal in the miners and the invalidation of the tiny breakout as well as the recent lack of strength in silver.
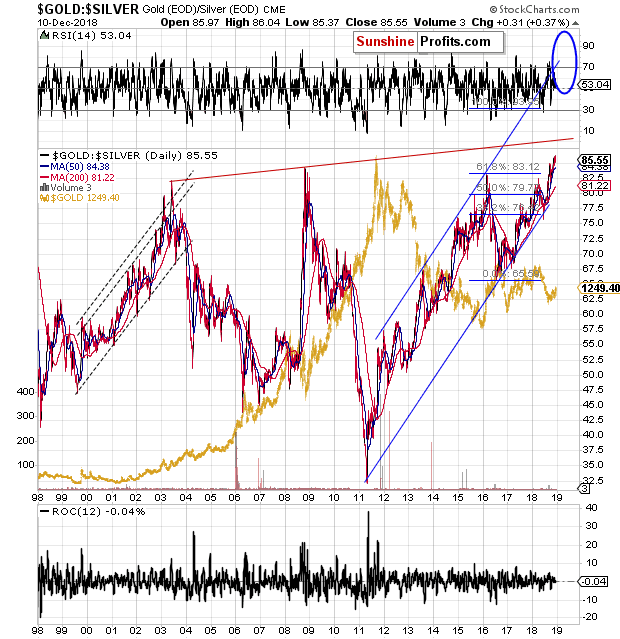
The latter is not surprising, because of the recent breakout in the gold to silver ratio. The breakout is confirmed, so we should expect more strength in it. This means more weakness in silver relative to gold. There may be exceptions to this rule at the very end of short-term upswings, but they don’t have to take place at all.
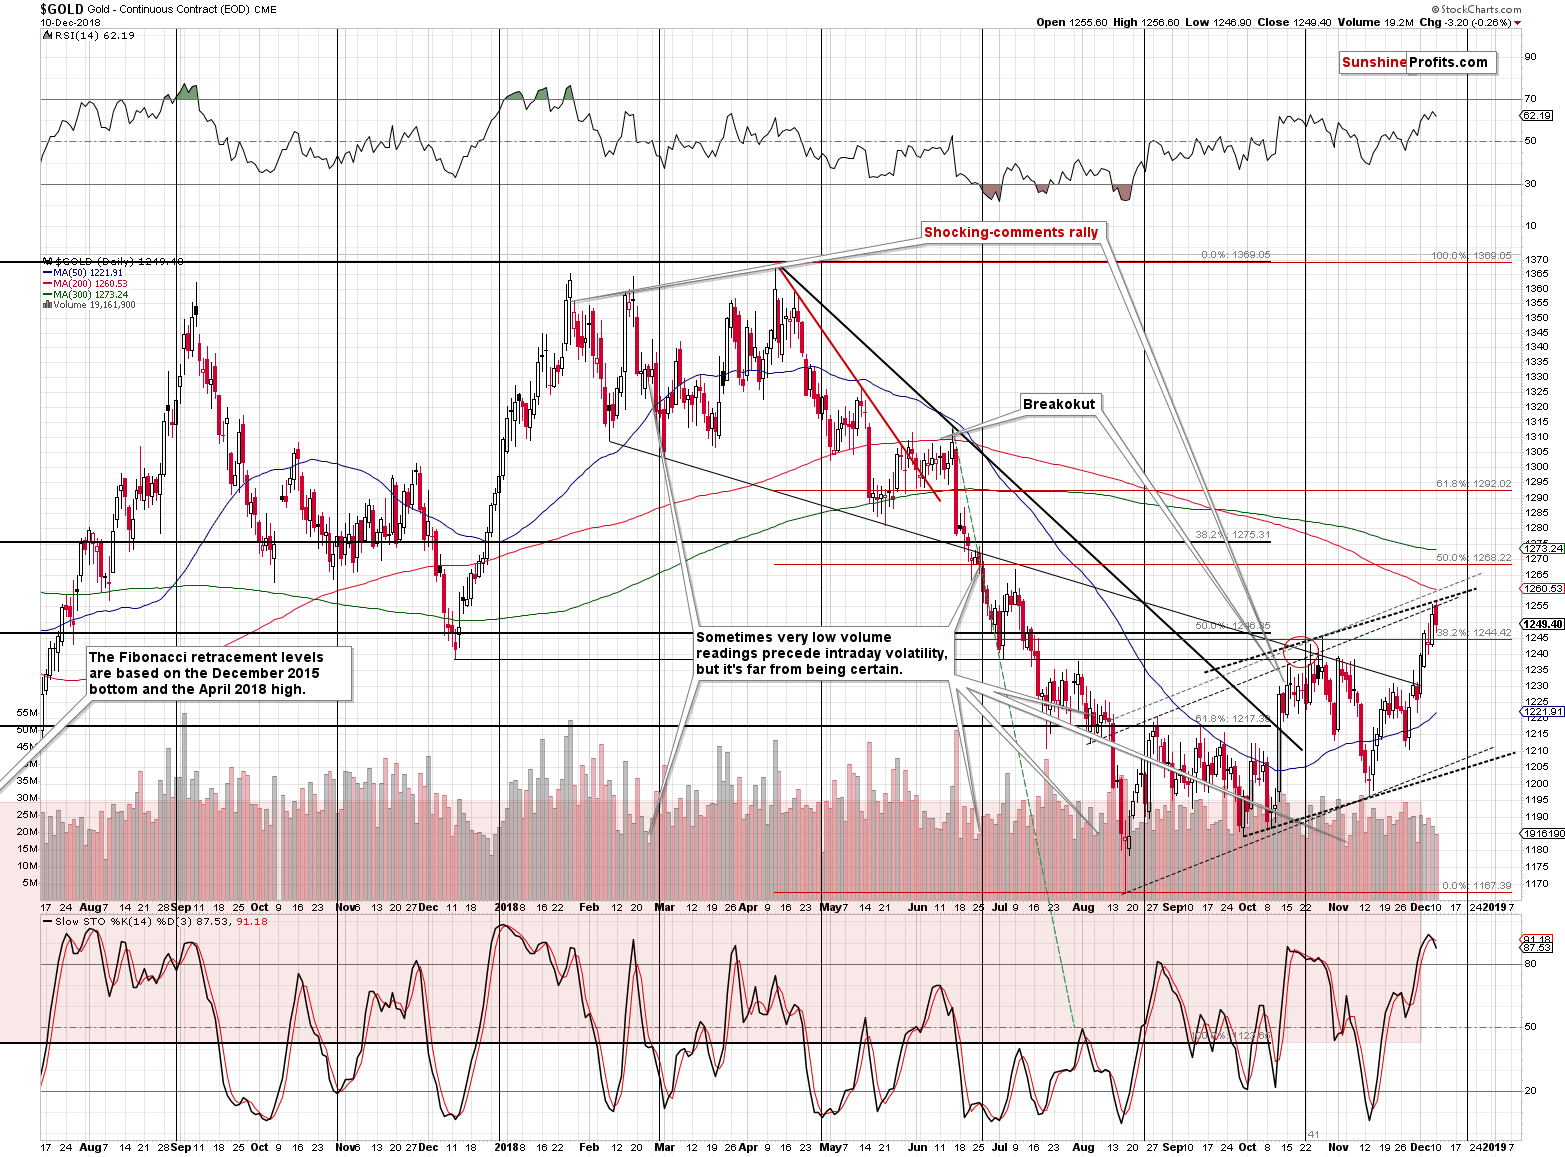
Moving our focus to gold, we see that the yellow metal reversed after moving to the upper border of the rising trend channel. We also see that the sell signal from the Stochastic indicator is now much clearer. This means that the implications are bearish and that our yesterday’s comments on the above chart remain up-to-date:
Gold also moved above the October highs, but that’s not a new development. It wasn’t accompanied by a strong or rising volume either. What also happened was that gold moved to the upper border of the rising trend channel (line that’s parallel to the line based on the previous lows) and then reversed. In fact, that happened with regard to two trend channels (thick and thin black, dashed lines). This is not a reason for gold to rally, but to decline.
Please note that there is also an additional way to draw the upper border of the rising trend channel that is based on the late-October high. In this case, the resistance is at about $1,260. Even if gold reaches this level, it will not change much from the technical point of view.
The situation in the indicators also supports the above-mentioned outcome. The RSI is at the levels at which it was in late March and early April – when the previous big decline started. The Stochastic indicator shows a tiny (but still) sell signal at very overbought levels. This is a bearish combination.
Before summarizing, we would like to discuss the recent changes in the USD Index.
USD Index: Self-similarity and Link with Gold
Before providing our comments on yesterday’s price changes, it seems to be a good idea to provide the context. We’ll do it by quoting some of our yesterday’s analysis:
The outlook for the USD Index did not change based on Friday’s relatively small decline. Yes, that was the lowest daily close in 2 weeks, but the thing that matters is that we saw a breakdown below only one support line and it was just one daily close below it. This means that it’s not confirmed and thus not particularly meaningful at this time. The breakdown was below the rising red dashed line. The more short-term, solid, black line and the more long-term, dashed, blue line were not touched, let alone broken.
(…)
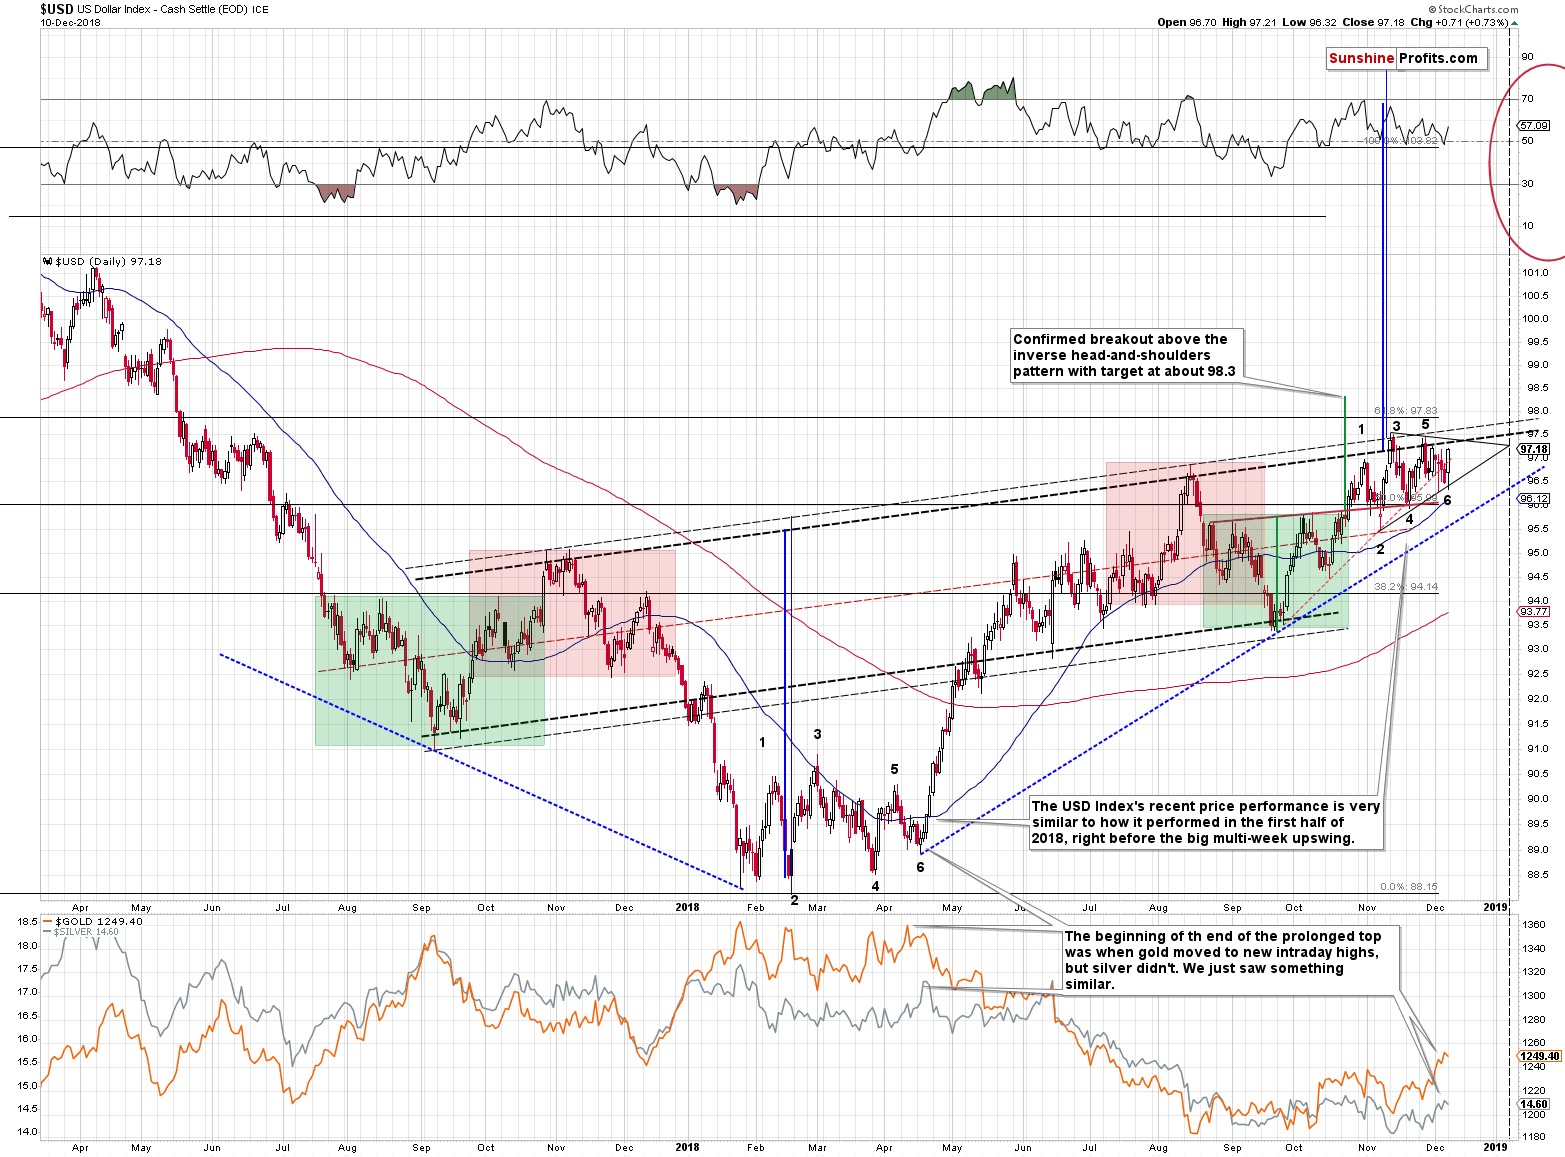
The situation in the USD Index has been developing in a very interesting manner recently. The USD Index has been following reflective pattern, where the 2017-2018 decline was reflected in the shape of the 2018 rally. The areas marked with red and green show similar patterns (head-and-shoulders and inverse head-and-shoulders patterns).
However, in the last few weeks, the pattern is somewhat unclear. While the move preceding the entire pattern (the decline up to July 2017) was an almost a straight line lower, the current price moves take form of a consolidation. The start of the pattern was quick, but the end of the pattern is prolonged. Why would that be?
It looks like if someone (or several investors / institutions / central banks) really doesn’t want to let the USDX to break above the neck level of the inverse head-and-shoulders pattern. The pattern is big and clear, and it’s quite obvious that breaking above the neck level thereof would very likely result in much higher USDX values. We have no proof that this is indeed the case, but it certainly looks that way – whenever the price moves close to the neckline, the USD gets pushed lower. It rallies again, and it gets hammered again. And again. The situation becomes very tense, like a coiled spring, and once the USDX finally breaks out, it’s likely to rally fast. After all, the market forces always prevail in the end.
Putting the “why” behind the price moves aside, let’s take a look at something that would be important even if the “why” behind the recent back-and-forth trading was entirely different.
The shape of the recent sideways trading is very similar to what we saw in the first half of the year, when the USD Index was bottoming. We marked the subsequent tops and bottoms with numbers from 1 to 6. The top number 3 was the highest one in both cases and all lows were higher than the previous ones.
The most interesting thing is that the similarity doesn’t end with the USD Index. It was the time when gold moved a bit above its previous high in intraday terms, while silver didn’t. It was also the time when the mining stocks underperformed gold in a visible way. We have exactly the same thing right now. The implications are bullish for the USD Index, and they are even more bearish for the PMs than they are bullish for the USDX.
(…) the highs #3 and #5 along with lows #2 and #6 form a triangle that has vertex in the first half of January, 2019. Consequently, we’re quite likely to see some kind of reversal close to January 7th, 2019.
We would like to supplement the above with another detail that further confirms the similarity between the recent back-and-forth trading and the early 2018 bottom. Please take a look at the shapes of each of the #2, #4, and #6 bottoms.
In both cases #2 bottom was volatile, the price ended above the intraday low, and the daily reversal was followed by a sharp upswing.
In both cases #4 bottom was characterized by a daily close near the intraday low and it was followed by a quick rally that was not as big as the one that followed the #2 bottom.
In both cases #6 bottom took form of a double bottom.
The similarity is undeniable. The implications are very bullish for the USD Index.
However, the implications are even more bearish for the precious metals market because of the paragraph that we put in bold above. Gold moved higher in the recent weeks despite the back-and-forth trading in the USDX. This appears bullish at the first sight, but it’s important to note that this was also the case between mid-March and mid-April. This would have not been so important if it wasn’t for the clear self-similarity in the USD Index. It’s not only in the USD – it’s also in the way gold reacts to USD’s changes.
And you know what? Gold mostly ignored USD’s strength after the #6 bottom in April, so it’s not surprising or bearish that it didn’t plunge yesterday despite a decent upswing in the US currency. It took a few days for the precious metals investors to catch up with the new reality, which was rallying USD Index. And it was THE rally of the year (at least so far). It was also what preceded THE decline of the year (at least so far) in the precious metals. Is the gold-USD link at this time really bullish for the yellow metal? No, it’s not. The investors and traders are likely to catch up with their reaction once it becomes apparent that the USD Index is really moving higher, and not topping here. Good news is that this should take place right now or shortly.
Summary
Summing up, yesterday’s early strength in the mining stocks is not a bullish factor, but the daily reversal is a bearish one, and the recent performance of gold relative to the USD Index is quite in tune with what preceded the biggest decline of this year. The outlook for the precious metals market remains very bearish for the following weeks and months and short position remains justified from the risk to reward point of view, even if we see a few extra days of back and forth trading or even a small brief upswing. There is a very high probability of a huge downswing that makes the short position justified, not the outlook for the next few days.
As always, we’ll keep you – our subscribers – informed.
To summarize:
Trading capital (supplementary part of the portfolio; our opinion): Full short positions (250% of the full position) in gold, silver and mining stocks are justified from the risk/reward perspective with the following stop-loss orders and exit profit-take price levels:
- Gold: profit-take exit price: $1,062; stop-loss: $1,272; initial target price for the DGLD ETN: $82.96; stop-loss for the DGLD ETN $47.17
- Silver: profit-take exit price: $12.32; stop-loss: $15.11; initial target price for the DSLV ETN: $47.67; stop-loss for the DSLV ETN $28.37
- Mining stocks (price levels for the GDX ETF): profit-take exit price: $13.12; stop-loss: $20.83; initial target price for the DUST ETF: $80.97; stop-loss for the DUST ETF $24.87
Note: the above is a specific preparation for a possible sudden price drop, it does not reflect the most likely outcome. You will find a more detailed explanation in our August 1 Alert. In case one wants to bet on junior mining stocks’ prices (we do not suggest doing so – we think senior mining stocks are more predictable in the case of short-term trades – if one wants to do it anyway, we provide the details), here are the stop-loss details and target prices:
- GDXJ ETF: profit-take exit price: $17.52; stop-loss: $31.23
- JDST ETF: initial target price: $154.97 stop-loss: $51.78
Long-term capital (core part of the portfolio; our opinion): No positions (in other words: cash)
Insurance capital (core part of the portfolio; our opinion): Full position
Important Details for New Subscribers
Whether you already subscribed or not, we encourage you to find out how to make the most of our alerts and read our replies to the most common alert-and-gold-trading-related-questions.
Please note that the in the trading section we describe the situation for the day that the alert is posted. In other words, it we are writing about a speculative position, it means that it is up-to-date on the day it was posted. We are also featuring the initial target prices, so that you can decide whether keeping a position on a given day is something that is in tune with your approach (some moves are too small for medium-term traders and some might appear too big for day-traders).
Plus, you might want to read why our stop-loss orders are usually relatively far from the current price.
Please note that a full position doesn’t mean using all of the capital for a given trade. You will find details on our thoughts on gold portfolio structuring in the Key Insights section on our website.
As a reminder – “initial target price” means exactly that – an “initial” one, it’s not a price level at which we suggest closing positions. If this becomes the case (like it did in the previous trade) we will refer to these levels as levels of exit orders (exactly as we’ve done previously). Stop-loss levels, however, are naturally not “initial”, but something that, in our opinion, might be entered as an order.
Since it is impossible to synchronize target prices and stop-loss levels for all the ETFs and ETNs with the main markets that we provide these levels for (gold, silver and mining stocks – the GDX ETF), the stop-loss levels and target prices for other ETNs and ETF (among other: UGLD, DGLD, USLV, DSLV, NUGT, DUST, JNUG, JDST) are provided as supplementary, and not as “final”. This means that if a stop-loss or a target level is reached for any of the “additional instruments” (DGLD for instance), but not for the “main instrument” (gold in this case), we will view positions in both gold and DGLD as still open and the stop-loss for DGLD would have to be moved lower. On the other hand, if gold moves to a stop-loss level but DGLD doesn’t, then we will view both positions (in gold and DGLD) as closed. In other words, since it’s not possible to be 100% certain that each related instrument moves to a given level when the underlying instrument does, we can’t provide levels that would be binding. The levels that we do provide are our best estimate of the levels that will correspond to the levels in the underlying assets, but it will be the underlying assets that one will need to focus on regarding the signs pointing to closing a given position or keeping it open. We might adjust the levels in the “additional instruments” without adjusting the levels in the “main instruments”, which will simply mean that we have improved our estimation of these levels, not that we changed our outlook on the markets. We are already working on a tool that would update these levels on a daily basis for the most popular ETFs, ETNs and individual mining stocks.
Our preferred ways to invest in and to trade gold along with the reasoning can be found in the how to buy gold section. Additionally, our preferred ETFs and ETNs can be found in our Gold & Silver ETF Ranking.
As a reminder, Gold & Silver Trading Alerts are posted before or on each trading day (we usually post them before the opening bell, but we don't promise doing that each day). If there's anything urgent, we will send you an additional small alert before posting the main one.
=====
Latest Free Trading Alerts:
155,000. The November job gains disappointed. But the unemployment rate remained at 3.7 percent. What does it all mean for the gold market?
Should Weak November Payrolls Please Gold Bulls?
=====
Hand-picked precious-metals-related links:
PRECIOUS-Gold prices inch higher as dollar softens
Europe’s ‘Kafka-esque’ recycling dilemma for precious metals
=====
In other news:
The Death of Fed Funds? As Market Dries Up, FOMC Asks What Next
European Stocks, U.S. Futures Rally as Bonds Drop: Markets Wrap
Pound rises off twenty-month low after Brexit blow; dollar retreats
Powell Is Staging a Fed Charm Offensive to Combat Trump’s Attacks
Iran says it recently tested a ballistic missile
EU tells May - We will not renegotiate the Brexit treaty
As India looks for new central bank head, investors worry about independence
IMF warns storm clouds are gathering for next financial crisis
=====
Thank you.
Sincerely,
Przemyslaw Radomski, CFA
Editor-in-chief, Gold & Silver Fund Manager
Gold & Silver Trading Alerts
Forex Trading Alerts
Oil Investment Updates
Oil Trading Alerts

