

Briefly: in our opinion, full (300% of the regular position size) speculative short positions in junior mining stocks are justified from the risk/reward point of view at the moment of publishing this Alert.
Gold moved higher on Friday, so you might be wondering if this changed anything regarding the outlook. In short, it didn’t.
Let’s take a closer look at what happened.
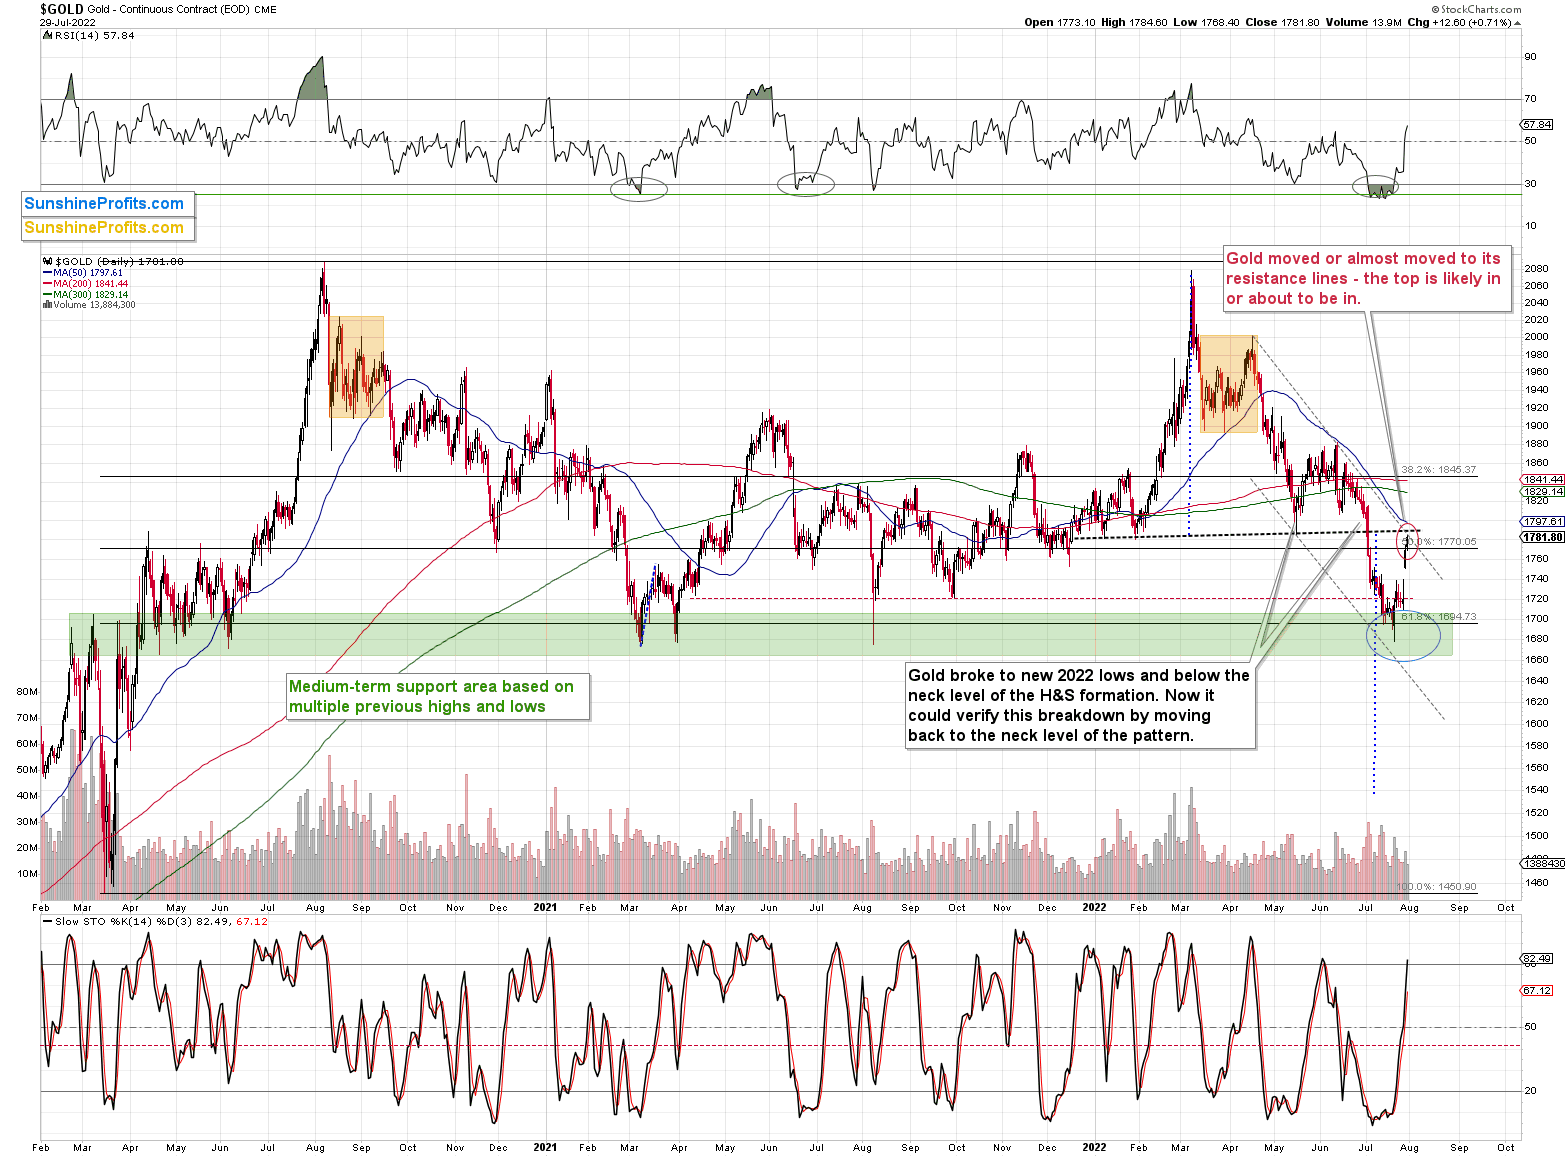
Gold futures moved higher by over $12, and this meant that they moved from the lower part of my previous target area to its upper part. In other words, it remained within the target area, which means that it kept doing what was – in my view – the most likely course of action for this particular market.
As such, it didn’t invalidate any previous expectations, let alone the broader outlook.
Gold stopped below the upper border of the declining trend channel, and it ended the week below the neck level of the previous head-and-shoulders pattern. Both remain unbroken, so the recent upswing doesn’t change the outlook, which turned bearish when we took profits from our previous long position on Thursday.
The RSI indicator is now visibly above 50 and close to the levels that triggered a top in gold in April and June 2022, and in July 2021.
As you may recall, gold is currently repeating its 2012-2013 pattern, and based on it, it’s likely just before the most volatile part of the decline. You can read more about it in Friday’s analysis (and in many previous analyses), and if the above is new to you, I strongly suggest that you take the time to read more – the self-similar pattern is truly astonishing.
So, let’s check what gold did in 2013 at the analogous time.
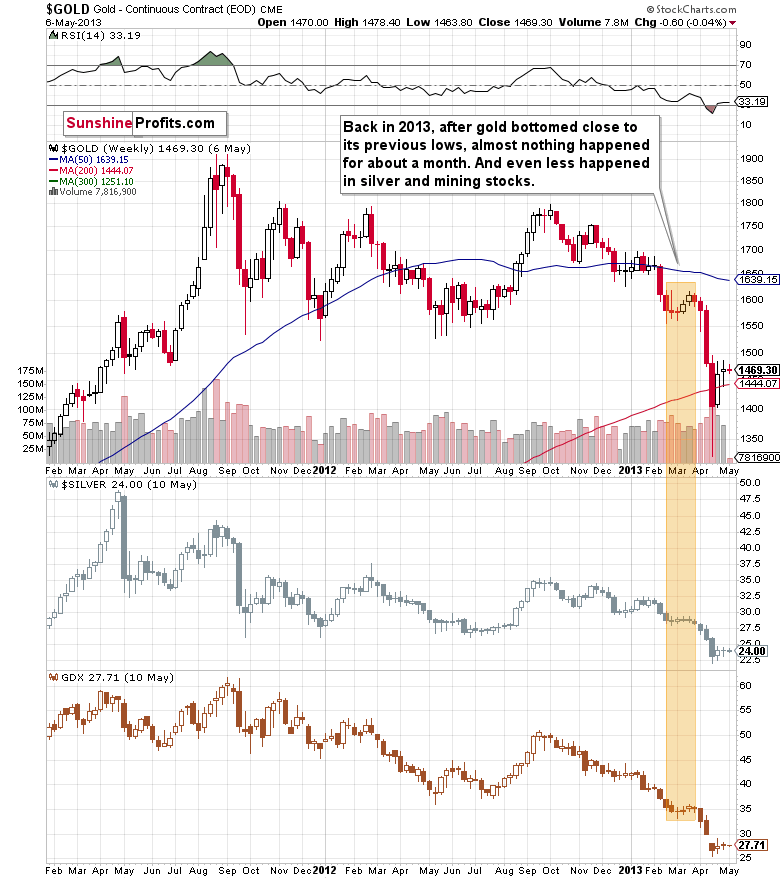
Well, it consolidated for a few weeks and plunged only after that consolidation.
While it doesn’t guarantee that we’ll see a pause that’s as long as the one that we saw before the April 2013 slide, it’s a good indication that the huge decline might not start immediately, but rather we might see some “preparatory” action.
For now, investors and traders might view the current prices as temporary, and they might expect gold to soar back up. In fact, I saw multiple analyses indicating exactly that. This means that a week or a few weeks of back and forth trading close to the current price levels or between the current price levels and the recent lows would help to convince them that this move lower was not accidental.
This would make them much more likely to sell (and panic) once gold breaks below its recent lows.
Also, while the above chart doesn’t show it, because it’s based on weekly and not daily prices, gold topped in March 2013 when its daily RSI was trading just a little above 50 and close to its previous higs – just like what we see right now.
Getting back to the possible back-and-forth movement that we might see now, please note that the price “action” was even more boring in the case of silver and mining stocks (middle and lower parts of the above chart). They did very little during the consolidation, but when they finally moved lower, they truly plunged.
Oh, and don’t let the sizes of the moves fool you – the scale is linear in the case of silver and GDX, while it’s logarithmic in the case of gold. In reality, the mining stocks still declined the most, and silver’s decline was still bigger than the one seen in gold.
All in all, the short-term rally appears to be over or about to be over, and mining stocks’ lack of strength on Friday confirms it.
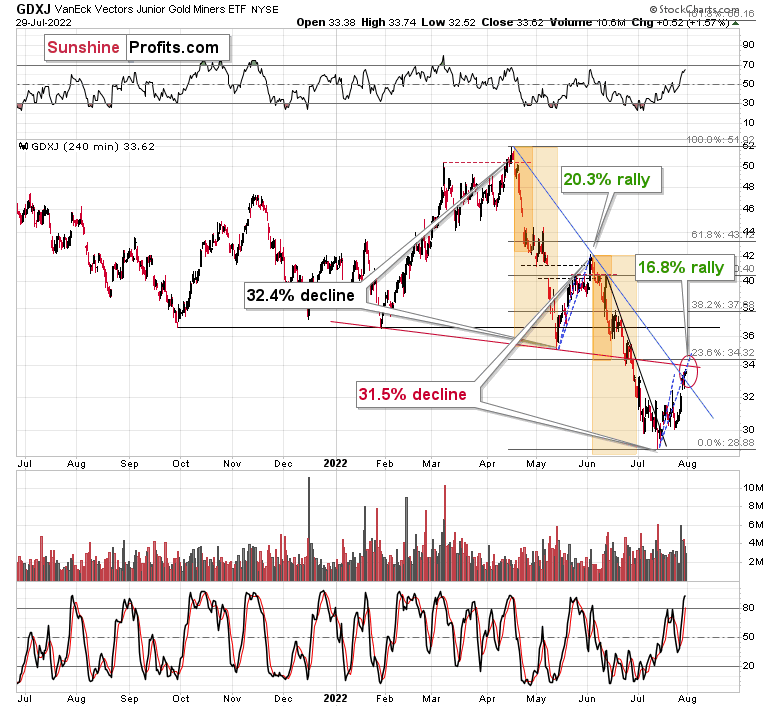
Yes, miners ended the day higher, but the move up was negligible. Also, junior miners remained within their target area, just like gold, and the RSI based on the GDXJ moved close to 70, and to the level at which it topped in early June. This is a bearish combination.
Moreover, while juniors moved higher in a rather insignificant manner, the USD Index moved visibly lower.
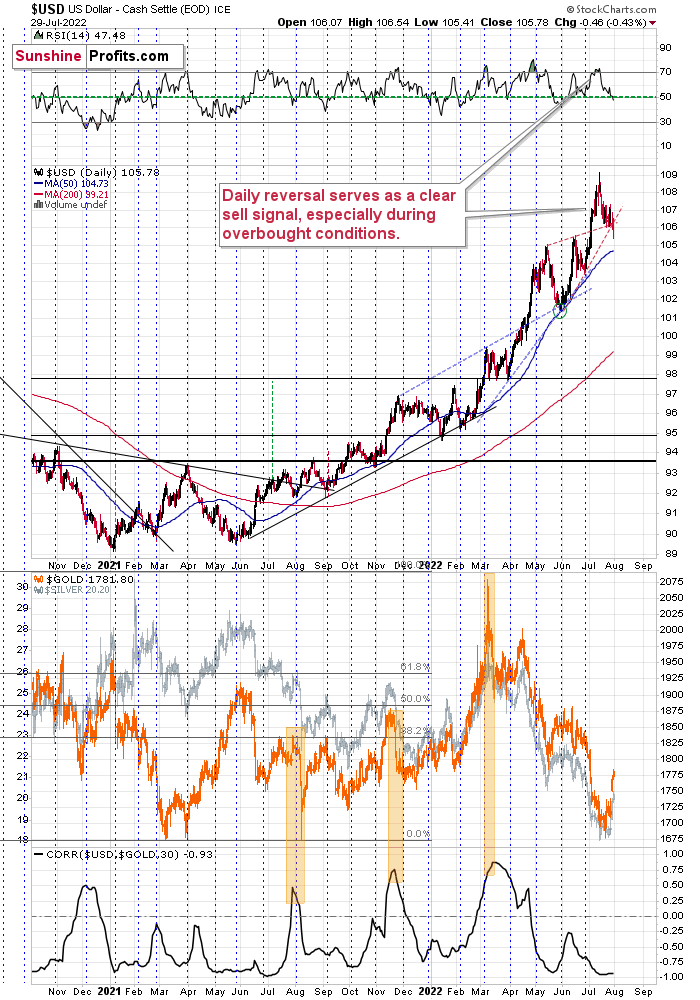
This move is in tune with what we saw at previous local bottoms. The RSI moved slightly below 50, and it’s the turn of the month – this combination was enough to trigger rallies in the U.S. dollar index.
Let’s keep in mind that the latter tends to form important bottoms close to the middle of the year.
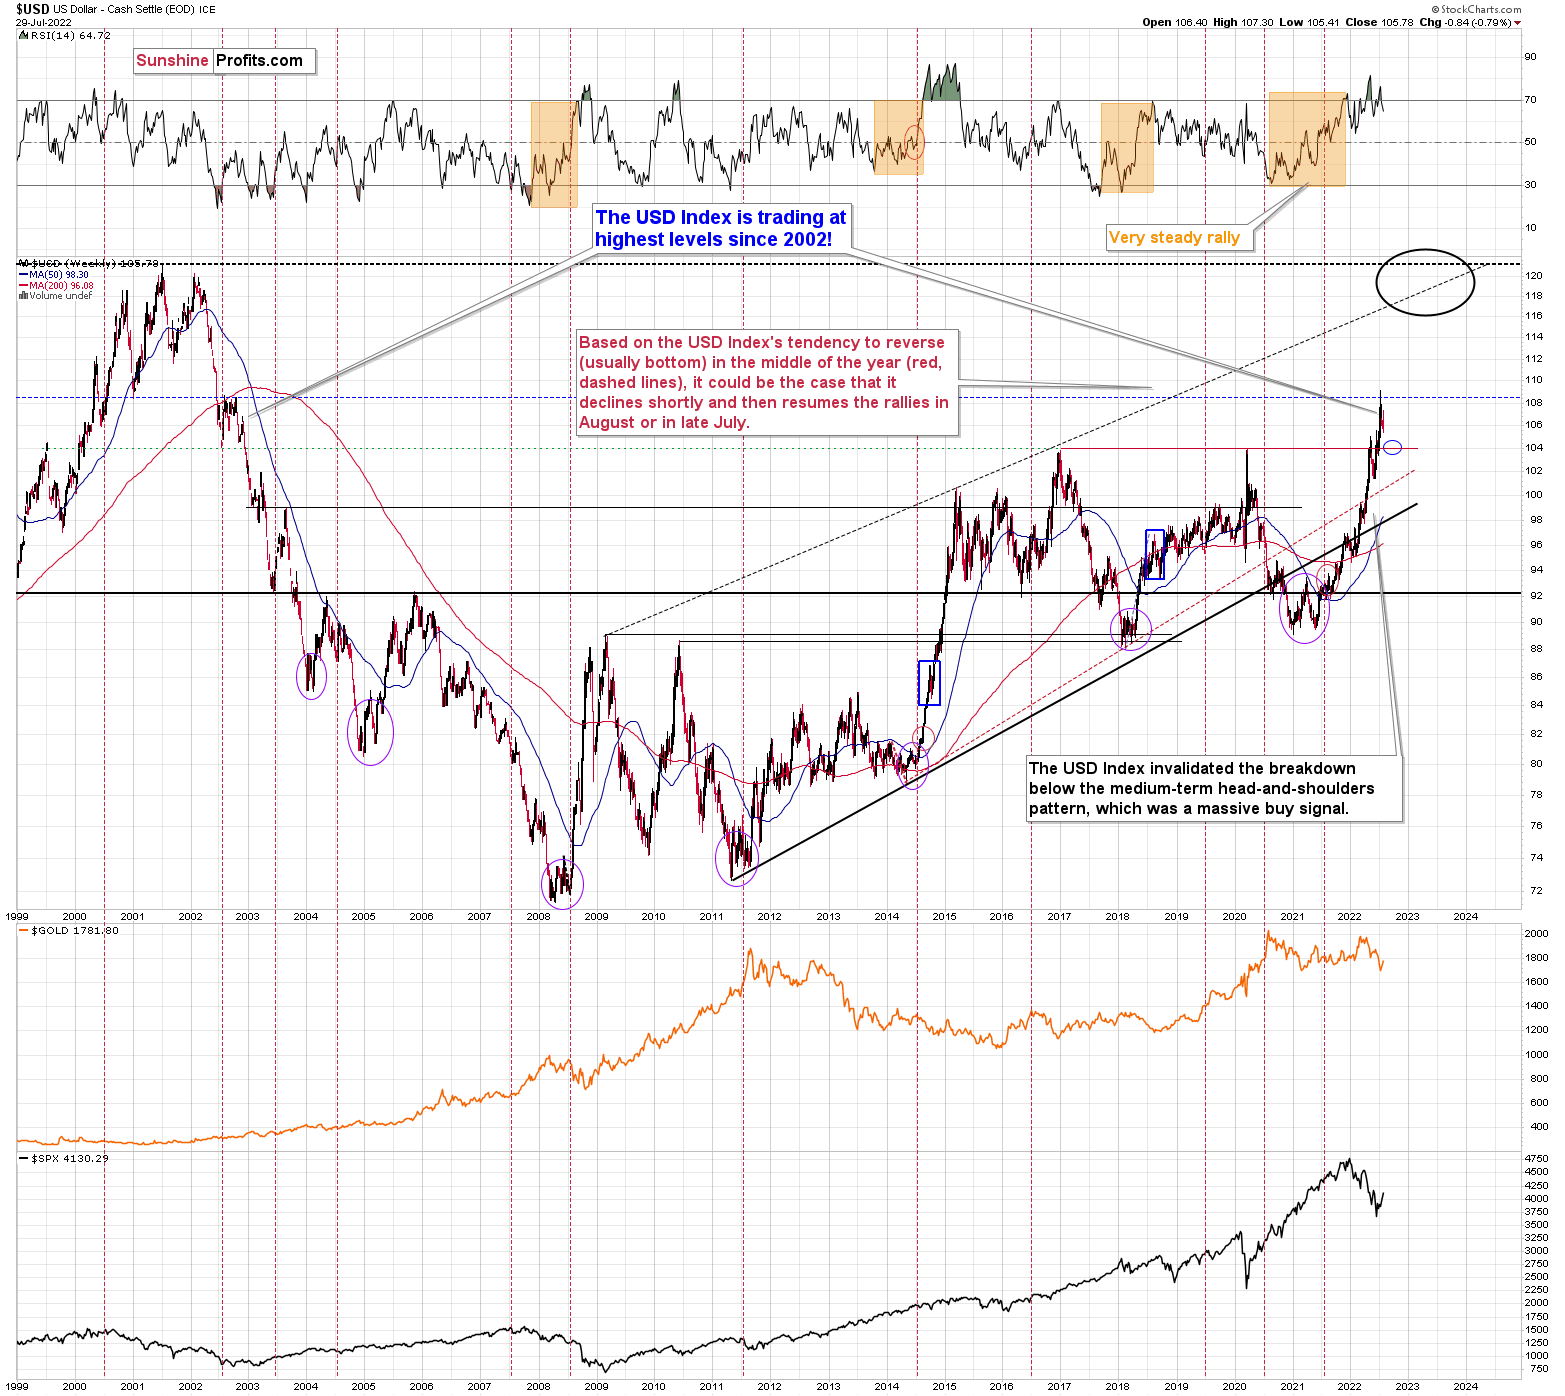
So, the scenario in which the USD Index bottoms shortly (or that it just bottomed) seems quite likely.
There’s also the possibility that the USD Index keeps declining until it reaches the very strong support at about the 104 level – the previous long-term highs. Right now, it’s at about 105.5, which means that it could decline by another 1.5 index points or so. It doesn’t necessarily mean that gold, silver, and mining stocks would need to rally substantially if the above materialized. Conversely, since gold might now be reluctant to react to the USD’s lead and miners might be reluctant to react to gold’s lead, it seems that the possible upside for junior miners is very limited.
In other words, even if the big decline really picks up in a few weeks, I think that the risk-to-reward ratio already favors being on the short side of the precious metals sector. In particular, on the short side of the junior mining stocks.
Having said that, let’s take a look at the market from a more fundamental point of view.
Fantasy Land
After exiting our long position in the GDXJ ETF and switching back to the short side, we expect the PMs to continue their medium-term downtrends. However, with optimism abounding, a bear market rally has some investors believing this is the start of a new bull market.
Please see below:
 Source: CNBC
And:
 Source: CNBC
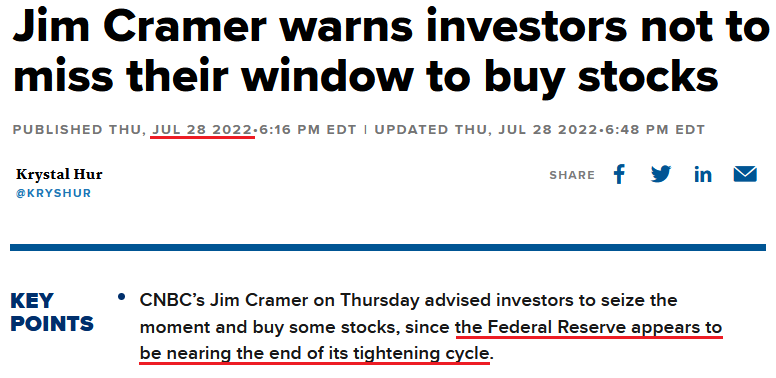
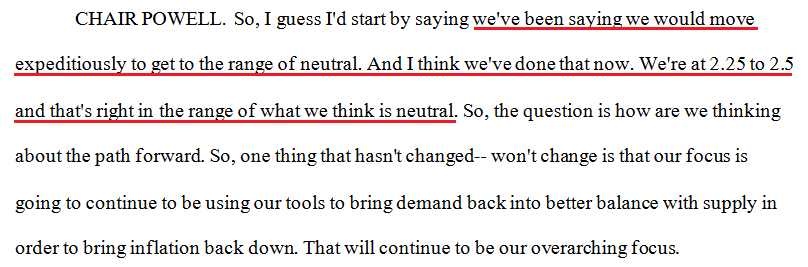
Thus, after Fed Chairman Jerome Powell’s dovish press conference on Jul. 27 lit a fire under risk assets, his words have emboldened the bulls. Moreover, with Powell pouring gasoline on the fire with his assertion that we’ve reached the “neutral” U.S. federal funds rate (FFR), the good times can roll again on Wall Street. For context, neutral is the FFR that neither constricts nor encourages economic activity.
Please see below:
 Source: U.S. Fed
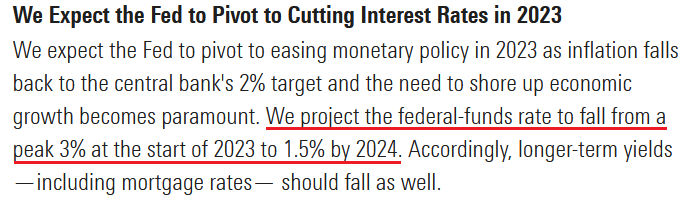
Furthermore, Preston Caldwell, Head of U.S. Economics for Morningstar, wrote the following after Powell’s press conference:
“Although the Federal Reserve is still hiking interest rates for now, we expect the Fed to pivot to cutting rates in 2023 in order to boost an ailing economy (…). Falling inflation should clear the way for the Fed to cut interest rates.”
“We're projecting price pressures to swing from inflationary to deflationary by 2023, owing greatly to the unwinding of price spikes caused by supply constraints in durables, energy, and other areas. As such, we project inflation to average just 1.5% over 2023 through 2026. Once the war on inflation is won, the Fed could shift to doing what’s needed to jump-start economic growth.”
Please see below:
 Source: Morningstar
As a result, while the consensus assumes the Fed is near the end of its rate hike cycle, the Consumer Price Index (CPI) is on the fast track to 2%, and a 3% FFR will be enough to capsize inflation, market participants are living in fantasy land.
For example, I’ve warned on numerous occasions that demand is much stronger than the consensus realizes. With Americans’ checking account balances at unprecedented all-time highs and the Atlanta Fed’s wage growth tracker hitting an all-time high in June, the FFR needs to go meaningfully above 3%. To explain, I wrote on Jul. 25:
With more earnings calls showcasing how the situation continues to worsen, market participants don’t realize that the U.S. federal funds rate needs to hit ~4.5% or more for the Fed to materially reduce inflation. For context, the consensus expects a figure in the 2.5% to 3.5% range.
As evidence, inflationary outperformance was present on Jul. 29.
Please see below:
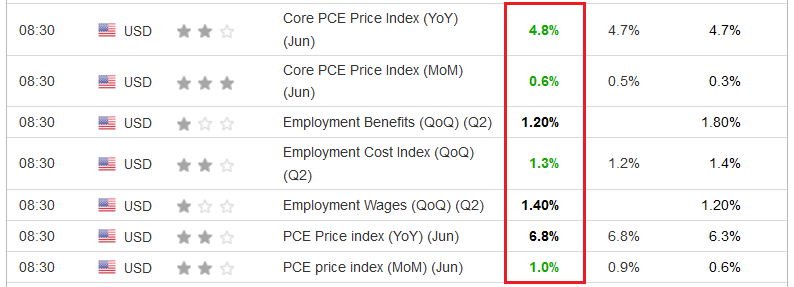 Source: Investing.com
To explain, the Personal Consumption Expenditures (PCE) Index surpassed economists’ consensus estimates, as did the Employment Cost Index (ECI). Furthermore, with the latter’s ascent mirroring the Atlanta Fed’s data, Americans still have plenty of spending firepower.
Please see below:
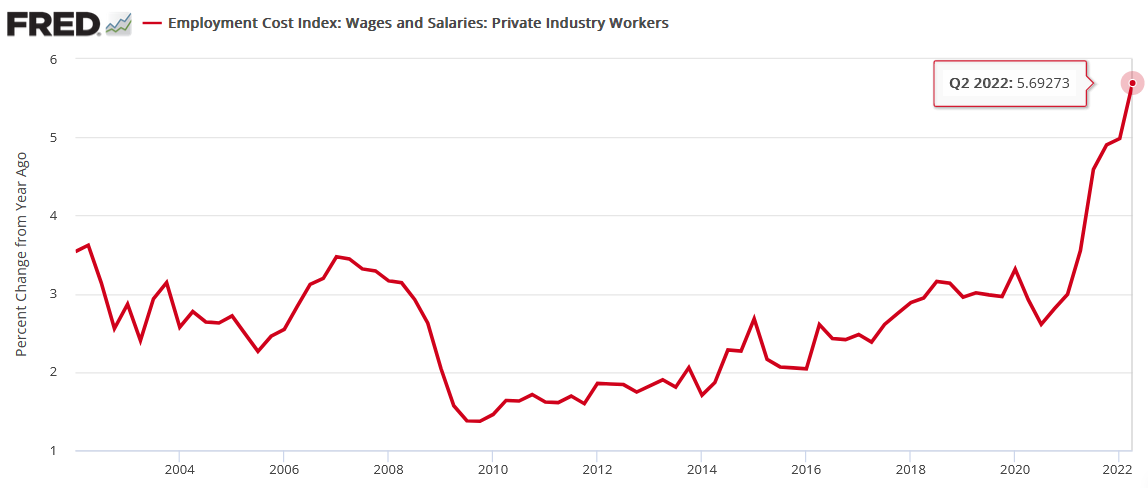
To explain, the red line above tracks the year-over-year (YoY) percentage change in the ECI (data goes back to 2002). If you analyze the right side of the chart, you can see that the metric hit a record high in the second quarter. As a result, companies continue to pay up for employees.
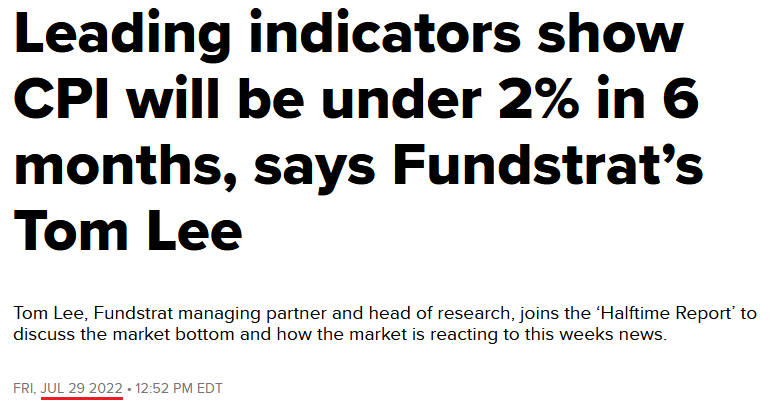
Likewise, I noted on May 24 how Tom Lee – a permabull who says the “CPI will be under 2% in six months” – peddled an uninformed narrative back then. I wrote:
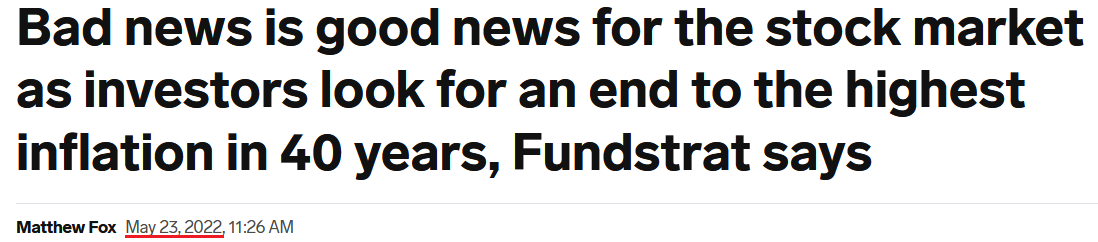 Source: Business Insider
Specifically, Fundstrat founder Tom Lee said:
"Incoming data could show labor market weakening (...) and thus [the] job market could be cooling at a pace faster than implied by tighter financial conditions." Moreover, “layoffs are accelerating, hitting 7,700 so far in May (...). We expect this to soon go parabolic, based upon anecdotal comments we have heard.”
Thus, with Lee opining that “parabolic” layoffs would cool inflation and allow for a dovish pivot, the argument is as ridiculous now as it was then.
Please see below:
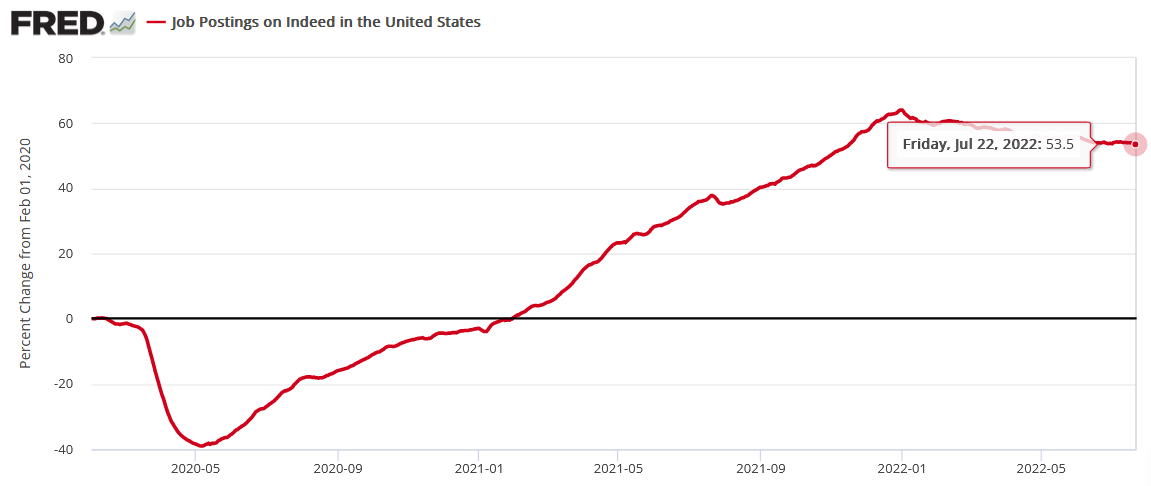
To explain, the red line above tracks the percentage change in U.S. job postings on Indeed relative to its pre-pandemic baseline (data updated on Jul. 28 for the week ended Jul. 22). If you analyze the right side of the chart, you can see that there are 53.5% more U.S. job postings on Indeed versus February 2020.
Moreover, while the metric has come down from its January high – which is expected when the Fed is trying to cool the U.S. labor market – it’s nowhere near falling off a cliff. In addition, the slope of the red line highlights how labor demand has declined at a snail’s pace despite the Fed’s rate increases.
As further evidence, the ISM released its Chicago Business Barometer on Jul. 29. The report revealed:
“All main indicators decreased except for prices paid and employment, the latter of which hit the highest level since October 2021 (…). Employment grew 5.4 points to a current year high of 56.1 as the labor market continued to tighten.”
As a result, investors and the Fed couldn’t be more wrong about the neutral FFR.
Of Your Own Making
While Powell was dead wrong on inflation in 2021, investors still have complete faith in the Fed. Moreover, his uninformed comments following the November FOMC meeting are as relevant now as they were then. I wrote on Nov. 4, 2021:
With Fed Chairman Jerome Powell still searching for his inflationary shooting star, the FOMC chief isn’t ready to label inflation as problematic. “I don’t think that we’re behind the curve,” he said. “I actually believe that policy is well-positioned to address the range of plausible outcomes, and that’s what we need to do.”
(….) For example, Powell said during his press conference: “the inflation that we’re seeing is really not due to a tight labor market. It’s due to bottlenecks and it’s due to shortages and it’s due to very strong demand meeting those (…). We don’t see troubling increases in wages, and we don’t expect those to emerge.”
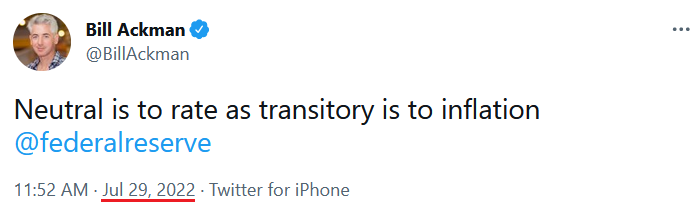
Thus, while “troubling increases in wages” are obvious now, neutral is the new “transitory.” Or, as billionaire hedge fund manager Bill Ackman put it on Jul. 29:
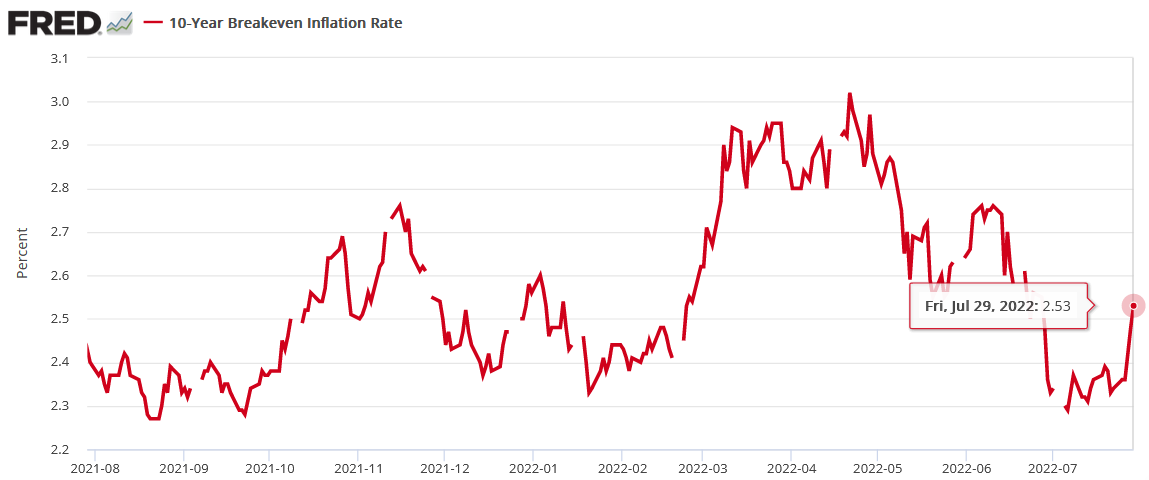
To that point, Powell’s Jul. 27 blunder (or lack of foresight) has only made his job more difficult. For example, the U.S. 10-Year breakeven inflation rate has risen sharply in recent days, while the U.S. 10-Year Treasury yield has fallen sharply. Thus, with the consensus expecting a dovish Fed to cut rates in 2023, the prospect supports higher inflation (breakevens rise), lower nominal yields (Fed is cutting, buy bonds), and therefore, lower real yields.
Please see below:
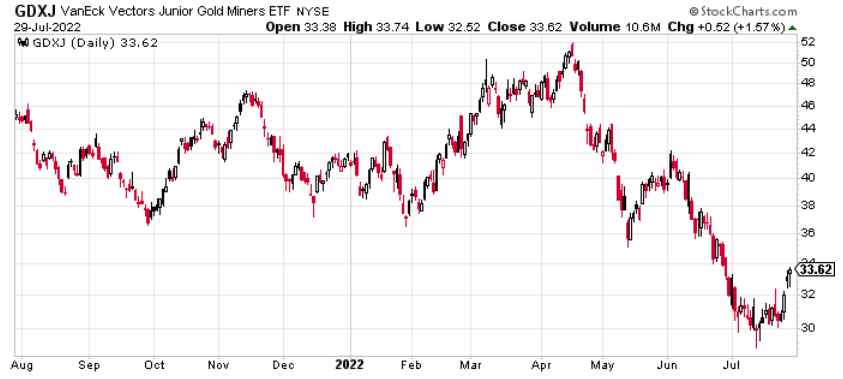
Moreover, I’ve noted on numerous occasions how the GDXJ ETF often follows in the U.S. 10-Year breakeven inflation rate’s footsteps.
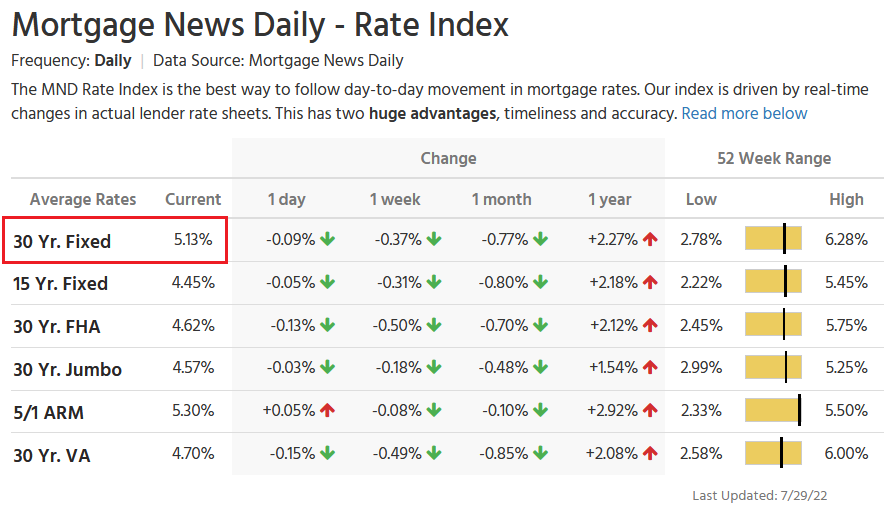
In addition, the interest rate on a 30-year fixed-rate mortgage has declined from a high of 6.28% to 5.13% as of Jul. 29. As such, the reversal stimulates more buying activity, not less.
Please see below:
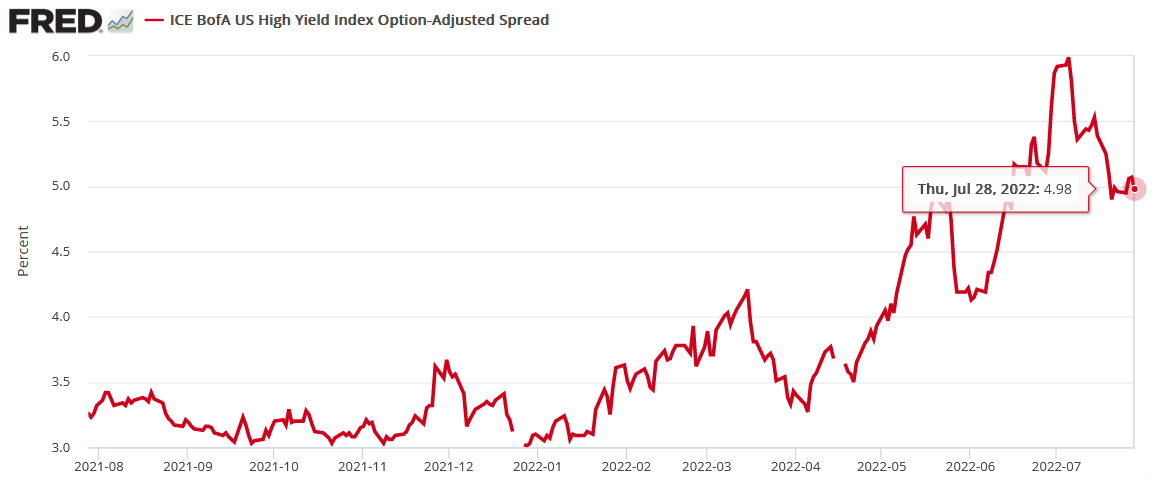
Furthermore, expectations of a dovish pivot helped push high-yield bond spreads down by more than 100 basis points. For context, high-yield bond spreads measure the excess interest rate that investors demand over Treasury yields to finance the riskiest U.S. companies. Therefore, lower spreads provide these companies with cheaper access to capital.
Please see below:
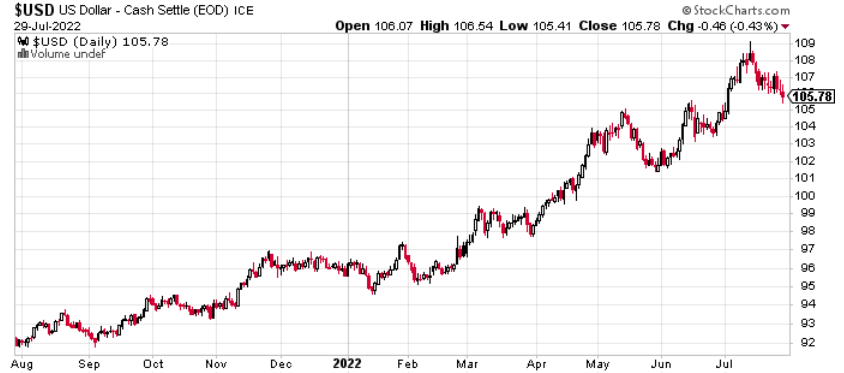
On top of that, the USD Index has come down from its 2022 highs, and the idea of a patient Powell has investors rotating into risk-on currencies.
Add it all up, financial conditions have loosened materially in recent days. Moreover, while all of these developments were bullish for our long position in the GDXJ ETF (and they helped us reap nice profits on that long position), they’re also bullish for inflation. Therefore, while tighter financial conditions are required to reduce inflation, the Fed pushed these metrics in the opposite direction.
As a result, Powell doesn’t realize that his job is much more difficult. Moreover, even when financial conditions were tight, he underestimated the task at hand. Thus, Powell and the consensus are in la-la land with their belief that a 2.5% FFR is neutral and that 3% will curb inflation.
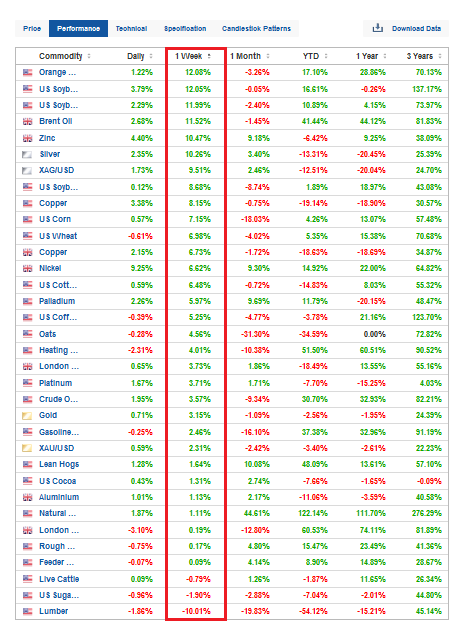
To that point, the U.S. 10-Year real yield declined from a high of 0.89% to 0.13% on Jul. 29. This is the worst development because lower real yields make debt cheaper and encourage more speculation. Therefore, the decline is highly inflationary. Moreover, if you analyze the vertical red rectangle below, you can see that commodities noticed the looser financial conditions and the free fall in real yields last week. As such, Powell made a bad situation worse.
 Source: Investing.com
Likewise, Powell is either the worst communicator on the planet, or he really doesn’t understand inflation or what he actually wants to achieve. For example, I flagged this as the most important quote from his June post-FOMC press conference. Powell said:
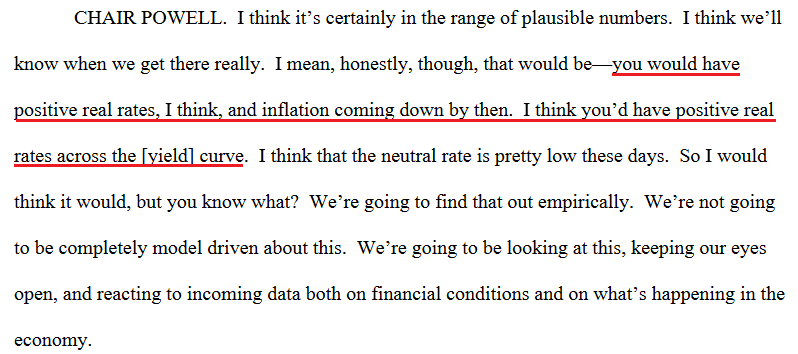 Source: U.S. Fed
Therefore, while Powell seems to know that “positive real rates across the [yield] curve” are required to curb inflation, does he realize that the U.S. 5-Year real yield closed at -0.05% on Jul. 29? For context, it was 0.73% on Jun. 14. Moreover, with a CPI of 9%+ and the U.S. 1-Year Treasury yield at less than 3%, the front-end of the curve is deeply negative.
As a result, Powell put on a master class of what not to do when attempting to rein in unanchored inflation. Thus, inflation risks are more elevated now than a month ago, the consensus is in fantasy land, and Powell should learn the hard way that 2.5% is nowhere near the neutral rate.
The Bottom Line
While the GDXJ ETF enjoyed a decent short-term upswing, fundamental expectations have become so detached from reality that a wake-up call could profoundly impact several asset classes. As such, we think the risk-reward is skewed to the downside, and a short position is prudent. Moreover, while the direction of all of the metrics above is unlikely to flip overnight, material re-ratings should occur over the medium term.
In conclusion, the PMs rallied on Jul. 29, as Powell’s pain is commodities gain. However, with the Fed chief undoing weeks of inflation progress with his poor communication, don’t be surprised if Fed officials ratchet up the hawkish rhetoric in the days/weeks ahead. Because if not, a hyperinflationary collapse may greet the U.S. in the following years.
Overview of the Upcoming Part of the Decline
- It seems to me that the corrective upswing is either over or about to be over, and that the next big move lower is about to start.
- If we see a situation where miners slide in a meaningful and volatile way while silver doesn’t (it just declines moderately), I plan to – once again – switch from short positions in miners to short positions in silver. At this time, it’s too early to say at what price levels this could take place and if we get this kind of opportunity at all – perhaps with gold prices close to $1,600.
- I plan to exit all remaining short positions once gold shows substantial strength relative to the USD Index while the latter is still rallying. This may be the case with gold prices close to $1,400. I expect silver to fall the hardest in the final part of the move. This moment (when gold performs very strongly against the rallying USD and miners are strong relative to gold after its substantial decline) is likely to be the best entry point for long-term investments, in my view. This can also happen with gold close to $1,400, but at the moment it’s too early to say with certainty.
- The above is based on the information available today, and it might change in the following days/weeks.
You will find my general overview of the outlook for gold on the chart below:
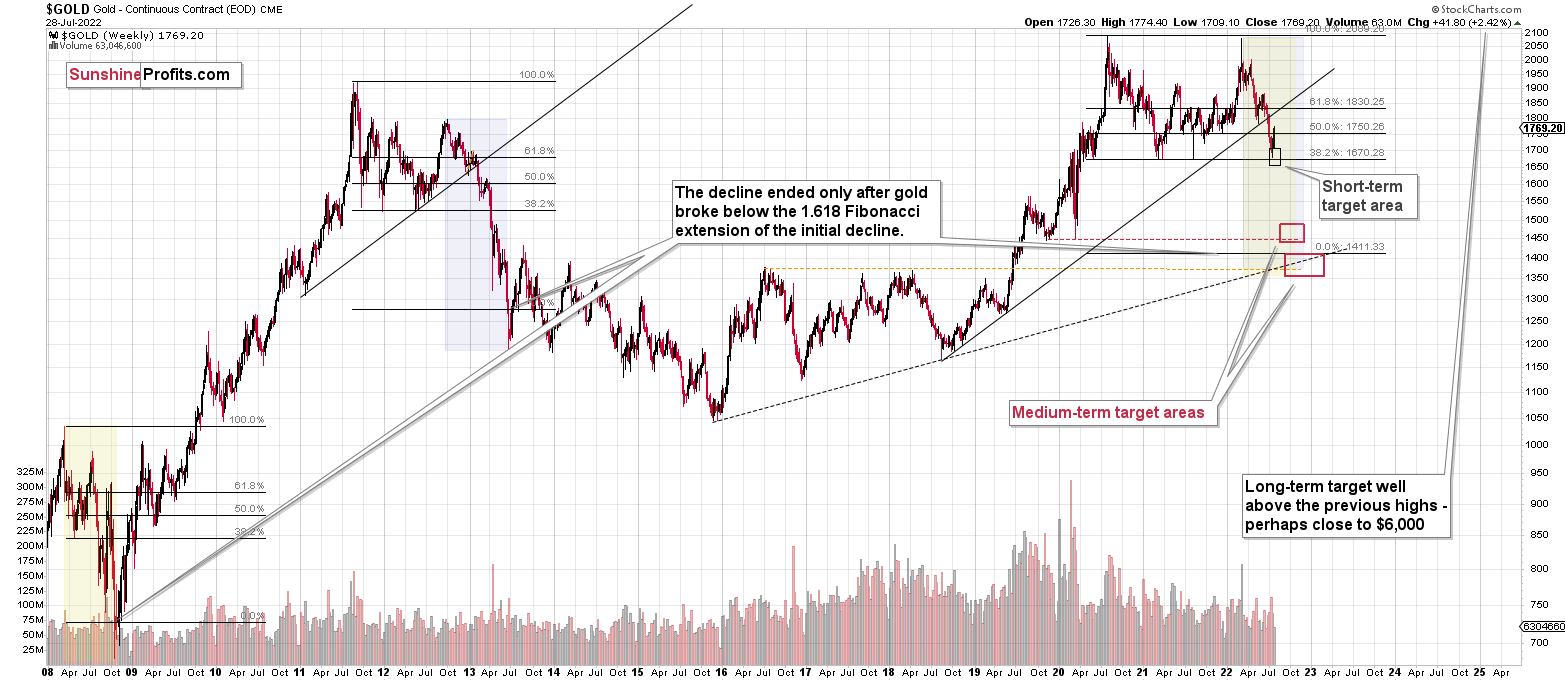
Please note that the above timing details are relatively broad and “for general overview only” – so that you know more or less what I think and how volatile I think the moves are likely to be – on an approximate basis. These time targets are not binding nor clear enough for me to think that they should be used for purchasing options, warrants, or similar instruments.
Letters to the Editor
Q: Thanks for your insight and expertise. I've made some money following your guidance, and I appreciate it. I followed your advice and switched from long to short positions in junior miners. The S&P and the miners have looked pretty strong the last 3 days. How much higher will they run?
A: Thanks! I’m very happy that you enjoy the results of my work! Miners look like they are either topping here or that they are about to top. I provided details in today’s analysis. I’m not sure about the S&P 500, but I’m leaning toward saying that their short-term upswing is also close to being over.
Q: Thanks for the great and rewarding advice. I am a little puzzled about the objectives for GDXJ and ZSL-GDXJ. Its potential gain is 40%, while the ZSL - 157%. Is there any logical reason or explanation for this? Thank you so much.
A: Thank you for your kind words! To briefly clarify, I’m just providing my opinions, not investment advice.
I’m not sure how to explain the difference in those targets, as I’m not sure what makes them unclear.
However, I’d like to emphasize that the ZSL is an inverse, leveraged proxy for silver, not for mining stocks.
Moreover, please note that the leveraged ETFs have multiple daily price moves and nothing more than that.
So, if the GDXJ keeps declining by 1% daily for about 51 trading days, then it will erase about 40% of its initial value. (1 – 1%) ^ 51 = 59.9%
59.9% - 100% = a decline of about 40%
Now, if we inverse this and multiply by 2, we get the following:
(1 + 2%) ^ 51 = 274.5%
274.5% - 100% = 174.5% = a gain of about 175%.
As you can see, because the leveraged ETFs multiply daily price moves and not the entire price moves, the ultimate leverage will vary and depend on the exact price path that the asset takes to its destination.
I made some simplifications in my projections to arrive at my targets, but the key thing about them is that I will keep updating them as we move close to those levels, as when a part of the price path is already behind us, the targets will be clearer.
Hopefully, the above helps.
Q: PR, I suspect that there will be a truce in Ukraine within the next 60 days. How do you think this will affect the euro, dollar, gold, and miners? Thanks.
A: If that happened, then the euro could move higher, while the dollar, gold, and miners could move lower, as the uncertainty premium for safe-haven assets declines. The euro, the dollar, and the price of gold would likely be most affected, though, and miners only to a lesser extent.
In other words, the above would not change the current outlook or positions.
Summary
Summing up, it seems that the corrective upswing is over (or close to being over), which means that the powerful medium-term downtrend can now resume.
Last week, we closed yet another profitable trade in a row. This year’s profits are already enormous, but it seems likely to me that they will grow even more in the following weeks and months. Making money on corrections during powerful trends is a difficult feat, but you managed to do just that – congratulations!
Moreover, please note that it’s not only the profits on the long positions that are so great about this success – it’s also the ability to get back on the short side of the market at more favorable (higher) prices, thus increasing the likely profits from the current trade. Congratulations, once again!
Also, please note that I will be updating the targets for the leveraged ETFs as we move closer to them, as their prices will depend on the path prices take to reach their targets.
After the final sell-off (that takes gold to about $1,350-$1,500), I expect the precious metals to rally significantly. The final part of the decline might take as little as 1-5 weeks, so it's important to stay alert to any changes.
As always, we'll keep you – our subscribers – informed.
To summarize:
Trading capital (supplementary part of the portfolio; our opinion): Full speculative short positions (300% of the full position) in junior mining stocks are justified from the risk to reward point of view with the following binding exit profit-take price levels:
Mining stocks (price levels for the GDXJ ETF): binding profit-take exit price: $20.32; stop-loss: none (the volatility is too big to justify a stop-loss order in case of this particular trade)
Alternatively, if one seeks leverage, we’re providing the binding profit-take levels for the JDST (2x leveraged). The binding profit-take level for the JDST: $29.87; stop-loss for the JDST: none (the volatility is too big to justify a SL order in case of this particular trade).
For-your-information targets (our opinion; we continue to think that mining stocks are the preferred way of taking advantage of the upcoming price move, but if for whatever reason one wants / has to use silver or gold for this trade, we are providing the details anyway.):
Silver futures downside profit-take exit price: $12.32
SLV profit-take exit price: $11.32
ZSL profit-take exit price: $79.87
Gold futures downside profit-take exit price: $1,504
HGD.TO – alternative (Canadian) 2x inverse leveraged gold stocks ETF – the upside profit-take exit price: $19.87
HZD.TO – alternative (Canadian) 2x inverse leveraged silver ETF – the upside profit-take exit price: $49.87
Long-term capital (core part of the portfolio; our opinion): No positions (in other words: cash)
Insurance capital (core part of the portfolio; our opinion): Full position
Whether you’ve already subscribed or not, we encourage you to find out how to make the most of our alerts and read our replies to the most common alert-and-gold-trading-related-questions.
Please note that we describe the situation for the day that the alert is posted in the trading section. In other words, if we are writing about a speculative position, it means that it is up-to-date on the day it was posted. We are also featuring the initial target prices to decide whether keeping a position on a given day is in tune with your approach (some moves are too small for medium-term traders, and some might appear too big for day-traders).
Additionally, you might want to read why our stop-loss orders are usually relatively far from the current price.
Please note that a full position doesn't mean using all of the capital for a given trade. You will find details on our thoughts on gold portfolio structuring in the Key Insights section on our website.
As a reminder - "initial target price" means exactly that - an "initial" one. It's not a price level at which we suggest closing positions. If this becomes the case (as it did in the previous trade), we will refer to these levels as levels of exit orders (exactly as we've done previously). Stop-loss levels, however, are naturally not "initial", but something that, in our opinion, might be entered as an order.
Since it is impossible to synchronize target prices and stop-loss levels for all the ETFs and ETNs with the main markets that we provide these levels for (gold, silver and mining stocks - the GDX ETF), the stop-loss levels and target prices for other ETNs and ETF (among other: UGL, GLL, AGQ, ZSL, NUGT, DUST, JNUG, JDST) are provided as supplementary, and not as "final". This means that if a stop-loss or a target level is reached for any of the "additional instruments" (GLL for instance), but not for the "main instrument" (gold in this case), we will view positions in both gold and GLL as still open and the stop-loss for GLL would have to be moved lower. On the other hand, if gold moves to a stop-loss level but GLL doesn't, then we will view both positions (in gold and GLL) as closed. In other words, since it's not possible to be 100% certain that each related instrument moves to a given level when the underlying instrument does, we can't provide levels that would be binding. The levels that we do provide are our best estimate of the levels that will correspond to the levels in the underlying assets, but it will be the underlying assets that one will need to focus on regarding the signs pointing to closing a given position or keeping it open. We might adjust the levels in the "additional instruments" without adjusting the levels in the "main instruments", which will simply mean that we have improved our estimation of these levels, not that we changed our outlook on the markets. We are already working on a tool that would update these levels daily for the most popular ETFs, ETNs and individual mining stocks.
Our preferred ways to invest in and to trade gold along with the reasoning can be found in the how to buy gold section. Furthermore, our preferred ETFs and ETNs can be found in our Gold & Silver ETF Ranking.
As a reminder, Gold & Silver Trading Alerts are posted before or on each trading day (we usually post them before the opening bell, but we don't promise doing that each day). If there's anything urgent, we will send you an additional small alert before posting the main one.
Thank you.
Przemyslaw Radomski, CFA
Founder, Editor-in-chief

