

Briefly: in our opinion, full (300% of the regular position size) speculative short positions in junior mining stocks are justified from the risk/reward point of view at the moment of publishing this Alert.
Yesterday’s session served as a great bearish sign, not just because of gold’s and silver’s reversals, but also because of miners’ underperformance.
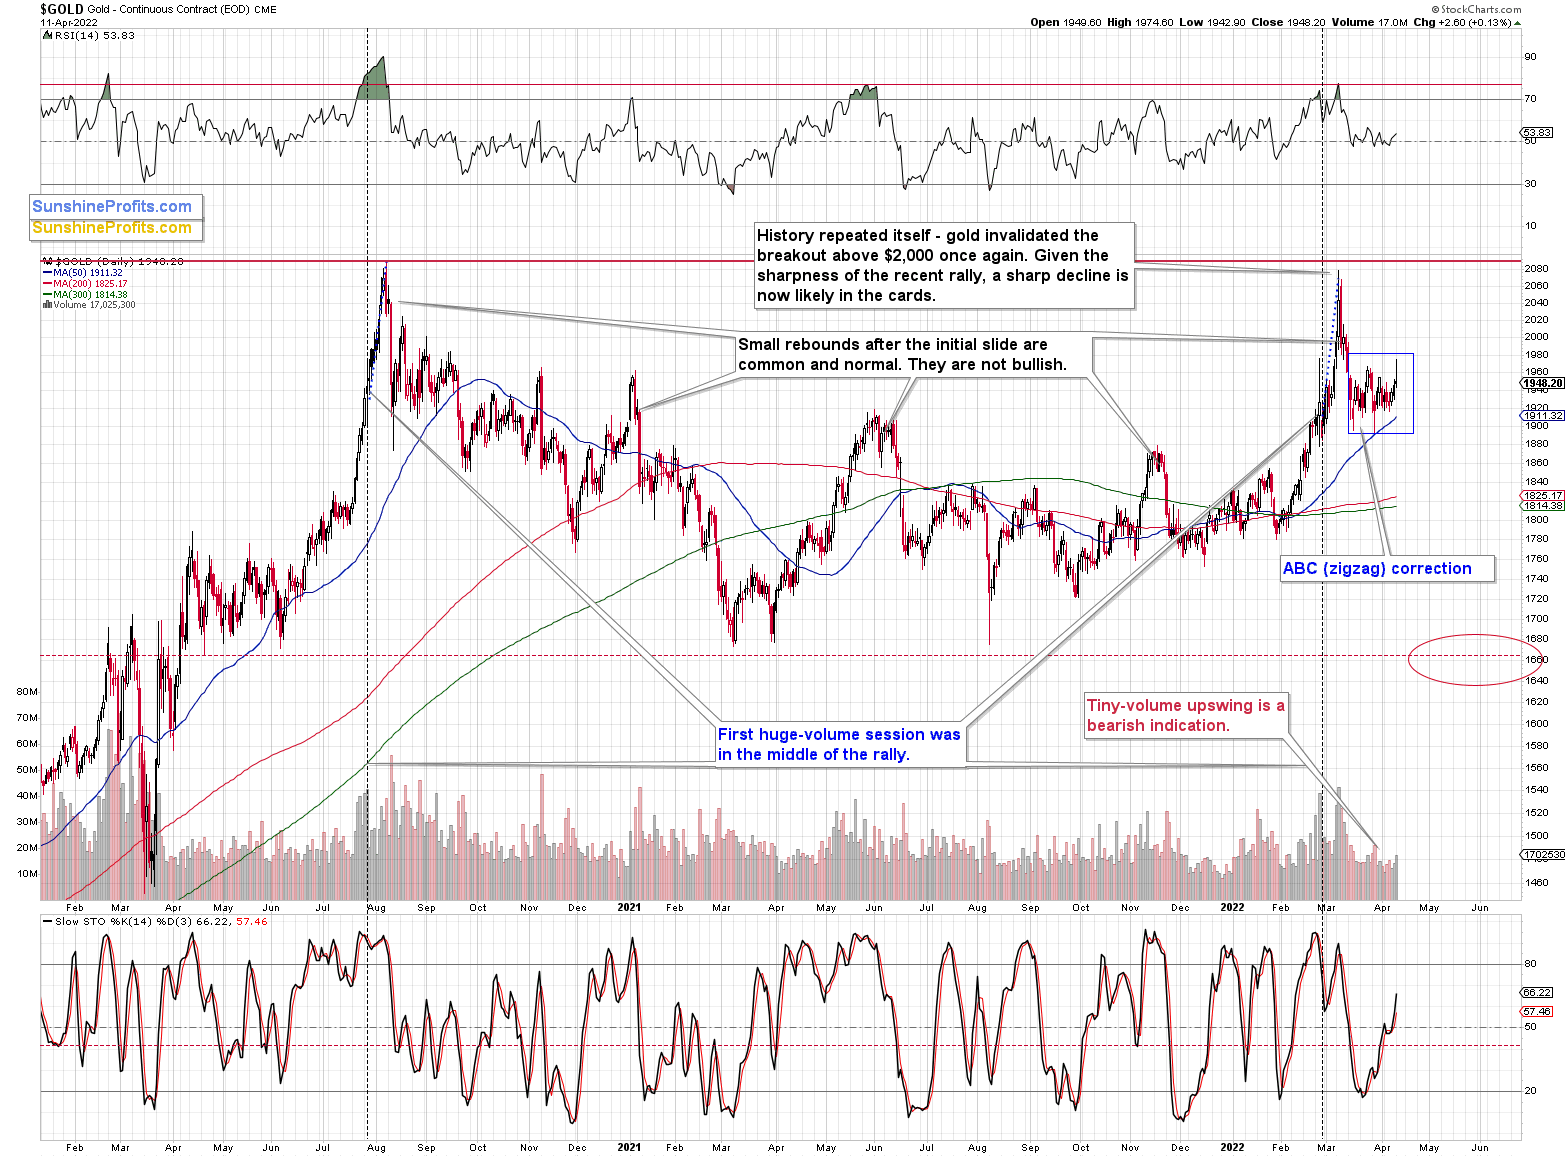
Let's take a look at gold.
During yesterday’s session, gold moved slightly above its previous local high, but then quickly invalidated this small breakout. Invalidations of breakouts in gold are a sell signal on their own, but the fact that we saw the same thing in silver makes the bearish nature of this development even more prominent.
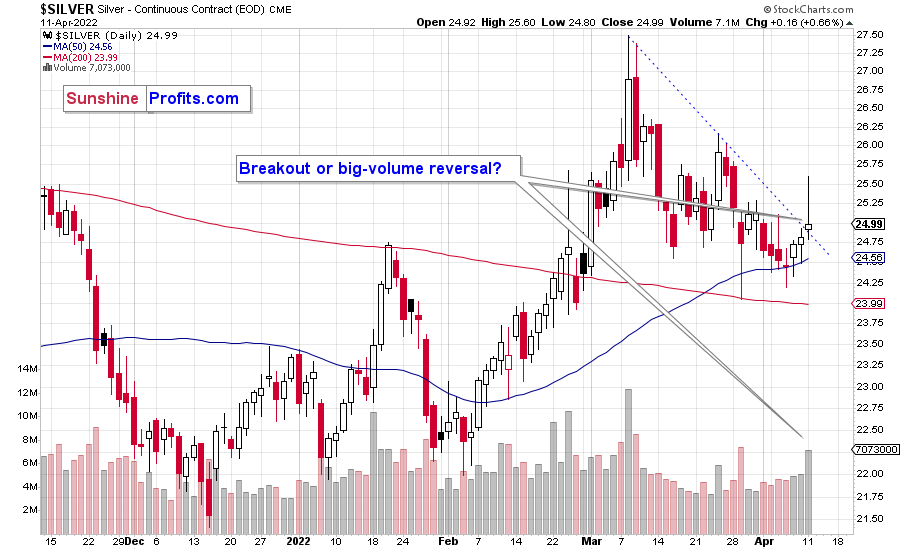
After having been relatively calm in April, silver soared above its declining resistance line… only to disappoint shortly thereafter. The white metal still closed the day slightly above the resistance line. However, given that the reversal took place on relatively high volume, the odds are that this breakout will be invalidated shortly.
In fact, it was only yesterday when I wrote that silver was known for its fake breakouts right before starting much bigger declines. It appears that we have witnessed this kind of performance once again.
While both precious metals ended the session higher, mining stocks ended it lower. This could be a sign that the top is in. Let’s take a look at junior miners’ short-term chart.
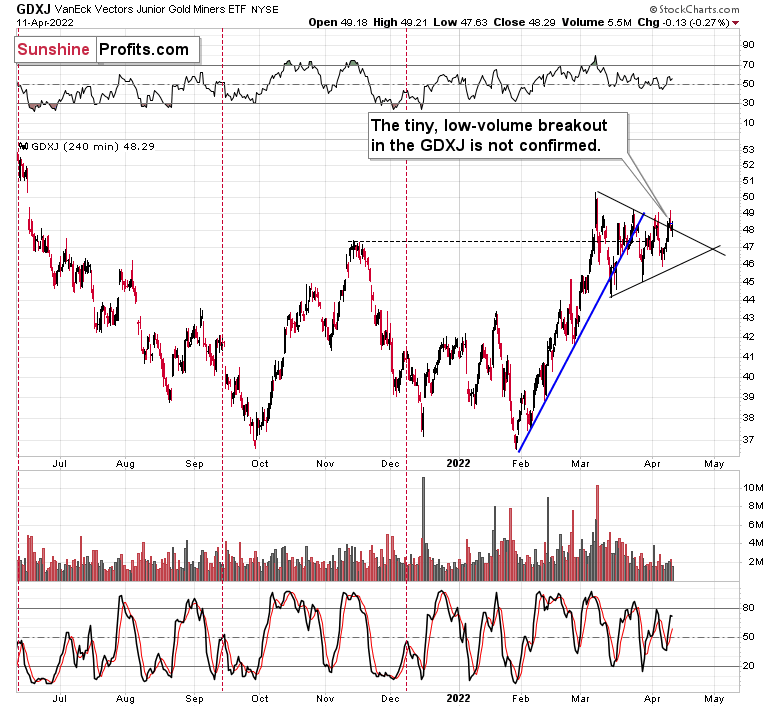
While the GDXJ ETF didn’t invalidate its tiny breakout above the triangle pattern in terms of the daily closing prices, it did move back below it on an intraday basis.
So, if gold’s and silver’s reversals are followed by lower prices, junior miners will likely invalidate the breakout and trigger more selling.
Let’s keep in mind that while gold and silver are repeating their 2012 performance, we can spot some analogies in GDXJ too.
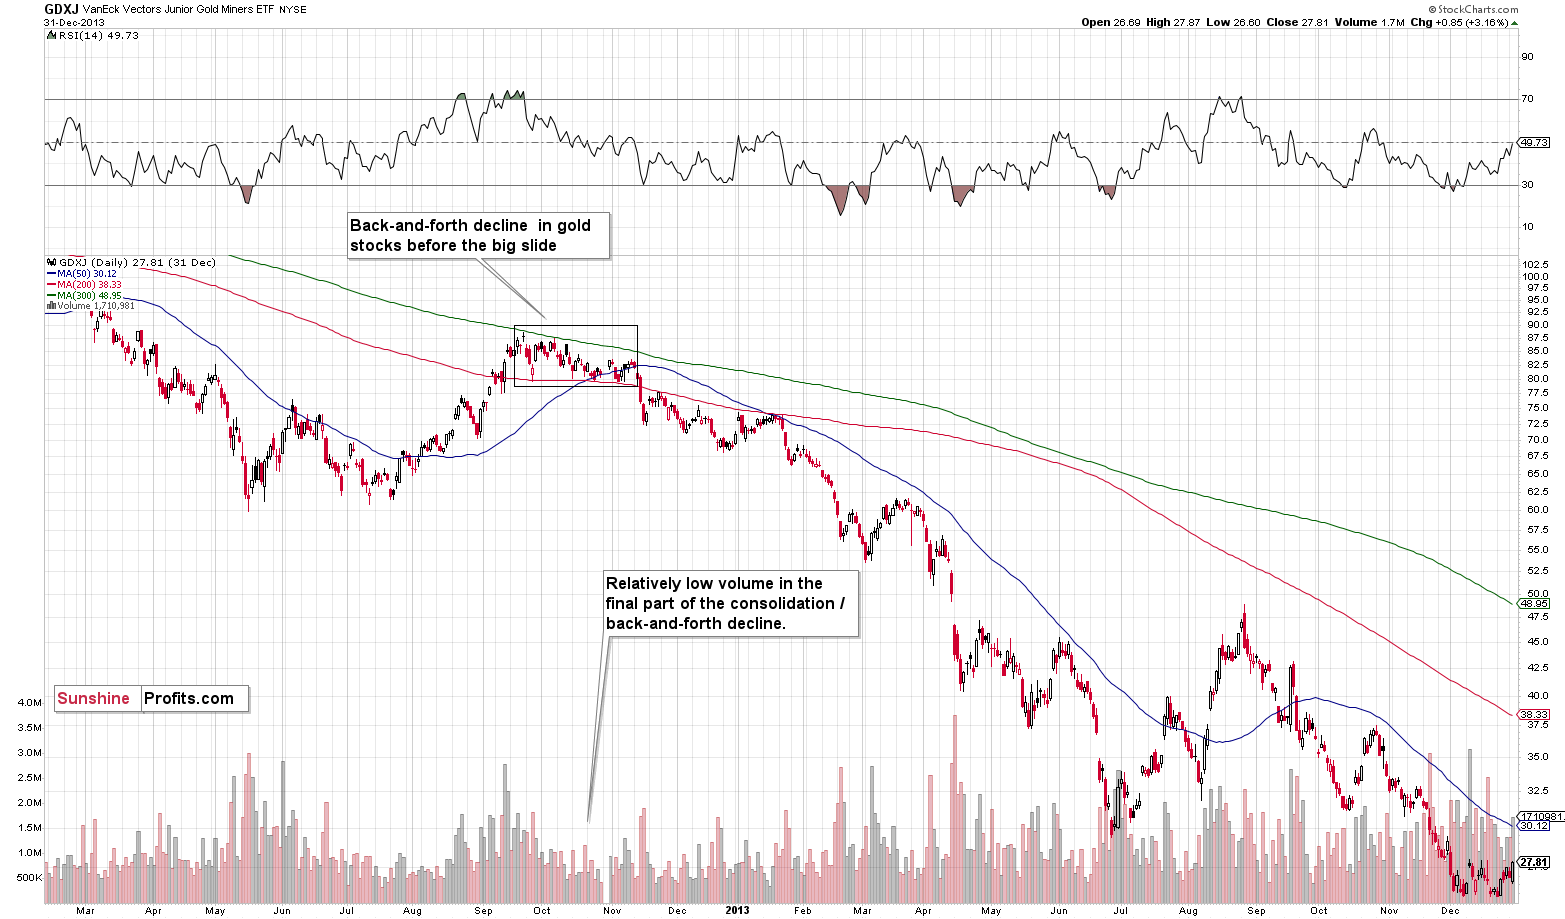
At first, in late-September 2012 and early-October 2012, junior miners consolidated, and then they declined, thus entering the back-and-forth decline mode. It happened on relatively low volume.
Right now, GDXJ is also after a consolidation that’s been taking place on relatively low volume and that followed a rather sizable short-term upswing.
What happened next in 2012?
Well, at the late-2012 top, the GDXJ closed at $87.83. Months later, it closed at $29.59, or roughly one third of its initial price. In other words, junior miners erased about two-thirds of their initial price. Yes, it was a great time for inversely trading instruments. The JDST wasn’t trading at that time yet, but DUST (which trades opposite to GDX) moved up by over 600%.
Even though the short-term outlook is somewhat unclear, the medium-term outlook for the precious metals sector remains very bearish, and the upside potential for the short positions in junior mining stocks remains enormous, in my opinion. In my view, patience is likely to be very well rewarded.
Having said that, let’s take a look at the markets from a more fundamental point of view.
The Fed Is Not Your Friend
While the bond market was the first to heed Fed officials’ warnings, the stock market is slowly realizing that seven to 12 rate hikes are not bullish for risk assets. However, the PMs have largely side-stepped the drama, and investors assume that what hurts other financial assets will not affect them. But with commodities likely the last shoe to drop when the Fed’s rate hike cycle truly unfolds, the central bank’s war on inflation should result in plenty of casualties.
To explain, the Consumer Price Index (CPI) is scheduled for release today, and another sizzling print will likely materialize. Moreover, with consumers’ inflation expectations ratcheting higher as well, the data supports several rate hikes in the coming months.
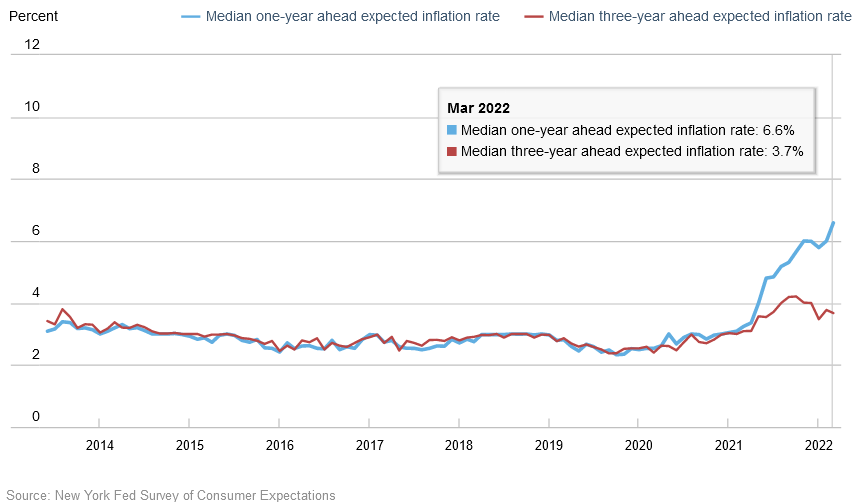
For example, the New York Fed released its Survey of Consumer Expectations on Apr. 11. The report revealed:
“Median one-year-ahead inflation expectations increased to a new series high of 6.6% from 6.0% in February, while median three-year ahead inflation expectations decreased to 3.7% from 3.8%. The increase in short-term expectations was broad-based across age, education, and income groups.”
Please see below:
In addition:
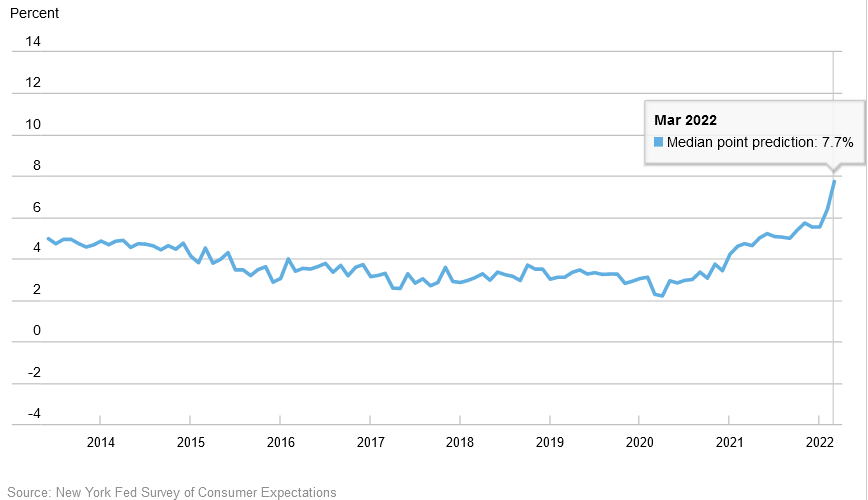
“Median year-ahead household spending growth expectations jumped by 1.3 percentage points to 7.7%, a new series high. The increase, the largest month-to-month increase in the series, was broad based but was largest for respondents with a college degree and with annual household incomes above $100,000.”
Please see below:
As a result, the Fed is further behind the inflation curve than at the end of 2021. Moreover, the PMs should find that all the hawkish fireworks that unfold in 2022 aren’t a cause for celebration.
To that point, CNBC and Momentive released their poll on financial literacy on Apr. 5. The report revealed: “The overwhelming majority of adults (76%) say they’re worried higher prices will force them to rethink their financial choices in the coming months.” In addition, “concerns run high as almost half (48%) of adults say they think about rising prices ‘all the time’.”
Please see below:
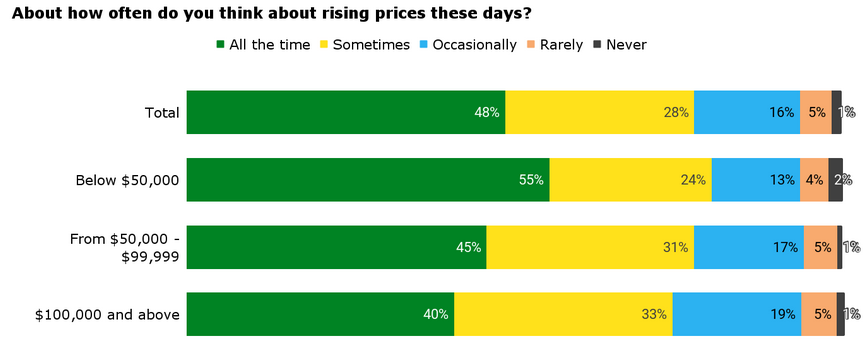 Source: CNBC/Momentive
Likewise, only 4% of respondents fear losing their job (the second last row), while concerns over gasoline, housing and food inflation claimed the top three spots. As such, the data highlights how the Fed’s dual mandate – maximum employment and price stability – are only half met. With achieving the latter likely to culminate with several rate hikes over the next few months, the responses are extremely bullish for Fed policy.
Please see below:
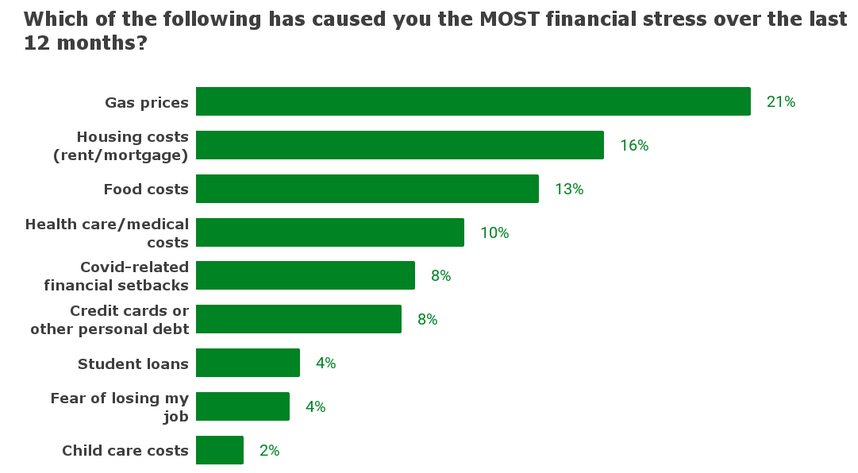 Source: CNBC/Momentive
More importantly, though. I’ve highlighted the political consequences of inflation on numerous occasions. For context, I wrote on Nov. 18:
The hyper-inflationists are missing the forest through the trees. In their argument, they assume that high U.S. debt levels makes raising interest rates impossible. As a result, the U.S. government will allow inflation to run rampant and the U.S. dollar will crash in the process. However, while it’s an interesting story, it’s unrealistic. And why is that?
Well, for one, not raising interest rates will likely do more harm to the U.S. economy than tightening monetary policy. If prices keep rising and consumer confidence keeps falling, eventually demand destruction unfolds. As a result, if policymakers don’t solve their inflationary conundrum, failure to do so will likely push the U.S. economy into recession.
Second, the political component shouldn’t be ignored. Biden’s approval ratings keep hitting new lows along with consumer confidence. Thus, is it in his best interest to maintain the status quo? Of course not. That’s why he’s been so forceful on inflation over the last few weeks. Essentially, if he (and/or the Fed) does nothing, he’ll likely lose the next presidential election and the Democrats will likely lose control of Congress. However, if he tames inflation, then he’s a hero. And left with those two options, which one do you think he’ll choose?
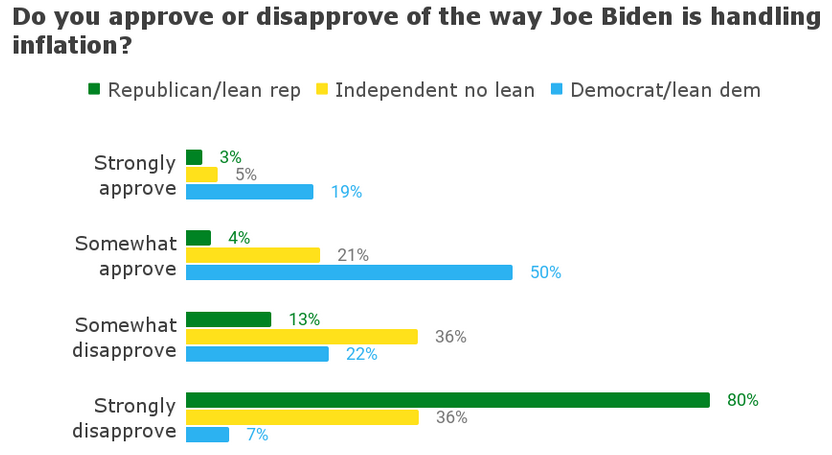
To that point, the survey revealed that “6 in 10 adults (61%) say they disapprove of the way President Biden is handling inflation, almost 10 points lower than Biden’s overall approval rating (52% disapprove; 45% approve).”
As a result, it’s no coincidence why the Fed has been more forceful on inflation in recent months. With the Democrats liable to lose their mid-term elections and Biden desperately needing to move the narrative in a positive direction, both are in precarious political positions. Therefore, even if the attempt fails and the Fed pushes the U.S. into a recession (which is likely), Biden has more to lose by doing nothing about inflation than doing something.
For context, independent voters decide elections (the yellow bars below), and with 72% of respondents either “somewhat” or “strongly” disapproving of Biden’s handling of the situation, it’s clear that the Fed has the green light to wage war on inflation.
Please see below:
 Source: CNBC/Momentive
On top of that, the Food and Agriculture Organization of the United Nations (FAO) revealed on Apr. 8 that “the FAO Food Price Index (FFPI) averaged 159.3 points in March 2022, up 17.9 points (12.6 percent) from February, making a giant leap to a new highest level since its inception in 1990. The latest increase reflects new all-time highs for vegetable oils, cereals and meat sub-indices, while those of sugar and dairy products also rose significantly.”
Please see below:
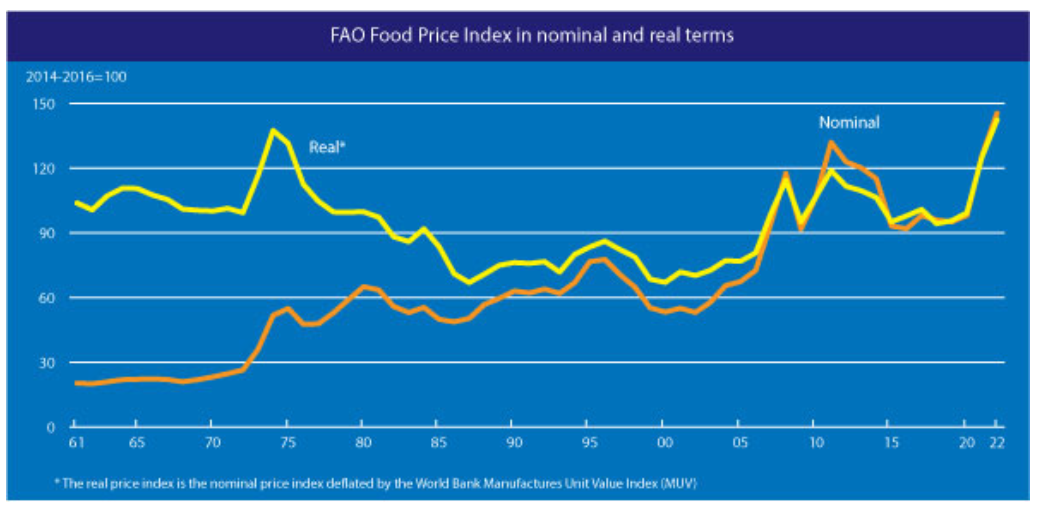 Source: FAO
Supporting the data, Conagra Brands released its third-quarter earnings on Apr. 7. For context, the company is home to products like Marie Callender's, Duncan Hines and Healthy Choice. CEO Sean Connolly said during the Q3 earnings call:
“Q3 total market inflation was 15.4% and negatively impacted operating margin by 10.6 percentage points in the quarter. This inflation level was higher than what we estimated when we discussed our outlook with you following Q2. And it's driven the additional pricing actions I just mentioned. The good news is that our 8.6% increase in price mix in sales translated to 5.7 percentage points of operating margin improvement in the quarter.”
Moreover:
“As we look to the remainder of the fiscal year, the environment isn't getting much easier in the near term. We now expect an additional $100 million of market inflation in Q4 (…). At the time of our Q2 call, we expected Q4 gross inflation of about 11%. Today, we expect a Q4 gross inflation of approximately 16%. On a two-year basis, Q4 gross inflation is expected to be an unprecedented 26%.”
Furthermore, CFO Dave Marberger didn’t mince words:
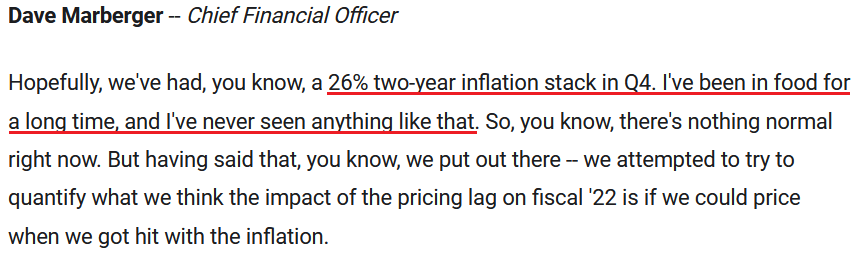 Source: Conagra Brands/ The Motley Fool
For the sake of objectivity, the Fed has an out in claiming that the Russia-Ukraine conflict spearheaded commodity prices (which have also uplifted the PMs) and that monetary policy can’t solve this problem. Therefore, raising interest rates will do little to fix food supply and demand dislocations.
However, while the argument has some merit, the reality is that there is too much money chasing too few goods. Moreover, with commodities acting like the new version of the ARK Innovation ETF, some futures contracts have traded like meme stocks. As such, the Fed needs to reduce excess liquidity to restore some sense of normalcy to the financial markets. Otherwise, investors will continue their all-time speculative activity, and when they do it with commodities, the impact on the real economy is profound.
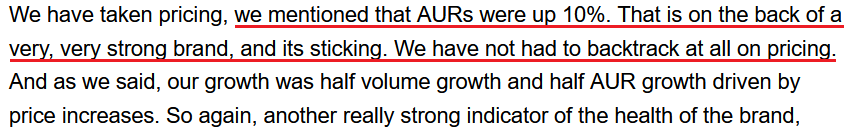
Furthermore, discretionary inflation is still unhinged. For example, Levi Strauss & Co. released its first-quarter earnings on Apr. 6. CEO Chip Bergh said:
“Our ability to effectively take price has enabled us to mitigate cost pressures, including inflation in inputs and logistics. These decisions are instructed by powerful proprietary technology and analytics, including artificial intelligence and methodical analysis of price elasticity.
“In fact, even as we have raised prices, consumer demand has continued to grow and Levi's brand unit volume has now returned to 2019 levels. We took select pricing actions last year as well as early this fiscal year and we believe there remains additional headroom to raise prices in parts of our portfolio through the balance of this year and beyond as we continue to innovate and lead trends.”
As a result, the denim brand is also outperforming the headline CPI. For context, average unit retail (AUR) tracks the average selling price for a company’s products.
Please see below:
 Source: Levi Strauss & Co./Seeking Alpha
The bottom line? Commodities (like the PMs) assume that they are exempt from the consequences of the Fed’s war on inflation. However, the data over the last few weeks only strengthens the case for the Fed to take an aggressive path. Therefore, while more than 10 Fed officials have already warned that several rate hikes are on the horizon, a profound shift in sentiment should materialize when the liquidity drain truly unfolds.
In conclusion, the PMs were mixed on Apr. 11, as they still haven’t gotten the Fed’s memo. However, with a higher U.S. federal funds rate and higher real yields likely a done deal, the bond market, and now the stock market, are pricing in this reality. As a result, while commodities are late to the party, they should suffer the same fate over the next few months.
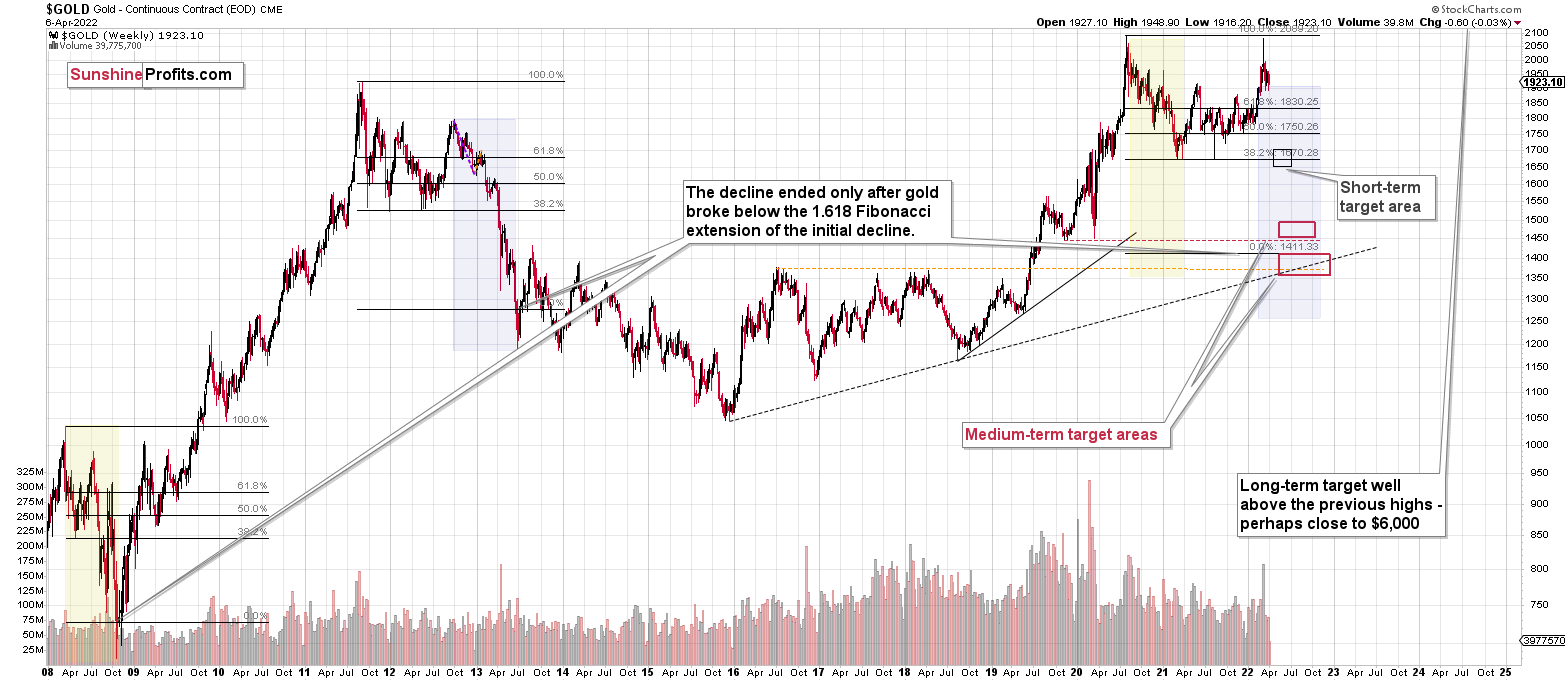
Overview of the Upcoming Part of the Decline
- It seems to me that the post-decline consolidation is now over or very close to being over , and that gold, silver, and mining stocks are now likely to continue their medium-term decline.
- It seems that the first (bigger) stop for gold will be close to its previous 2021 lows, slightly below $1,800 . Then it will likely correct a bit, but it’s unclear if I want to exit or reverse the current short position based on that – it depends on the number and the nature of the bullish indications that we get at that time.
- After the above-mentioned correction, we’re likely to see a powerful slide, perhaps close to the 2020 low ($1,450 - $1,500).
- If we see a situation where miners slide in a meaningful and volatile way while silver doesn’t (it just declines moderately), I plan to – once again – switch from short positions in miners to short positions in silver. At this time, it’s too early to say at what price levels this could take place, and if we get this kind of opportunity at all – perhaps with gold close to $1,600.
- I plan to exit all remaining short positions once gold shows substantial strength relative to the USD Index while the latter is still rallying. This may be the case with gold close to $1,350 - $1,400. I expect silver to fall the hardest in the final part of the move. This moment (when gold performs very strongly against the rallying USD and miners are strong relative to gold after its substantial decline) is likely to be the best entry point for long-term investments, in my view. This can also happen with gold close to $1,375, but at the moment it’s too early to say with certainty.
- As a confirmation for the above, I will use the (upcoming or perhaps we have already seen it?) top in the general stock market as the starting point for the three-month countdown. The reason is that after the 1929 top, gold miners declined for about three months after the general stock market started to slide. We also saw some confirmations of this theory based on the analogy to 2008. All in all, the precious metals sector is likely to bottom about three months after the general stock market tops.
- The above is based on the information available today, and it might change in the following days/weeks.
You will find my general overview of the outlook for gold on the chart below:
Please note that the above timing details are relatively broad and “for general overview only” – so that you know more or less what I think and how volatile I think the moves are likely to be – on an approximate basis. These time targets are not binding or clear enough for me to think that they should be used for purchasing options, warrants or similar instruments.
Summary
Summing up, despite the recent rally in gold, the outlook for junior mining stocks remains exactly as I described previously.
Crude oil’s extreme outperformance, the stock market’s weakness, and critical medium-term resistance levels reached by gold (all-time high!) and junior mining stocks – all indicate that the tops are at hand or have just formed.
Investing and trading are difficult. If it was easy, most people would be making money – and they’re not. Right now, it’s most difficult to ignore the urge to “run for cover” if you physically don’t have to. The markets move on “buy the rumor and sell the fact.” This repeats over and over again in many (all?) markets, and we have direct analogies to similar situations in gold itself. Junior miners are likely to decline the most, also based on the massive declines that are likely to take place (in fact, they have already started) in the stock markets.
From the medium-term point of view, the two key long-term factors remain the analogy to 2013 in gold and the broad head and shoulders pattern in the HUI Index. They both suggest much lower prices ahead.
It seems that our profits from short positions are going to become truly epic in the coming months.
After the sell-off (that takes gold to about $1,350-$1,500), I expect the precious metals to rally significantly. The final part of the decline might take as little as 1-5 weeks, so it's important to stay alert to any changes.
As always, we'll keep you - our subscribers - informed.
To summarize:
Trading capital (supplementary part of the portfolio; our opinion): Full speculative short positions (300% of the full position) in junior mining stocks are justified from the risk to reward point of view with the following binding exit profit-take price levels:
Mining stocks (price levels for the GDXJ ETF): binding profit-take exit price: $34.63; stop-loss: none (the volatility is too big to justify a stop-loss order in case of this particular trade)
Alternatively, if one seeks leverage, we’re providing the binding profit-take levels for the JDST (2x leveraged) and GDXD (3x leveraged – which is not suggested for most traders/investors due to the significant leverage). The binding profit-take level for the JDST: $14.98; stop-loss for the JDST: none (the volatility is too big to justify a SL order in case of this particular trade); binding profit-take level for the GDXD: $25.48; stop-loss for the GDXD: none (the volatility is too big to justify a SL order in case of this particular trade).
For-your-information targets (our opinion; we continue to think that mining stocks are the preferred way of taking advantage of the upcoming price move, but if for whatever reason one wants / has to use silver or gold for this trade, we are providing the details anyway.):
Silver futures downside profit-take exit price: $19.12
SLV profit-take exit price: $17.72
ZSL profit-take exit price: $38.28
Gold futures downside profit-take exit price: $1,683
HGD.TO – alternative (Canadian) inverse 2x leveraged gold stocks ETF – the upside profit-take exit price: $11.79
HZD.TO – alternative (Canadian) inverse 2x leveraged silver ETF – the upside profit-take exit price: $29.48
Long-term capital (core part of the portfolio; our opinion): No positions (in other words: cash
Insurance capital (core part of the portfolio; our opinion): Full position
Whether you already subscribed or not, we encourage you to find out how to make the most of our alerts and read our replies to the most common alert-and-gold-trading-related-questions.
Please note that we describe the situation for the day that the alert is posted in the trading section. In other words, if we are writing about a speculative position, it means that it is up-to-date on the day it was posted. We are also featuring the initial target prices to decide whether keeping a position on a given day is in tune with your approach (some moves are too small for medium-term traders, and some might appear too big for day-traders).
Additionally, you might want to read why our stop-loss orders are usually relatively far from the current price.
Please note that a full position doesn't mean using all of the capital for a given trade. You will find details on our thoughts on gold portfolio structuring in the Key Insights section on our website.
As a reminder - "initial target price" means exactly that - an "initial" one. It's not a price level at which we suggest closing positions. If this becomes the case (like it did in the previous trade), we will refer to these levels as levels of exit orders (exactly as we've done previously). Stop-loss levels, however, are naturally not "initial", but something that, in our opinion, might be entered as an order.
Since it is impossible to synchronize target prices and stop-loss levels for all the ETFs and ETNs with the main markets that we provide these levels for (gold, silver and mining stocks - the GDX ETF), the stop-loss levels and target prices for other ETNs and ETF (among other: UGL, GLL, AGQ, ZSL, NUGT, DUST, JNUG, JDST) are provided as supplementary, and not as "final". This means that if a stop-loss or a target level is reached for any of the "additional instruments" (GLL for instance), but not for the "main instrument" (gold in this case), we will view positions in both gold and GLL as still open and the stop-loss for GLL would have to be moved lower. On the other hand, if gold moves to a stop-loss level but GLL doesn't, then we will view both positions (in gold and GLL) as closed. In other words, since it's not possible to be 100% certain that each related instrument moves to a given level when the underlying instrument does, we can't provide levels that would be binding. The levels that we do provide are our best estimate of the levels that will correspond to the levels in the underlying assets, but it will be the underlying assets that one will need to focus on regarding the signs pointing to closing a given position or keeping it open. We might adjust the levels in the "additional instruments" without adjusting the levels in the "main instruments", which will simply mean that we have improved our estimation of these levels, not that we changed our outlook on the markets. We are already working on a tool that would update these levels daily for the most popular ETFs, ETNs and individual mining stocks.
Our preferred ways to invest in and to trade gold along with the reasoning can be found in the how to buy gold section. Furthermore, our preferred ETFs and ETNs can be found in our Gold & Silver ETF Ranking.
As a reminder, Gold & Silver Trading Alerts are posted before or on each trading day (we usually post them before the opening bell, but we don't promise doing that each day). If there's anything urgent, we will send you an additional small alert before posting the main one.
Thank you.
Przemyslaw Radomski, CFA
Founder, Editor-in-chief

