

Briefly: in our opinion, full (300% of the regular position size) speculative short positions in junior mining stocks are justified from the risk/reward point of view at the moment of publishing this Alert. We are adjusting the exit price levels for the current short position.
Miners moved higher yesterday – has the bottom been reached? Possibly, but it’s not clear enough to warrant long positions just yet.
Why? Because while the GDXJ is very close to its triangle-vertex-based reversal, it hasn’t reached its strong support level yet.
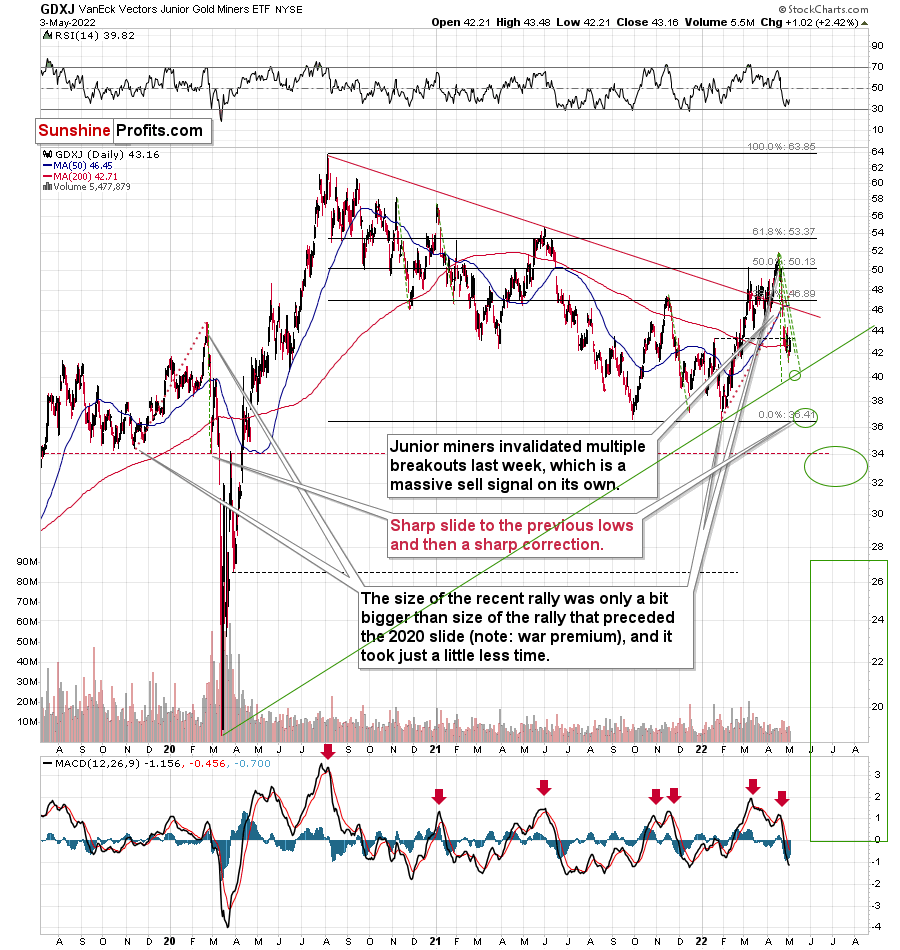
The rising green support line was not touched recently, and the RSI indicator didn’t reach the 30 level lately. Both price and the indicator were close, but not at their buy levels.
Today’s interest rate decision from the Fed could trigger sizable volatility, so it’s still quite possible that the GDXJ would reach its rising support line today. If it does, I’d expect a rebound to follow.
It’s also possible that this line will not be reached and that the corrective upswing in the GDXJ is already underway. If it is, please keep in mind that we don’t have to chase each and every correction, and that staying positioned to profit based on the huge medium-term decline is likely to bring us massive profits anyway (of course, nobody can promise anything with regard to market movements, so neither am I).
If the GDXJ doesn’t move to its rising support line, the risk/reward ratio would not be favorable enough for me to write about switching into long positions for a week or so. Instead, staying in the short position would be my preferred course of action.
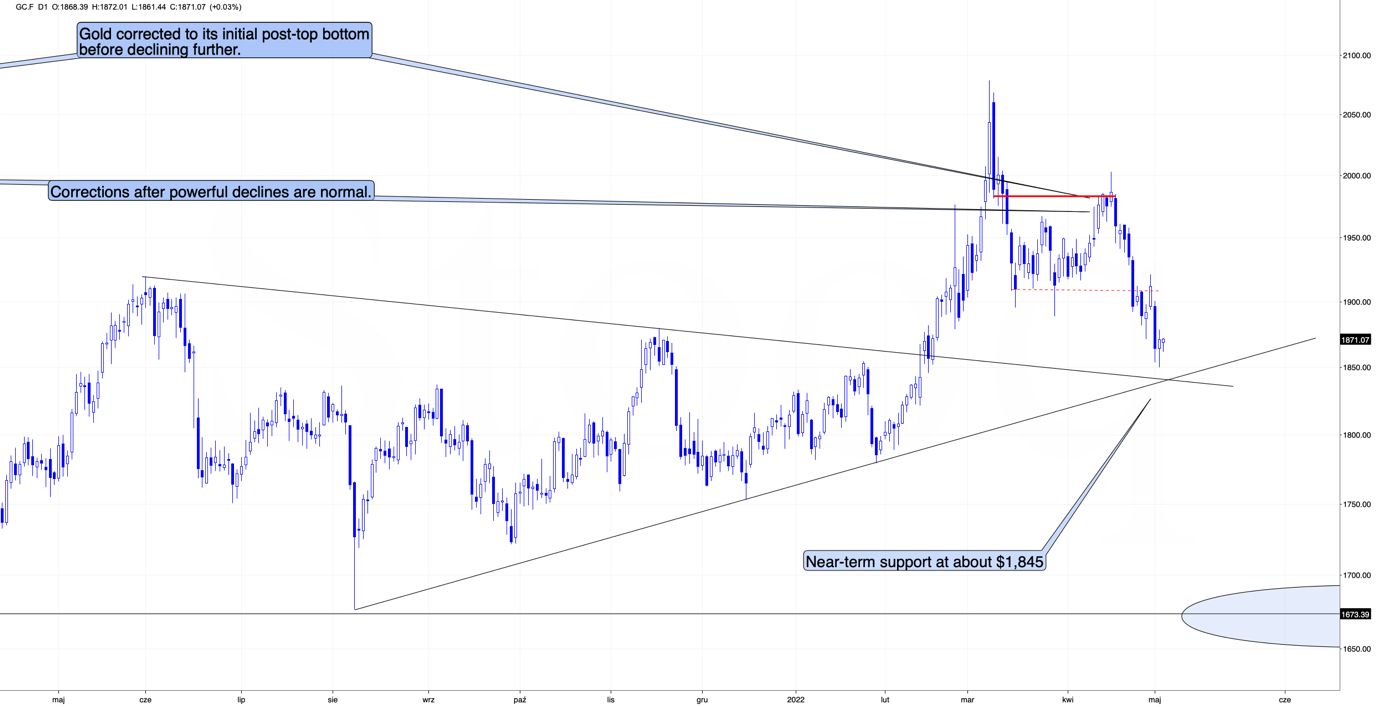
As far as gold is concerned, we see that its triangle-vertex-based reversal is today, so a move lower today and then back up (either today or tomorrow) is a quite likely scenario.
Having said that, let’s take a look at the markets from a fundamental point of view.
From Negative to Positive
It’s decision day for the Fed, as a 50 basis point rate hike is likely a done deal. Moreover, while the PMs may record a short-term relief rally, their medium-term fundamentals continue to deteriorate.
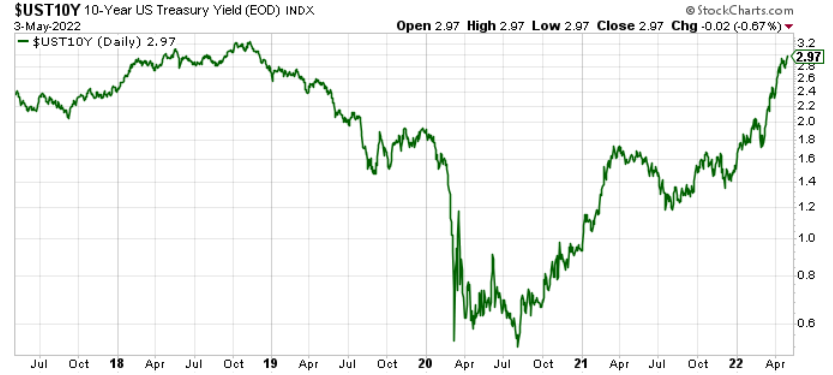
For example, I’ve been warning for some time that higher interest rates would manifest amid rampant inflation, and – surprise, surprise – the U.S. 10-Year Treasury yield has continued its ascent. Furthermore, while the Treasury benchmark eclipsed 3% intraday on May 3, a close above the key psychological level should occur sooner rather than later.
Please see below:
To explain why, I wrote on Apr. 20:
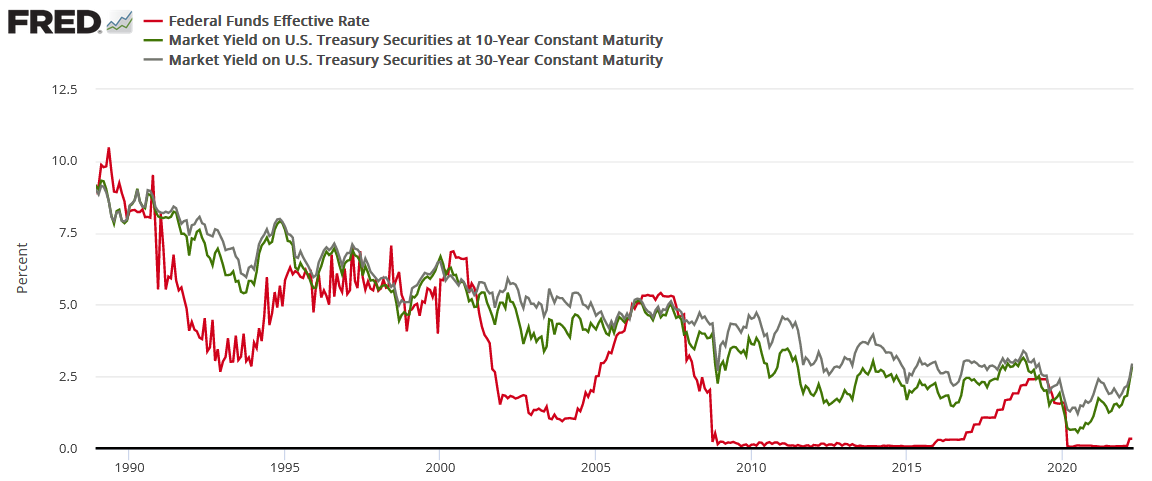
The red line above tracks the U.S. federal funds rate, while the green and gray lines above track the U.S. 10-Year and 30-Year Treasury yields. If you analyze the connection, you can see that the latter two often take their orders from the former. In a nutshell: when the Fed raises interest rates, it takes several hikes of 0.25% before long-term yields rollover. For example:
- In 2018, the U.S. 10-Year Treasury yield peaked after ~9 rate hikes.
- In 2006, the U.S. 10-Year Treasury yield peaked after ~17 rate hikes.
- In 2000, the U.S. 10-Year Treasury yield peaked after ~7 rate hikes.
- In 1994, the U.S. 10-Year Treasury yield peaked after ~12 rate hikes.
Thus, with modern history showcasing that the U.S. 10-Year Treasury yield doesn't peak until the Fed is well within its rate hike cycle, please remember that the Fed has only hiked once. Therefore, with seven rate hikes as the minimum to elicit a peak over the last ~28 years, the U.S. 10-Year Treasury yield should have room to run, and this is bullish for real yields and bearish for gold.
Speaking of real yields, with nominal interest rates rising and breakeven inflation rates falling, the U.S. 10-Year real yield closed at 0.18% on May 2 and 0.15% on May 3. As a result, the PMs confront a fundamental time bomb that should blow up their performance over the next few months.
Please see below:
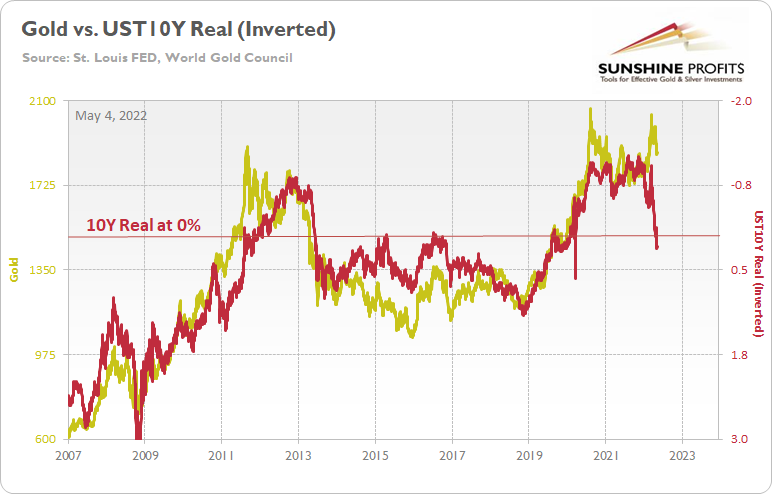
To explain, the gold line above tracks the price tallied by the World Gold Council, while the red line above tracks the inverted U.S. 10-Year real yield. For context, inverted means that the latter's scale is flipped upside down and that a rising red line represents a falling U.S. 10-Year real yield, while a falling red line represents a rising U.S. 10-Year real yield.
For more context, I wrote on Apr. 11:
If you analyze the left side of the chart, you can see that the U.S. 10-Year real yield soared and gold plunged during the global financial crisis (GFC). However, when the Fed launched QE and the U.S. 10-Year real yield sank to an all-time low, gold hit a new all-time high along the way.
Furthermore, the current situation is a spitting image. When Fed Chairman Jerome Powell performed a dovish pivot in late 2018, the U.S. 10-Year real yield suffered. Then, when the Fed fired its liquidity bazooka in March 2020, it pushed the metric to another all-time low. And surprise, surprise, gold hit another all-time high.
However, with the Fed normalizing policy, the U.S. 10-Year real yield has surged in recent weeks. Moreover, the Fed needs to push the metric above 0% to curb inflation.
Thus, it's likely only a matter of time until the milestone is achieved. In addition, a U.S. 10-Year real yield of 0% implies a gold price of $1,500, and while the current narrative suggests otherwise, is this time really different?
To that point, while gold has suffered in recent days, the current price is still well above its medium-trend-based value. Likewise, since the GDXJ ETF is much more volatile than the yellow metal, and therefore, should decline even more, epic drawdowns should materialize if (once) the two lines reconnect (not necessarily in the immediate aftermath of the rate hike, as PMs could rally based on the move-on-the-rumor-reverse-on-the-fact tendency).
For example, while these events take time to unfold, history shows that the “this time is different” crowd ends up losing more than just their pride. I first highlighted the epic divergence between the U.S. 10-Year Treasury yield and the U.S. 10-Year breakeven inflation rate on May 11, 2021. I wrote:
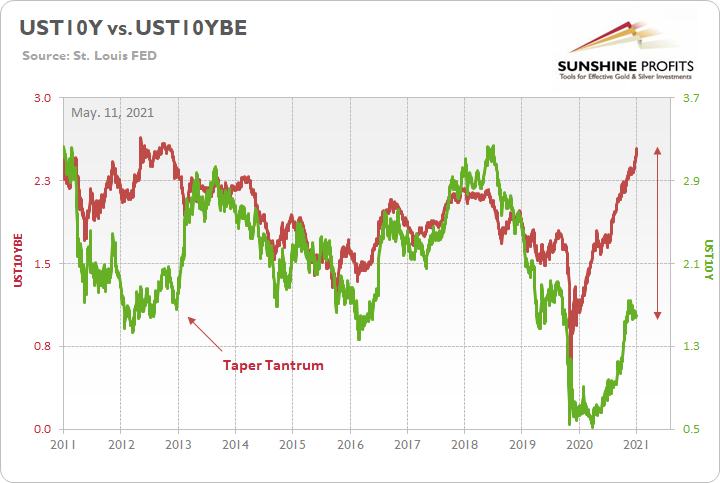
To explain, the green line above tracks the U.S. 10-Year Treasury yield, while the red line above tracks the U.S. 10-Year breakeven inflation rate. If you analyze the left side of the chart, you can see that when the bond market finally snapped in 2013, the U.S. 10-Year Treasury yield’s surge was fast and furious. More importantly, though, if you analyze the right side of the chart, you can see that today’s gap makes 2013 look like an appetizer. As a result, with material divergences often reversing in violent fashion, it’s only a matter of time until the next earthquake erupts.
Therefore, while the fundamental thesis didn’t materialize overnight, the two lines eventually reconnected; the U.S. 10-Year Treasury yield surpassed the U.S. 10-Year breakeven inflation rate, and the U.S. 10-Year real yield turned positive.
However, now it’s the gap between gold and the U.S. 10-Year real yield that makes 2011 look like an appetizer, and the same outcome should occur. As a result, the prospect is profoundly bearish for the PMs.
Conversely, with bonds oversold and the stock market nearing a breaking point, investors continue to ask: “Where is the Fed put?” For context, put options are like insurance contracts, and they protect investors when drawdowns occur. In a nutshell: investors expect the Fed to step in, turn dovish, and save stock market investors from their poor valuation decisions.
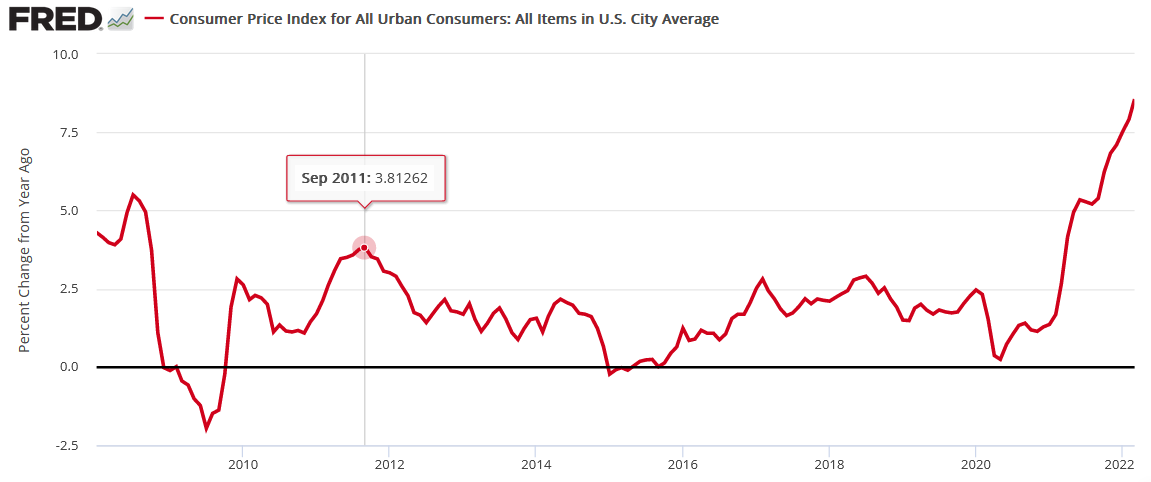
However, the prospect is far-fetched, and here is why. Following the global financial crisis (GFC), the Fed ran to the rescue whenever the stock market threw a tantrum. As such, investors with short memories assume that the post-GFC script is the right analog. Yet, they fail to realize that the year-over-year (YoY) percentage change in the headline Consumer Price Index (CPI) peaked at 3.81% in September 2011. Thus, the Fed could ease without worrying about stoking inflation.
Conversely, with the headline CPI at ~8.6% YoY now, the game has completely changed.
Please see below:
Second, the other half of the Fed’s dual mandate is maximum employment. With U.S. job openings hitting an all-time high of 11.549 million on May 3 (March results), the data is extremely bullish for Fed policy. For context, the consensus estimate was 11 million.
 Source: Investing.com
More importantly, though, another resilient report means that there are now 5.597 million more job openings in the U.S. than citizens unemployed, also an all-time high.
Please see below:
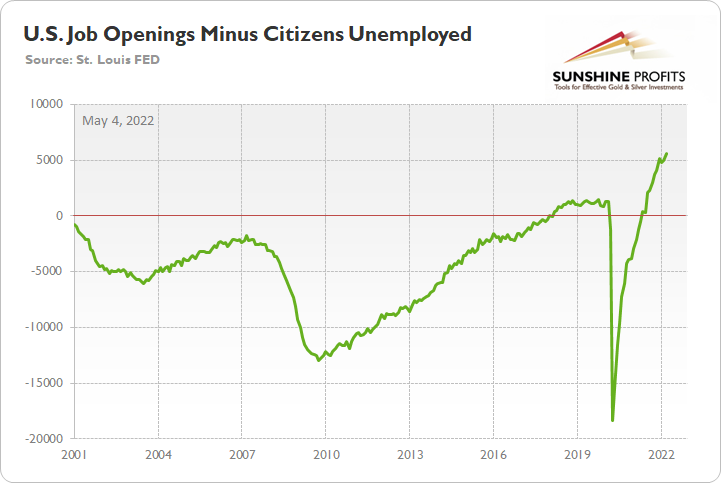
To explain, the green line above subtracts the number of unemployed U.S. citizens from the number of U.S. job openings. If you analyze the right side of the chart, you can see that the epic collapse has completely reversed and the green line is at a record high. Thus, with more jobs available than people looking for work, the economic environment supports normalization by the Fed.
Again, please consider the CPI data above with the job openings spread post-GFC. The period had well-anchored inflation and unemployed citizens outnumbered job openings until 2018. That’s nothing like the current environment. Furthermore, can you notice how the spread’s outperformance helped spur the Fed’s most recent rate hike cycle?
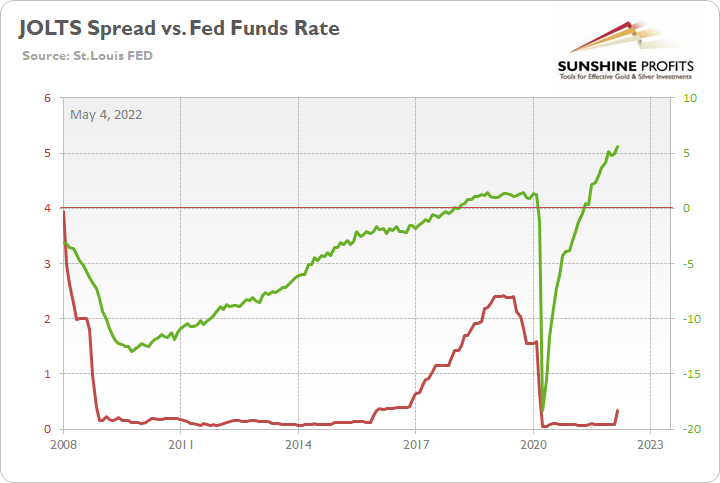
To explain, the green line above tracks the job openings spread, while the red line above tracks the U.S. federal funds rate. If you analyze the relationship, you can see that the spread’s move toward neutral was a hawkish indicator.
Likewise, with the spread positive and at an all-time high, the data alone justifies several rate hikes. However, as mentioned, we also have a YoY headline CPI that’s at its highest level since the 1980s. Thus, if investors assume the Fed lacks the ammunition to follow through with its hawkish promises, they should suffer the same fate as the “transitory” camp did in 2021/2022.
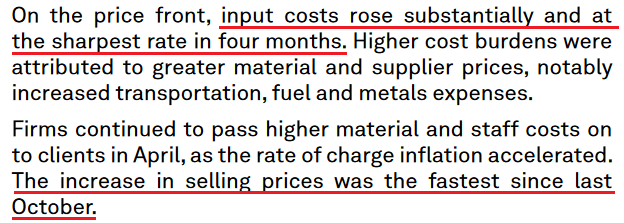
Finally, S&P Global released its U.S. Manufacturing PMI on May 2. The report revealed:
“Operating conditions improved markedly across the U.S. manufacturing sector, according to April PMI data from S&P Global…. New orders increased at a marked pace at the start of the second quarter, and at a rate broadly in line with that seen in March. Companies reported stronger demand conditions, with some noting that new sales expanded despite
substantial rises in prices. Meanwhile, new export orders grew at the fastest rate for
almost a year.”
Also noteworthy:
“Manufacturers recorded a solid rise in employment in April. Workforce numbers grew following greater production requirements and in response to staff leaving voluntarily. Some firms also stated that job creation was linked to the filling of long-held vacancies. Labor
shortages continued to be mentioned as a weight on growth, however.”
More importantly, though:
 Source: S&P Global
The bottom line? While investors continue to pray for a dovish pivot, they’re likely in for a rude awakening. The U.S. labor market remains abnormally hot, and the latest PMI data shows that inflation is still accelerating. Moreover, while real yields have turned positive, they have done little to cool a U.S. economy that’s flooded with too much stimulus. As a result, with a hawkish Fed poised to push the U.S. 10-Year real yield even higher over the medium term, the PMs should suffer mightily as the drama unfolds.
In conclusion, the PMs rallied on May 3, as sentiment doesn’t die easily. However, while the technical backdrop could support a short-term rally, the PMs’ medium-term technicals and fundamentals are profoundly bearish. Therefore, investors’ optimism should turn to pessimism over the next few months.
Overview of the Upcoming Part of the Decline
- It seems to me that the post-decline consolidation is now over or very close to being over , and that gold, silver, and mining stocks are now likely to continue their medium-term decline.
- It seems that the first ( bigger ) stop for gold will be close to its previous 2021 lows, slightly below $1,800 . Then it will likely correct a bit, but it’s unclear if I want to exit or reverse the current short position based on that – it depends on the number and the nature of the bullish indications that we get at that time.
- After the above-mentioned correction, we’re likely to see a powerful slide, perhaps close to the 2020 low ($1,450 - $1,500).
- If we see a situation where miners slide in a meaningful and volatile way while silver doesn’t (it just declines moderately), I plan to – once again – switch from short positions in miners to short positions in silver. At this time, it’s too early to say at what price levels this could take place, and if we get this kind of opportunity at all – perhaps with gold close to $1,600.
- I plan to exit all remaining short positions once gold shows substantial strength relative to the USD Index while the latter is still rallying. This may be the case with gold close to $1,350 - $1,400. I expect silver to fall the hardest in the final part of the move. This moment (when gold performs very strongly against the rallying USD and miners are strong relative to gold after its substantial decline) is likely to be the best entry point for long-term investments, in my view. This can also happen with gold close to $1,375, but at the moment it’s too early to say with certainty.
- As a confirmation for the above, I will use the (upcoming or perhaps we have already seen it?) top in the general stock market as the starting point for the three-month countdown. The reason is that after the 1929 top, gold miners declined for about three months after the general stock market started to slide. We also saw some confirmations of this theory based on the analogy to 2008. All in all, the precious metals sector is likely to bottom about three months after the general stock market tops.
- The above is based on the information available today, and it might change in the following days/weeks.
You will find my general overview of the outlook for gold on the chart below:
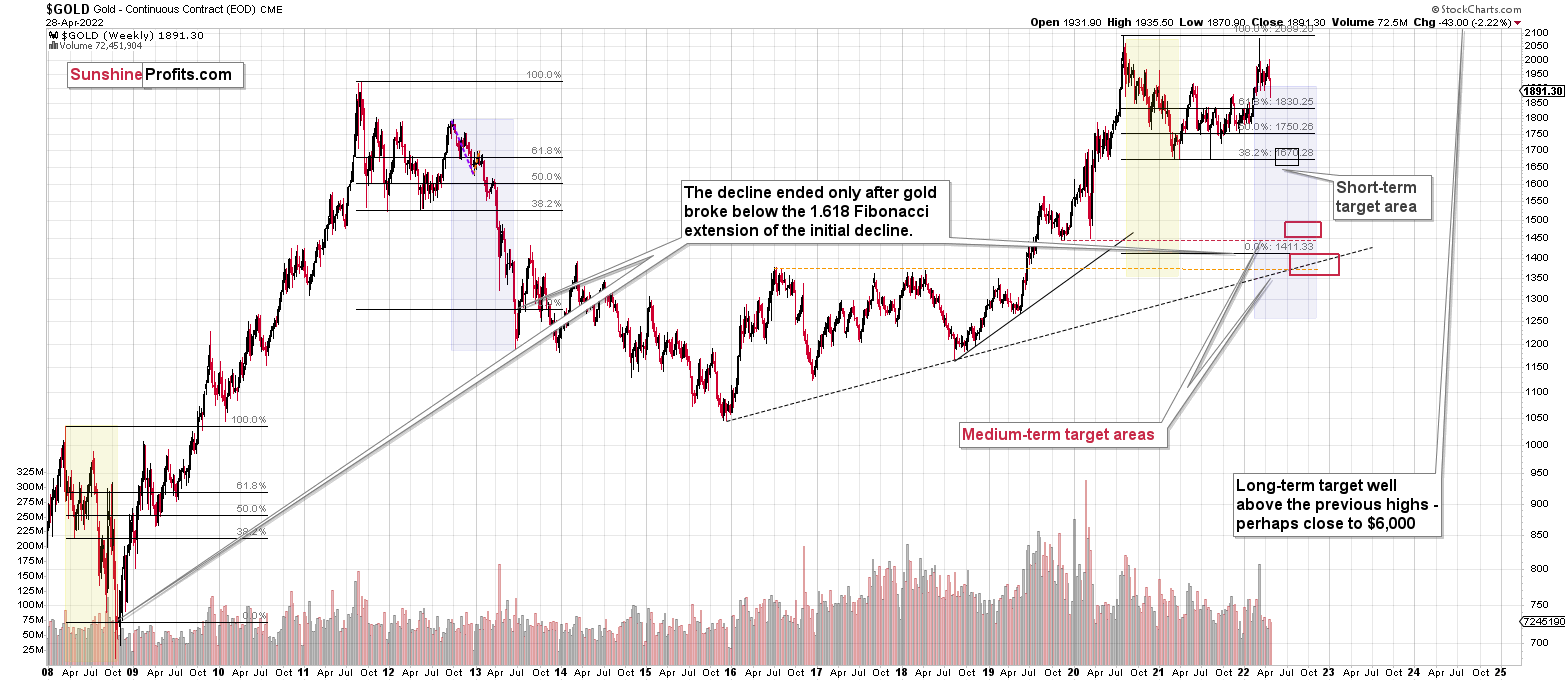
Please note that the above timing details are relatively broad and “for general overview only” – so that you know more or less what I think and how volatile I think the moves are likely to be – on an approximate basis. These time targets are not binding or clear enough for me to think that they should be used for purchasing options, warrants or similar instruments.
Summary
Summing up, it seems that we are about to see a short-term corrective upswing in the precious metals sector, even though the medium-term trend remains clearly down.
The medium-term downtrend is likely to continue shortly (perhaps after a weekly or a few-day long correction) as investors are starting to wake up to the reality, the precious metals sector (in particular junior mining stocks) is declining sharply. The following are the key asp0ects of the reality that the market participants have been ignoring:
- rising real interest rates,
- rising USD Index values.
Both of the aforementioned are the two most important fundamental drivers of the gold price. Since neither the USD Index nor real interest rates are likely to stop rising anytime soon (especially now that inflation has become highly political), the gold price is likely to fall sooner or later. Given the analogy to 2012 in gold, silver, and mining stocks, “sooner” is the more likely outcome.
It seems that our profits from short positions are going to become truly epic in the coming months.
For now, I’m adjusting the exit price levels. Please note that they are “binding exit prices”, which means that I think that exiting the short positions without an additional (manual) confirmation from me is a good idea. I think that once these short positions are closed, entering long ones (100% of the regular position size) is also a good idea. If one wants to use a leveraged ETF for this long trade, the JNUG might be worth considering. However, it seems that in most cases, simply using the GDXJ would be sufficient (I’m writing about 100% of the regular position size, not 200% or 300% as I am right now in the case of the short positions). Then again, it’s your capital, and you can do with it whatever you want and are comfortable with.
Of course, if you’re not comfortable with such short-term trading, you can ignore this quick trade and focus on the bigger downturn.
After the final sell-off (that takes gold to about $1,350-$1,500), I expect the precious metals to rally significantly. The final part of the decline might take as little as 1-5 weeks, so it's important to stay alert to any changes.
As always, we'll keep you – our subscribers – informed.
To summarize:
Trading capital (supplementary part of the portfolio; our opinion): Full speculative short positions (300% of the full position) in junior mining stocks are justified from the risk to reward point of view with the following binding exit profit-take price levels:
Mining stocks (price levels for the GDXJ ETF): binding profit-take exit price: $40.62; stop-loss: none (the volatility is too big to justify a stop-loss order in case of this particular trade)
Alternatively, if one seeks leverage, we’re providing the binding profit-take levels for the JDST (2x leveraged) and GDXD (3x leveraged – which is not suggested for most traders/investors due to the significant leverage). The binding profit-take level for the JDST: $9.83; stop-loss for the JDST: none (the volatility is too big to justify a SL order in case of this particular trade); binding profit-take level for the GDXD: $12.48; stop-loss for the GDXD: none (the volatility is too big to justify a SL order in case of this particular trade).
For-your-information targets (our opinion; we continue to think that mining stocks are the preferred way of taking advantage of the upcoming price move, but if for whatever reason one wants / has to use silver or gold for this trade, we are providing the details anyway.):
Silver futures downside profit-take exit price: $21.63
SLV profit-take exit price: $20.14
ZSL profit-take exit price: $27.89
Gold futures downside profit-take exit price: $1,853
HGD.TO – alternative (Canadian) inverse 2x leveraged gold stocks ETF – the upside profit-take exit price: $6.79
HZD.TO – alternative (Canadian) inverse 2x leveraged silver ETF – the upside profit-take exit price: $21.47
Long-term capital (core part of the portfolio; our opinion): No positions (in other words: cash
Insurance capital (core part of the portfolio; our opinion): Full position
Whether you already subscribed or not, we encourage you to find out how to make the most of our alerts and read our replies to the most common alert-and-gold-trading-related-questions.
Please note that we describe the situation for the day that the alert is posted in the trading section. In other words, if we are writing about a speculative position, it means that it is up-to-date on the day it was posted. We are also featuring the initial target prices to decide whether keeping a position on a given day is in tune with your approach (some moves are too small for medium-term traders, and some might appear too big for day-traders).
Additionally, you might want to read why our stop-loss orders are usually relatively far from the current price.
Please note that a full position doesn't mean using all of the capital for a given trade. You will find details on our thoughts on gold portfolio structuring in the Key Insights section on our website.
As a reminder - "initial target price" means exactly that - an "initial" one. It's not a price level at which we suggest closing positions. If this becomes the case (like it did in the previous trade), we will refer to these levels as levels of exit orders (exactly as we've done previously). Stop-loss levels, however, are naturally not "initial", but something that, in our opinion, might be entered as an order.
Since it is impossible to synchronize target prices and stop-loss levels for all the ETFs and ETNs with the main markets that we provide these levels for (gold, silver and mining stocks - the GDX ETF), the stop-loss levels and target prices for other ETNs and ETF (among other: UGL, GLL, AGQ, ZSL, NUGT, DUST, JNUG, JDST) are provided as supplementary, and not as "final". This means that if a stop-loss or a target level is reached for any of the "additional instruments" (GLL for instance), but not for the "main instrument" (gold in this case), we will view positions in both gold and GLL as still open and the stop-loss for GLL would have to be moved lower. On the other hand, if gold moves to a stop-loss level but GLL doesn't, then we will view both positions (in gold and GLL) as closed. In other words, since it's not possible to be 100% certain that each related instrument moves to a given level when the underlying instrument does, we can't provide levels that would be binding. The levels that we do provide are our best estimate of the levels that will correspond to the levels in the underlying assets, but it will be the underlying assets that one will need to focus on regarding the signs pointing to closing a given position or keeping it open. We might adjust the levels in the "additional instruments" without adjusting the levels in the "main instruments", which will simply mean that we have improved our estimation of these levels, not that we changed our outlook on the markets. We are already working on a tool that would update these levels daily for the most popular ETFs, ETNs and individual mining stocks.
Our preferred ways to invest in and to trade gold along with the reasoning can be found in the how to buy gold section. Furthermore, our preferred ETFs and ETNs can be found in our Gold & Silver ETF Ranking.
As a reminder, Gold & Silver Trading Alerts are posted before or on each trading day (we usually post them before the opening bell, but we don't promise doing that each day). If there's anything urgent, we will send you an additional small alert before posting the main one.
Thank you.
Przemyslaw Radomski, CFA
Founder, Editor-in-chief

