

Briefly: in our opinion, full (300% of the regular position size) speculative short positions in junior mining stocks are justified from the risk/reward point of view at the moment of publishing this Alert.
In my last technical message, I wrote that the most likely scenario for this week was one in which our target level would not (yet) be reached – and it wasn’t. We saw a countertrend rebound, thanks to which gold and mining stocks verified their previous breakdowns. The fact that it was all that happened despite a huge short-term decline in the USD Index emphasizes just how weak the precious metals sector is right now. In other words, last week confirmed the bearish narrative for the following weeks.
Moreover, based on what happened in the above markets and in the general stock market, it seems that we might not need to wait too long for the real action to take place. Let’s start today’s technical analysis with gold.
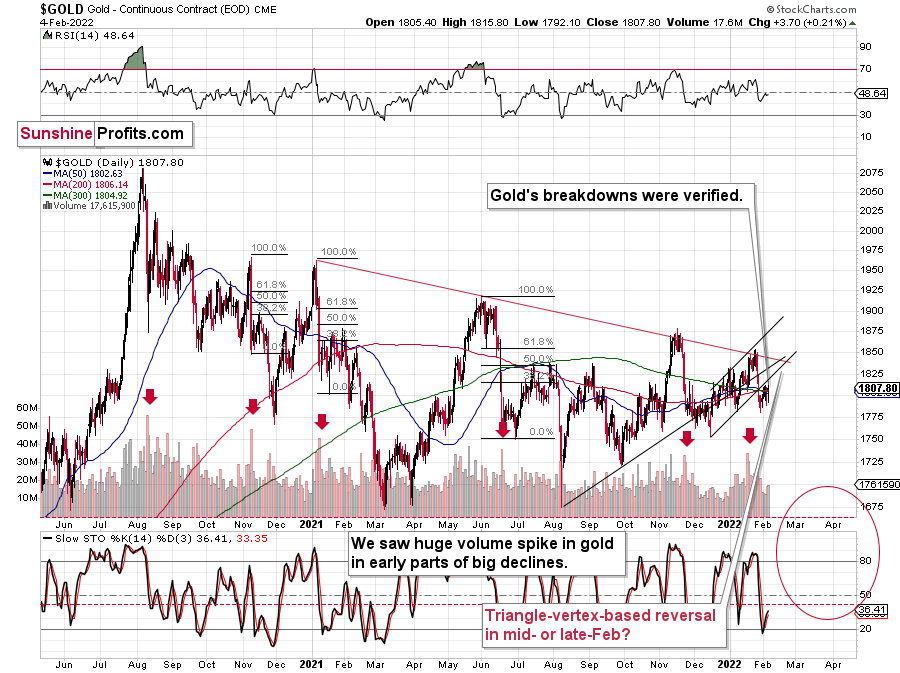
What we saw recently was a rather small upswing on relatively small volume. Low volume, combined with the small size of the rally, indicates that this move is not really important.
What’s more important, however, is that the move higher didn’t take gold back above any of the rising support lines. This means that the breakdowns below them were verified, and the previous support levels became resistance levels.
Overall, what happened on the above chart last week simply isn’t bullish.
The same goes for mining stocks.
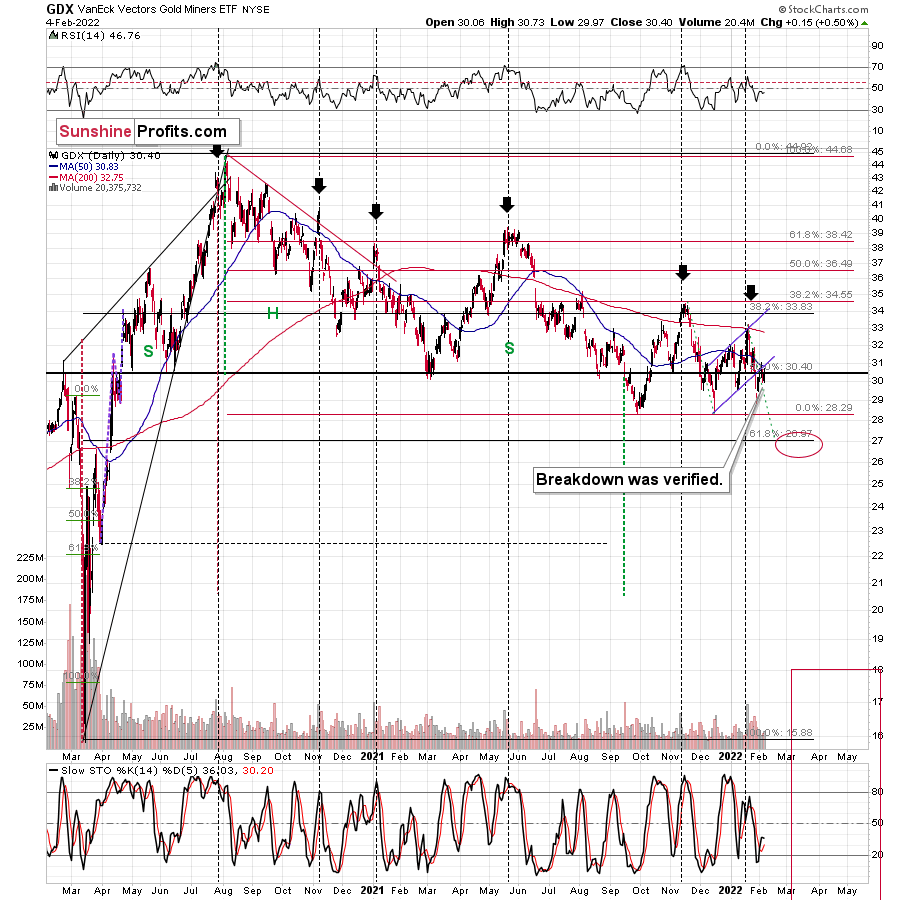
After breaking below the rising blue trend channel, miners moved back to it (even slightly above the lower border), and then ended the week below the channel. This means that the breakdown below was verified, and the bearish implications of the breakdown remain intact.
The GDX ETF also verified the breakdown below its 50-day moving average.
Just as gold did, miners moved higher on volume that was relatively small.
Overall, miners confirm gold’s indications. Namely, what we saw last week was just a counter-trend bounce, not the start of a bigger rally.
Maybe the junior miners will provide us with adverse indications? Let’s check.
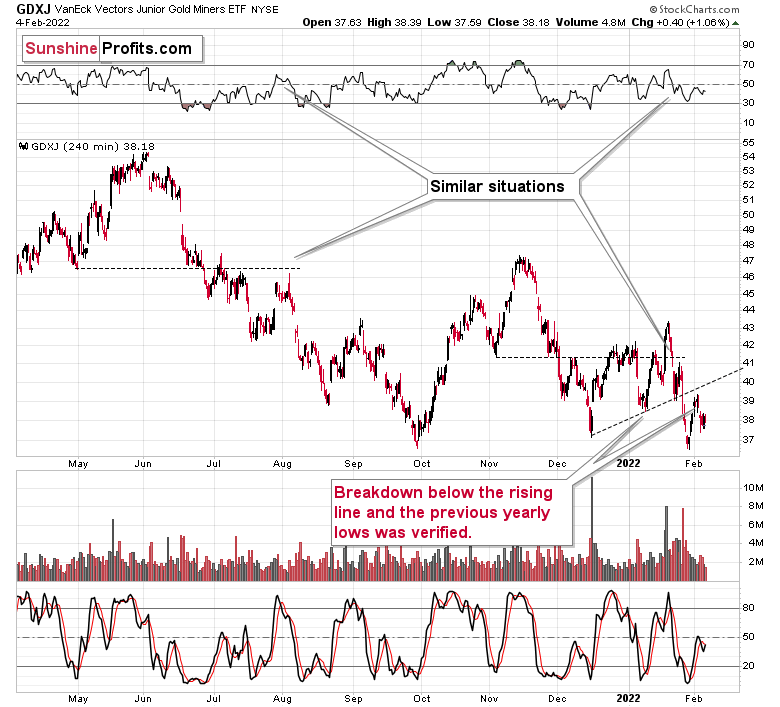
Nope. Junior miners provide us with the same indication.
The recent upswing materialized on relatively low volume, and it didn’t take junior miners back above the previously broken support line, thus verifying it as resistance.
Silver didn’t rally significantly either.
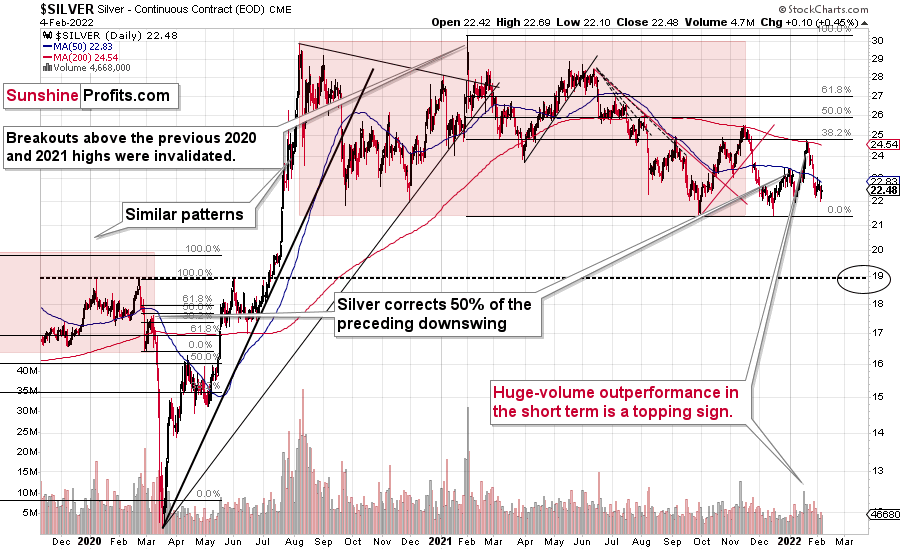
In fact, silver’s corrective upswing was barely visible.
The most bearish fact about all this is the context. It was the week when the USD Index declined by almost 2 index points!
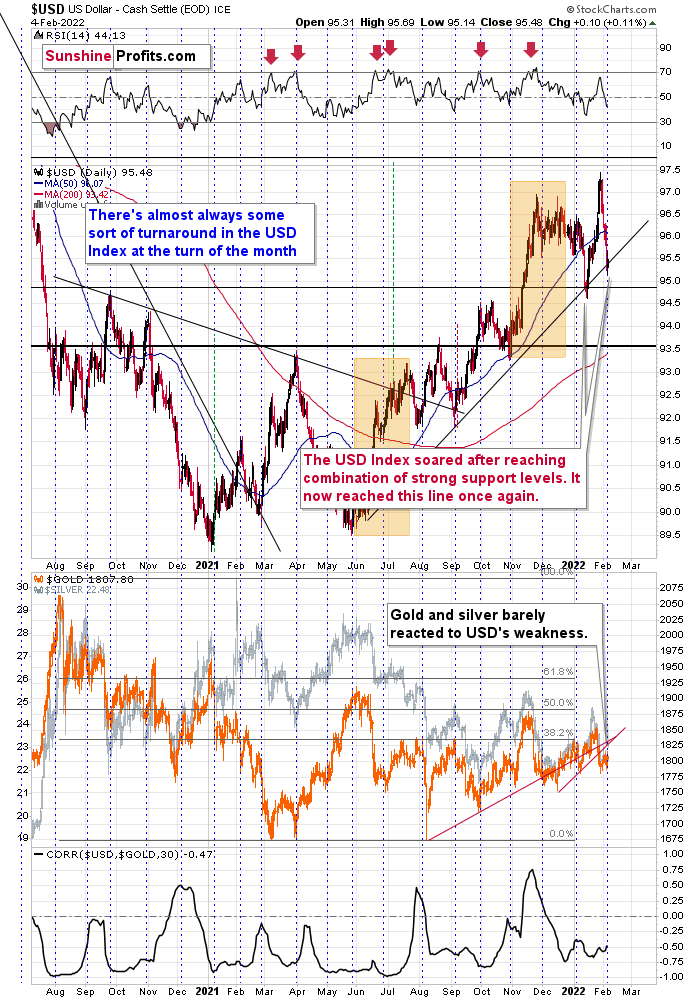
The USD Index declined profoundly, but despite the small attempt, it didn’t end the week below the rising, medium-term support line. That’s the same line that triggered the previous profound rally. As long as this line remains unbroken, it continues to support higher prices (that’s why it’s called a support line, after all).
There’s one more factor pointing to a likely reversal – the aspect of time. The USD Index tends to reverse close to the turn of the month, and there’s no doubt that the most recent short-term move was to the downside. Consequently, the implications of the likely turnaround are bullish.
The most important thing, however, is not the USD Index itself, but the fact that gold, silver, and mining stocks have almost stopped reacting to its declines, and are now reacting to its rallies. This means that the likely short-term upside for the precious metals sector is very limited, and the downside for it is huge.
The recent movement in the PMs is also weak when compared to what happened in the general stock market.
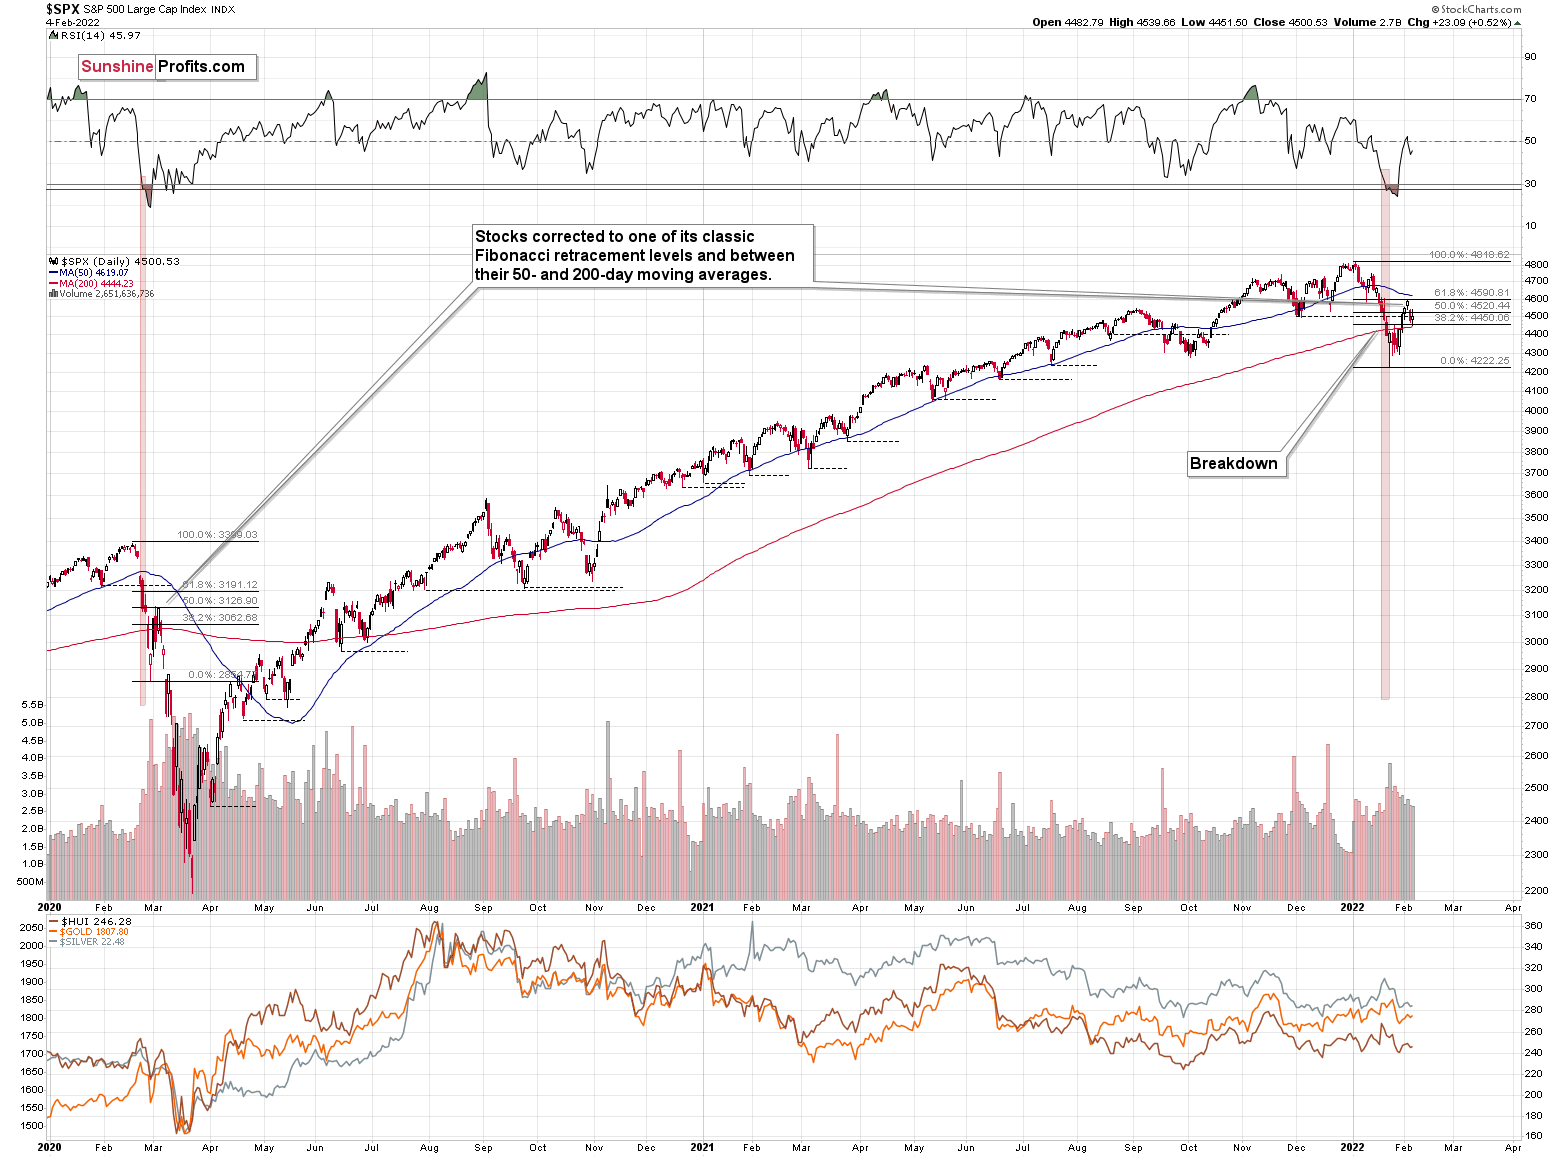
Stocks corrected, similarly to what they did in early 2020. Back then, stocks corrected 50% of the previous decline, and now they corrected 61.8% of it. It’s not identical, but similar.
As I had indicated earlier, the decline this time is not as sharp, but it’s likely to be huge nonetheless.
Indeed, what had taken several days in February 2020, took weeks in 2022. What does it mean going forward? It means that if the similarity between now and 2020 continues, we can expect a significant move lower in the following weeks and months. The situation is rather unclear when it comes to making forecasts for “days”.
OK, but what does it mean for the precious metals market?
In short, it means that the precious metals market is likely to decline too. In particular, mining stocks (especially junior miners) and silver are likely to be affected to the greatest extent.
It might be the case that we see mining stocks decline faster early on and then we see a bigger catch up in silver. It’s an “if” – they might all decline similarly. However, if the above happens, it will provide us with a great opportunity to switch from short positions in junior mining stocks to short positions in silver, in order to boost our profits even further.
All in all, it seems that they (gold, silver, and mining stocks) are going to decline in the following weeks and that we won’t have to wait for the decline to start too long.
Having said that, let’s take a look at the markets from a more fundamental point of view.
A Real Problem
As volatility erupts across the financial markets, gold and silver prices are being pulled in conflicting directions. For example, with the USD Index suffering a short-term decline, the outcome is fundamentally bullish for the precious metals. However, with U.S. Treasury yields rallying, the outcome is fundamentally bearish for gold and silver prices. Then, with panic selling and panic buying confronting the general stock market, the PMs are dealing with those crosscurrents.
However, with QE on its deathbed and the Fed poised to raise the Federal Funds Rate in the coming months, the common denominator is rising real interest rates. To explain, the euro’s recent popularity has impacted the USD Index. For context, the EUR/USD accounts for nearly 58% of the dollar basket’s movement. Thus, if real interest rates rise and the U.S. dollar falls, what will happen to the PMs?
Well, the reality is that rising real interest rates are bullish for the USD Index, and the euro’s recent ECB-induced rally is far from a surprise. With investors often buying the EUR/USD in anticipation of a hawkish shift from the ECB, another ‘hopeful’ upswing occurred. However, the central bank disappointed investors time and time again in 2021, and the currency pair continued to make new lows. As a result, we expect the downtrend to resume over the medium term.
Supporting our expectations, I wrote the following about financial conditions and the USD Index on Feb. 2:
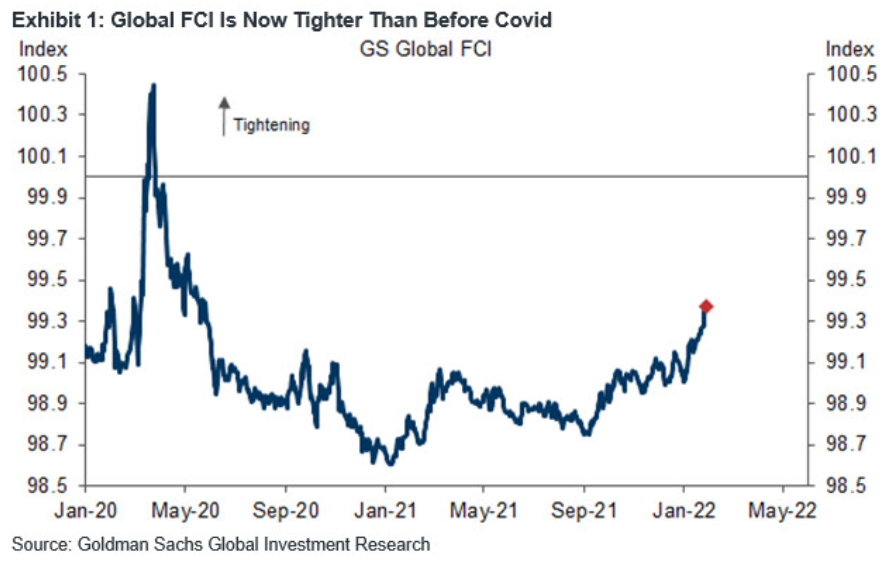
To explain, the blue line above tracks Goldman Sachs' Financial Conditions Index (FCI). For context, the index is calculated as a "weighted average of riskless interest rates, the exchange rate, equity valuations, and credit spreads, with weights that correspond to the direct impact of each variable on GDP." In a nutshell: when interest rates increase alongside credit spreads, it's more expensive to borrow money and financial conditions tighten.
To that point, if you analyze the right side of the chart, you can see that the FCI has surpassed its pre-COVID-19 high (January 2020). Moreover, the FCI bottomed in January 2021 and has been seeking higher ground ever since. In the process, it's no coincidence that the PMs have suffered mightily since January 2021. To that point, with the Fed poised to raise interest rates at its March monetary policy meeting, the FCI should continue its ascent. As a result, the PMs' relief rallies should fall flat like in 2021.
Likewise, while the USD Index has come down from its recent high, it's no coincidence that the dollar basket bottomed with the FCI in January 2021 and hit a new high with the FCI in January 2022. Thus, while the recent consolidation may seem troubling, the medium-term fundamentals supporting the greenback remain robust.
Furthermore, tighter financial conditions are often a function of rising real interest rates. As mentioned, the USD Index bottomed with the FCI and surged to new highs with the FCI. As a result, the fundamentals support a stronger, not weaker, USD Index. As evidence, the U.S. 10-Year real yield, the FCI, and the USD Index have traveled similar paths since January 2020.
Please see below:
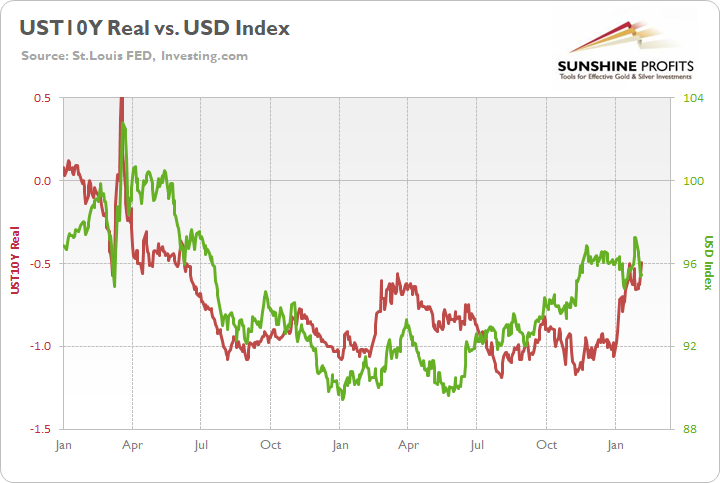
To explain, the green line above tracks the USD Index since January 2020, while the red line above tracks the U.S. 10-Year real yield. While the latter didn’t bottom in January 2021 like the USD Index and the FCI (though it was close), all three surged in late 2021 and hit new highs in 2022. Moreover, the U.S. 10-Year Treasury nominal and real yields hit new 2022 highs on Feb. 4.
In addition, if you compare the two charts, you can see that all three metrics spiked higher when the coronavirus crisis struck in March 2020. As such, the trio often follows in each other’s footsteps. Furthermore, with the Fed likely to raise interest rates at its March monetary policy meeting, this realization supports a higher U.S. 10-Year real yield, and a higher FCI. As a result, the fundamentals underpinning the USD Index remain robust, and short-term sentiment is likely to be responsible for the recent weakness.
Likewise, as the Omicron variant slows U.S. economic activity, the ‘bad news is good news’ camp has renewed hopes for a dovish Fed. However, the latest strain is unlikely to affect the Fed’s reaction function. A case in point: after ADP’s private payrolls declined by 301,000 in January (data released on Feb. 2), concern spread across Wall Street. However, after U.S. nonfarm payrolls (government data) came in at 467,000 versus 150,000 expected on Feb. 4, the U.S. labor market remains extremely healthy.
Please see below:
 Source: U.S. Bureau of Labor Statistics (BLS)
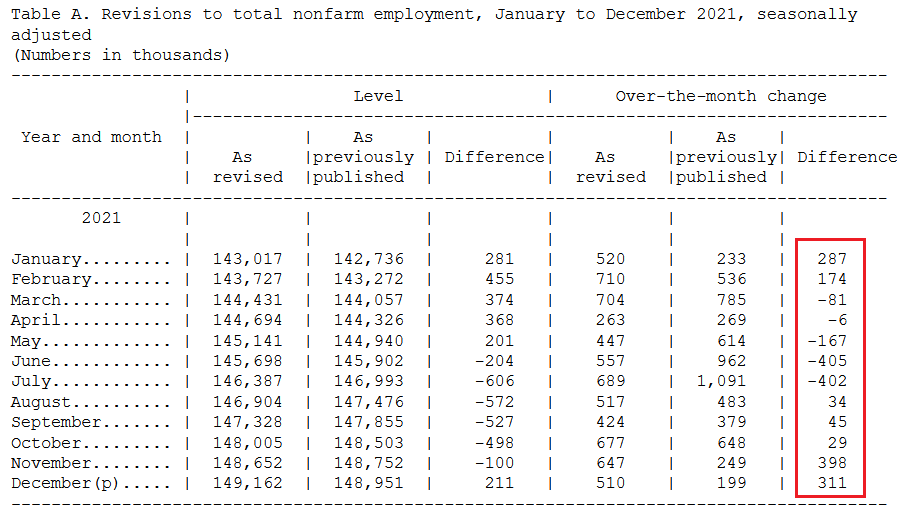
On top of that, the BLS revealed that “the over-the-month employment change for November and December 2021 combined is 709,000 higher than previously reported, while the over-the-month employment change for June and July 2021 combined is 807,000 lower. Overall, the 2021 over-the-year change is 217,000 higher than previously reported.”
Thus, the U.S. added more than 700,000 combined jobs in November and December than previously reported, and the net gain in 2021 was more than 200,000.
Please see below:
 Source: BLS
As for wage inflation, the BLS also revealed:
“In January, average hourly earnings for all employees on private nonfarm payrolls increased by 23 cents to $31.63. Over the past 12 months, average hourly earnings have increased by 5.7 percent.”
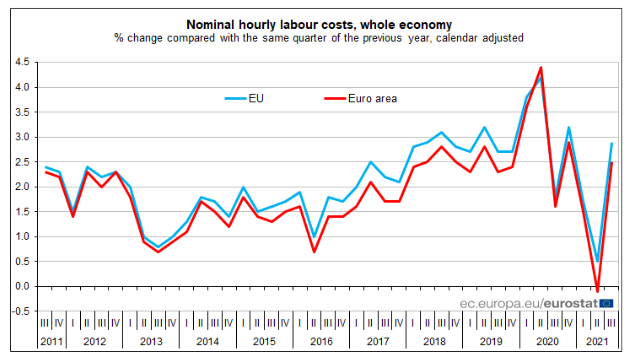
As a reminder, while investors speculate on the prospect of a hawkish ECB, the latest release out of Europe shows that wage inflation is much weaker than in the U.S. To explain, I wrote on Feb. 1:
Eurozone hourly labor costs rose by 2.5% YoY on Dec. 16 (the latest release). Moreover, the report revealed that “the costs of wages & salaries per hour worked increased by 2.3%, while the non-wage component rose by 3.0% in the third quarter of 2021, compared with the same quarter of the previous year.”
As a result, non-wage labor costs – like insurance, healthcare, unemployment premiums, etc. – did the bulk of the heavy lifting. In contrast, wage and salary inflation are nowhere near the ECB’s danger zone.
Please see below:
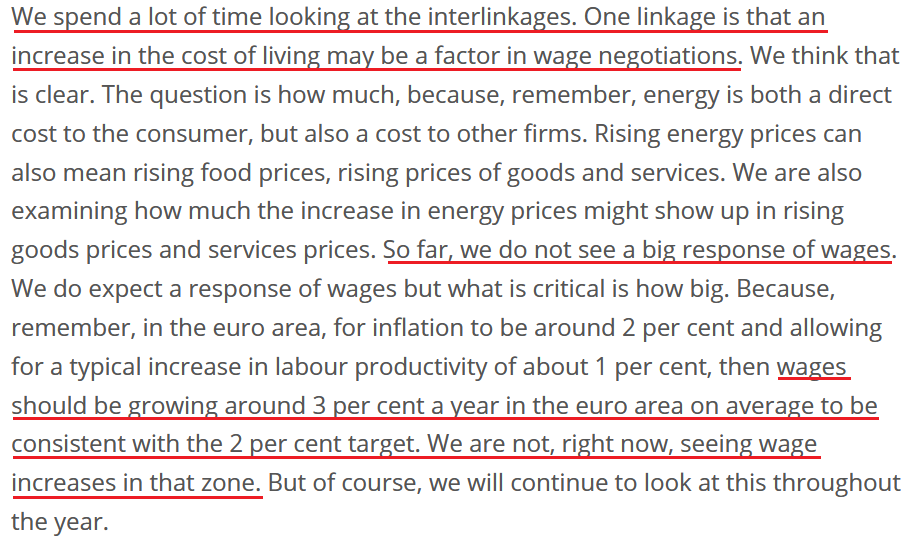
And why is wage inflation so critical? Well, ECB Chief Economist Philip Lane said on Jan. 25:
 Source: ECB
As a result, when the ECB’s Chief Economist tells you that wage inflation needs to hit 3% YoY to be “consistent” with the ECB’s 2% overall annual inflation target, a wage print of 2.3% YoY is far from troublesome. Thus, while euro bulls hope that the ECB will mirror the Fed and perform a hawkish 180, the data suggests otherwise.
In addition, while U.S. nonfarm payrolls materially outperformed on Feb. 4, I noted on Feb. 2 that there are now 4.606 million more job openings in the U.S. than citizens unemployed.
Please see below:
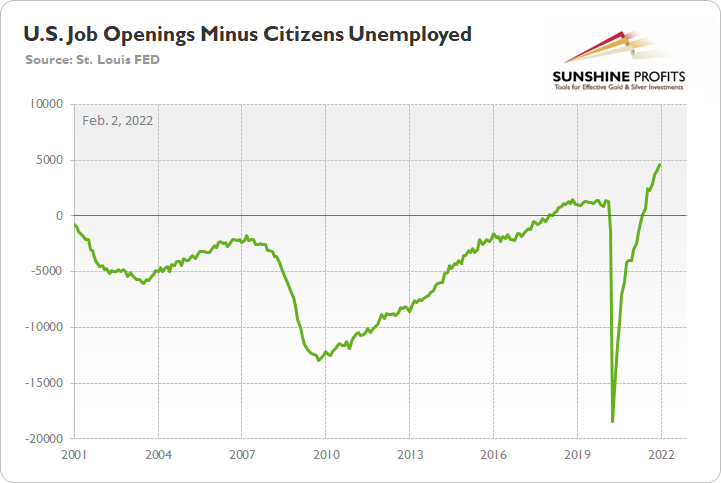
To explain, the green line above subtracts the number of unemployed U.S. citizens from the number of U.S. job openings. If you analyze the right side of the chart, you can see that the epic collapse has completely reversed and the green line is now at an all-time high. Thus, with more jobs available than people looking for work, the economic environment supports normalization by the Fed.
Thus, if we piece the puzzle together, the U.S. labor market remains healthy and U.S. inflation is materially outperforming the Eurozone. As a result, the Fed should stay ahead of the ECB, and the hawkish outperformance supports a weaker EUR/USD and a stronger USD Index. Moreover, the dynamic also supports a higher FCI and a higher U.S. 10-Year real yield. As we’ve seen since January 2021, these fundamental outcomes are extremely unkind to the PMs.
Finally, while the Omicron variant has depressed economic sentiment, I noted previously that the disruptions should be short-lived. For example, with Americans’ anxiety about COVID-19 decelerating, renewed economic strength should keep the pressure on the Fed.
Please see below:
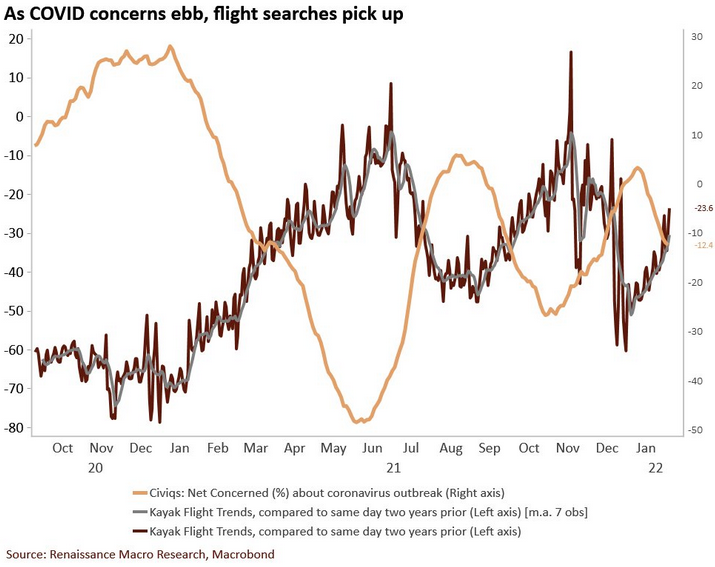
To explain, the light brown line above tracks the net percentage of Americans concerned about COVID-19, while the dark brown line above tracks the change in flight search trends on Kayak. In a nutshell: the more concern over COVID-19 (a high light brown line), the more Americans hunker down and avoid travel (a low dark brown line).
However, if you analyze the right side of the chart, you can see that the light brown line has rolled over and the dark brown line has materially risen. Moreover, with the trend poised to persist as the warmer weather arrives, increased mobility should uplift sentiment, support economic growth and keep the Fed’s rate hike cycle on schedule.
The bottom line? The USD Index’s fundamentals remain extremely healthy, and while short-term sentiment has been unkind, rising real yields and a hawkish Fed should remain supportive over the medium term. Moreover, with the PMs often moving inversely to the U.S. dollar, more downside should confront gold, silver, and mining stocks over the next few months.
In conclusion, the PMs rallied on Feb. 4, despite the spike in U.S. Treasury yields. However, with so much volatility confronting the general stock market recently, sentiment has pulled the PMs in many directions. However, the important point is that the medium-term thesis remains intact: the USD Index and U.S. Treasury yields should seek higher ground, and the realization is profoundly bearish for the precious metals sector.
Overview of the Upcoming Part of the Decline
- It seems to me that the corrective upswing is now over, and that gold, silver, and mining stocks are now likely to continue their medium-term decline.
- It seems that the first (bigger) stop for gold will be close to its previous 2021 lows, slightly below $1,700. Then it will likely correct a bit, but it’s unclear if I want to exit or reverse the current short position based on that – it depends on the number and the nature of the bullish indications that we get at that time.
- After the above-mentioned correction, we’re likely to see a powerful slide, perhaps close to the 2020 low ($1,450 - $1,500).
- If we see a situation where miners slide in a meaningful and volatile way while silver doesn’t (it just declines moderately), I plan to – once again – switch from short positions in miners to short positions in silver. At this time, it’s too early to say at what price levels this could take place, and if we get this kind of opportunity at all – perhaps with gold close to $1,600.
- I plan to exit all remaining short positions once gold shows substantial strength relative to the USD Index while the latter is still rallying. This may be the case with gold close to $1,350 - $1,400. I expect silver to fall the hardest in the final part of the move. This moment (when gold performs very strongly against the rallying USD and miners are strong relative to gold after its substantial decline) is likely to be the best entry point for long-term investments, in my view. This can also happen with gold close to $1,375, but at the moment it’s too early to say with certainty.
- As a confirmation for the above, I will use the (upcoming or perhaps we have already seen it?) top in the general stock market as the starting point for the three-month countdown. The reason is that after the 1929 top, gold miners declined for about three months after the general stock market started to slide. We also saw some confirmations of this theory based on the analogy to 2008. All in all, the precious metals sector is likely to bottom about three months after the general stock market tops.
- The above is based on the information available today, and it might change in the following days/weeks.
You will find my general overview of the outlook for gold on the chart below:
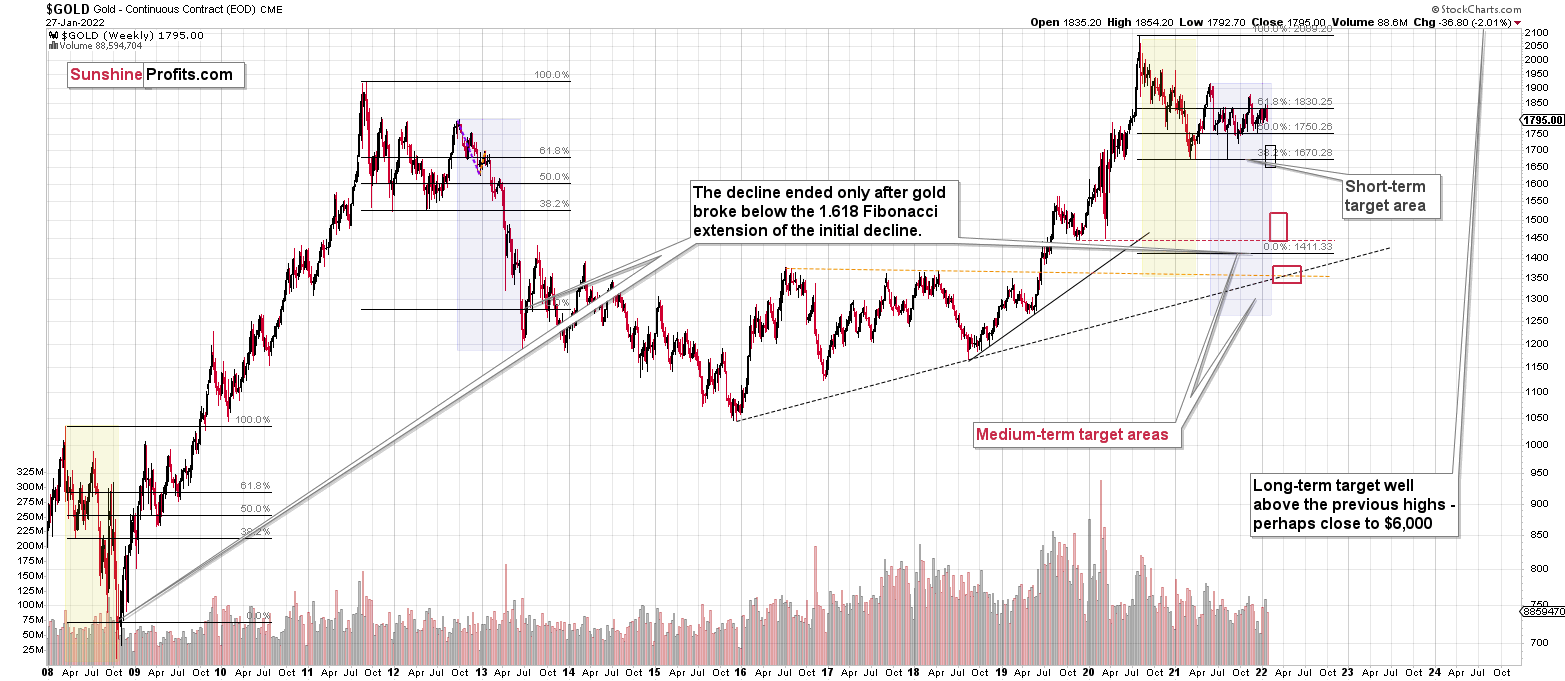
Please note that the above timing details are relatively broad and “for general overview only” – so that you know more or less what I think and how volatile I think the moves are likely to be – on an approximate basis. These time targets are not binding or clear enough for me to think that they should be used for purchasing options, warrants or similar instruments.
Letters to the Editor
Q: Thank you for the great analysis. My question is about Basel III. If parabanks and similar institutions dealing in paper gold, which currently pay penalties for holding a position, many of them exit, and they start because they have to, what impact will this have on the price of gold? Will it not fall by any chance?
A: It’s one of the bearish fundamental factors for gold. I think that the importance of the bullish factors for gold outweighs the importance of the bearish ones, but I think that gold will fall, anyway. However, I think that would be for its own technical reasons, due to the U.S. dollar’s strength, and due to increasing real yields.
Q1: PR, you've been saying that you don't believe that military action will take place in Ukraine. But how much at risk are our short positions if it does take place?
Q2: I'm concerned about Russia and Ukraine and how it will affect the mining stocks.
I understand your historical technical/fundamental analysis, but if there is an invasion, what will happen to mining stocks? I also have a DUST position on and wondering if it’s smart to get out before Russia makes a move. Any thoughts?
A: It’s impossible to tell exactly, but I’ll reply by providing an analogy to the situation when there actually was military action in Ukraine – during the 2014 annexation of Crimea.
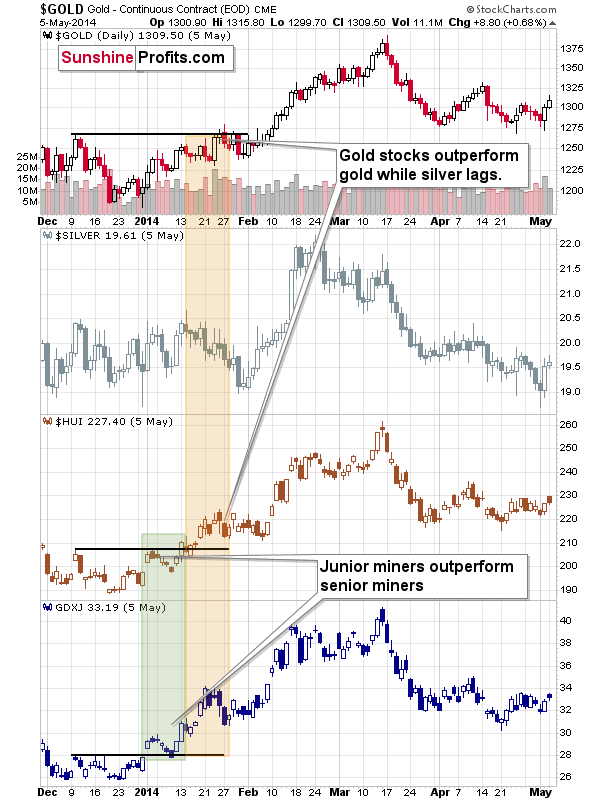
Before the annexation itself, gold and gold stocks rallied, and junior miners were strong relative to senior gold stocks. If we see something like that, I’ll likely exit the short positions at that time. So, realistically, we’re risking losing a few dollars in the GDXJ. Of course, I’m not guaranteeing that the risk is limited to that, or that the prices won’t rally higher – nobody can make such a guarantee, and neither am I. I’m simply stating what seems likely to me, as the realistic way of handling the situation if it does indeed escalate.
Please keep in mind that what we see right now is actually the opposite of what we saw in early 2014. Gold stocks are underperforming gold, and junior miners are weaker (not stronger) than senior miners. Consequently, the markets appear to be already calling the tensions a bluff (despite their initial reaction recently). Lower prices appear most likely in my view.
If the invasion doesn’t happen (which is the most likely outcome in my view – based not only on my own opinions, but on what our Team Member located in Ukraine is telling me), then we might be close to “peak concern” right now. This means, that we might be close to “peak gold price” in the short term, and thus exiting short positions now would be the opposite of what’s justified from the risk to reward point of view. Of course, it’s your capital, and you make the decisions regarding it – I’m simply presenting my opinions. Based on them, I’m keeping my short positions in junior mining stocks intact.
Summary
Summing up, it seems to me that the corrective upswing is over, and that gold, silver, and mining stocks are now likely to continue their medium-term decline. Even if not right away, then within the next several days.
I continue to think that junior mining stocks are currently likely to decline the most out of all the parts of the precious metals sector.
From the medium-term point of view, the two key long-term factors remain the analogy to 2013 in gold and the broad head and shoulders pattern in the HUI Index. They both suggest much lower prices ahead.
It seems that our profits from the short positions are going to become truly epic in the coming months.
After the sell-off (that takes gold to about $1,350 - $1,500), I expect the precious metals to rally significantly. The final part of the decline might take as little as 1-5 weeks, so it's important to stay alert to any changes.
Most importantly, please stay healthy and safe. We made a lot of money last March and this March, and it seems that we’re about to make much more on the upcoming decline, but you have to be healthy to enjoy the results.
As always, we'll keep you - our subscribers - informed.
To summarize:
Trading capital (supplementary part of the portfolio; our opinion): Full speculative short positions (300% of the full position) in junior mining stocks are justified from the risk to reward point of view with the following binding exit profit-take price levels:
Mining stocks (price levels for the GDXJ ETF): binding profit-take exit price: $34.63; stop-loss: none (the volatility is too big to justify a stop-loss order in case of this particular trade)
Alternatively, if one seeks leverage, we’re providing the binding profit-take levels for the JDST (2x leveraged) and GDXD (3x leveraged – which is not suggested for most traders/investors due to the significant leverage). The binding profit-take level for the JDST: $14.98; stop-loss for the JDST: none (the volatility is too big to justify a SL order in case of this particular trade); binding profit-take level for the GDXD: $25.48; stop-loss for the GDXD: none (the volatility is too big to justify a SL order in case of this particular trade).
For-your-information targets (our opinion; we continue to think that mining stocks are the preferred way of taking advantage of the upcoming price move, but if for whatever reason one wants / has to use silver or gold for this trade, we are providing the details anyway.):
Silver futures downside profit-take exit price: $19.12
SLV profit-take exit price: $17.72
ZSL profit-take exit price: $38.28
Gold futures downside profit-take exit price: $1,683
HGD.TO – alternative (Canadian) inverse 2x leveraged gold stocks ETF – the upside profit-take exit price: $11.79
HZD.TO – alternative (Canadian) inverse 2x leveraged silver ETF – the upside profit-take exit price: $29.48
Long-term capital (core part of the portfolio; our opinion): No positions (in other words: cash
Insurance capital (core part of the portfolio; our opinion): Full position
Whether you already subscribed or not, we encourage you to find out how to make the most of our alerts and read our replies to the most common alert-and-gold-trading-related-questions.
Please note that we describe the situation for the day that the alert is posted in the trading section. In other words, if we are writing about a speculative position, it means that it is up-to-date on the day it was posted. We are also featuring the initial target prices to decide whether keeping a position on a given day is in tune with your approach (some moves are too small for medium-term traders, and some might appear too big for day-traders).
Additionally, you might want to read why our stop-loss orders are usually relatively far from the current price.
Please note that a full position doesn't mean using all of the capital for a given trade. You will find details on our thoughts on gold portfolio structuring in the Key Insights section on our website.
As a reminder - "initial target price" means exactly that - an "initial" one. It's not a price level at which we suggest closing positions. If this becomes the case (like it did in the previous trade), we will refer to these levels as levels of exit orders (exactly as we've done previously). Stop-loss levels, however, are naturally not "initial", but something that, in our opinion, might be entered as an order.
Since it is impossible to synchronize target prices and stop-loss levels for all the ETFs and ETNs with the main markets that we provide these levels for (gold, silver and mining stocks - the GDX ETF), the stop-loss levels and target prices for other ETNs and ETF (among other: UGL, GLL, AGQ, ZSL, NUGT, DUST, JNUG, JDST) are provided as supplementary, and not as "final". This means that if a stop-loss or a target level is reached for any of the "additional instruments" (GLL for instance), but not for the "main instrument" (gold in this case), we will view positions in both gold and GLL as still open and the stop-loss for GLL would have to be moved lower. On the other hand, if gold moves to a stop-loss level but GLL doesn't, then we will view both positions (in gold and GLL) as closed. In other words, since it's not possible to be 100% certain that each related instrument moves to a given level when the underlying instrument does, we can't provide levels that would be binding. The levels that we do provide are our best estimate of the levels that will correspond to the levels in the underlying assets, but it will be the underlying assets that one will need to focus on regarding the signs pointing to closing a given position or keeping it open. We might adjust the levels in the "additional instruments" without adjusting the levels in the "main instruments", which will simply mean that we have improved our estimation of these levels, not that we changed our outlook on the markets. We are already working on a tool that would update these levels daily for the most popular ETFs, ETNs and individual mining stocks.
Our preferred ways to invest in and to trade gold along with the reasoning can be found in the how to buy gold section. Furthermore, our preferred ETFs and ETNs can be found in our Gold & Silver ETF Ranking.
As a reminder, Gold & Silver Trading Alerts are posted before or on each trading day (we usually post them before the opening bell, but we don't promise doing that each day). If there's anything urgent, we will send you an additional small alert before posting the main one.
Thank you.
Przemyslaw Radomski, CFA
Founder, Editor-in-chief

