

Briefly: in our opinion, full (300% of the regular position size) speculative short positions in junior mining stocks are justified from the risk/reward point of view at the moment of publishing this Alert.
At the moment of writing these words, gold continues to move around the $1,800 level, so nothing really changed in the last several hours. Not much changed during yesterday’s session either. While gold, silver, and mining stocks made new highs in terms of the closing prices, they didn’t move to new intraday highs, and today’s small intraday upswing also ended at lower highs. This divergence suggests that something could be about to change.
Let’s check what happened in the key markets yesterday.
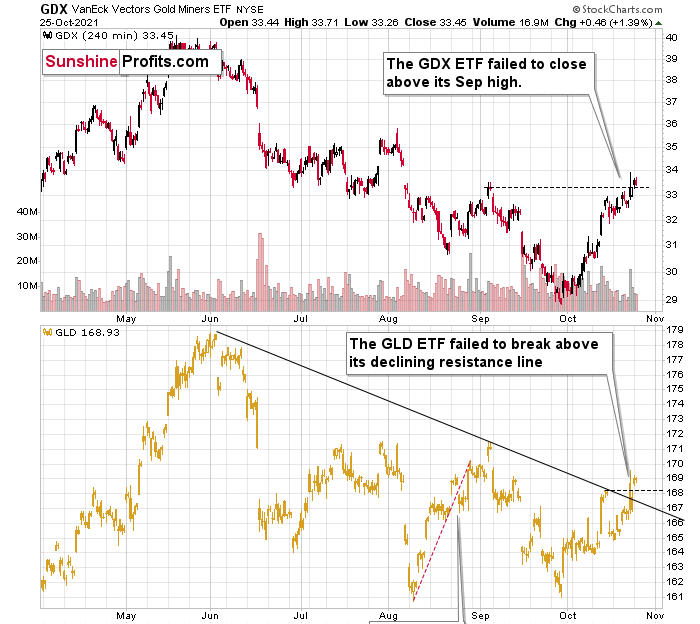
Yesterday’s session can be summarized in two words: “another attempt”. Friday’s intraday rally was invalidated before the closing bell, and this week bulls made another attempt to take the previous highs. Both: GDX and GLD closed above their previous highs, and the GLD even closed above its declining resistance line. In other words, we saw a breakout.
The key thing about this breakout, however, is that it’s not confirmed, and it seems that it won’t be confirmed. And that’s not just because of lower intraday lows; that’s not “just” because of the epic analogy between now and 2013 (and 2008) either. It’s the case because of what’s happening in the USD Index and of how the markets are likely to perform in the period between the tapering announcement and when it actually starts.
Let’s take a look at the USD Index first.
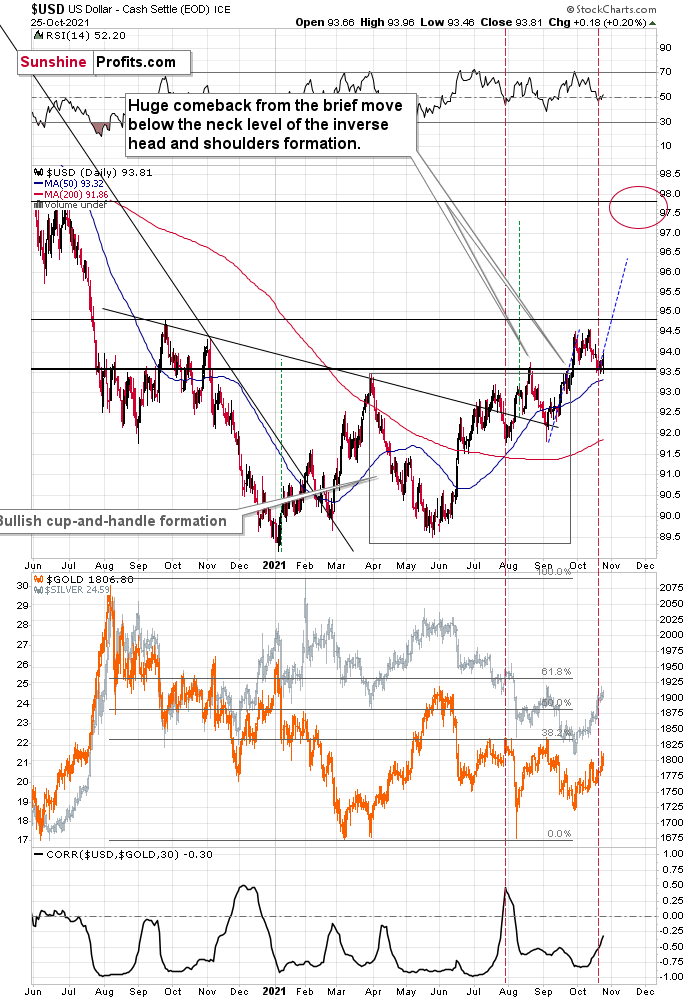
The key thing about the USD Index is that it didn’t invalidate its breakout to new 2021 highs. Instead, it verified it. The August high held as support and yesterday’s move higher confirms that.
The situation now appears to be the same as it was at the beginning of August, where the bottom also took several days to form, but when the USD Index finally moved higher once again, gold plunged. To be precise, back then, the bottom formed over 5 trading days, and yesterday was the fifth trading day of the current bottom. On the sixth day – back then – the USDX did very little and gold declined modestly, and it was the seventh day when the action really started. And… the short-term decline was over on the very next day. It was not easy to catch this decline if one wanted to wait for a big confirmation that it is indeed taking place. It seems that the same – patient – approach is justified in the current situation.
The RSI indicator (upper part of the chart) continues to confirm this similarity.
Having said that, let’s take a look at the markets from a more fundamental point of view.
Let the Games Begin
With Fed Chairman Jerome Powell effectively announcing the death of QE on Oct. 22, a taper announcement at the FOMC’s Nov. 2/3 policy meeting went from likely to a near certainty.
Please see below:
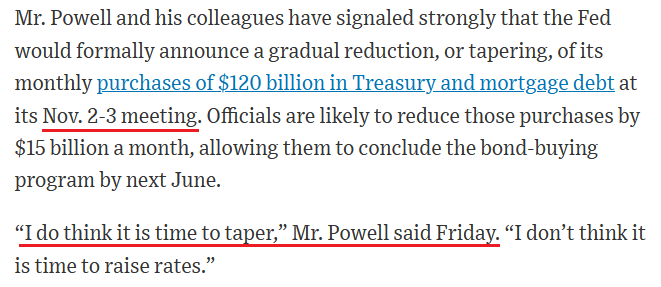 Source: The Wall Street Journal (WSJ)
More importantly, though, while the PMs have remained upbeat in recent weeks, the forthcoming liquidity drain will likely shift the narrative over the medium term. To explain, when the U.S. 10-Year Treasury yield surged from 1.66% to north of 3% during the 2013 taper tantrum, gold sunk by more than $500 in less than six months.
However, it’s important to remember that the U.S. 10-Year Treasury yield actually declined once the taper officially began (investors pricing in lower inflation, slower growth, etc.). Despite that, though, the GDXJ ETF’s downtrend continued for another two years.
Please see below:
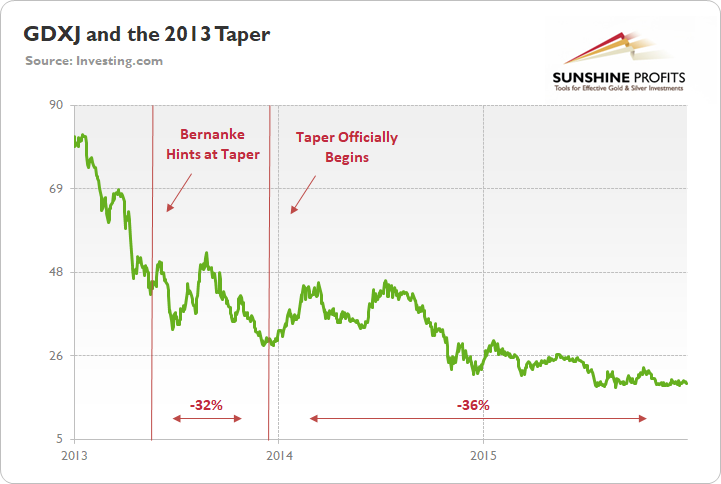
To explain, the green line above tracks the GDXJ ETF from the beginning of 2013 to the end of 2015. If you analyze the left side of the chart, you can see that when Fed Chairman Ben Bernanke hinted at tapering on May 22, 2013, the GDXJ ETF declined by 32% from May 22 until the taper began on Dec. 18.
Moreover, the onslaught didn’t end there. Once the taper officially began, the GDXJ ETF enjoyed a relief rally (similar to what we’re witnessing now), as long-term interest rates declined, and the PMs assumed that the worst was in the rearview.
However, as the liquidity drain caught up to the junior miners over the medium term, the GDXJ ETF declined by another 36% from when the taper was announced on Dec. 18, 2013, until the end of 2015. For context, there was no “advance notice” or announcements that preceded the actual taper in 2013. Bernanke simply slipped in May and began the process in December.
This time around, though, Bernanke’s 2013 blunder is similar to the FOMC turning hawkish during its Jun. 15/16 policy meeting. For context, I wrote on Aug. 5:
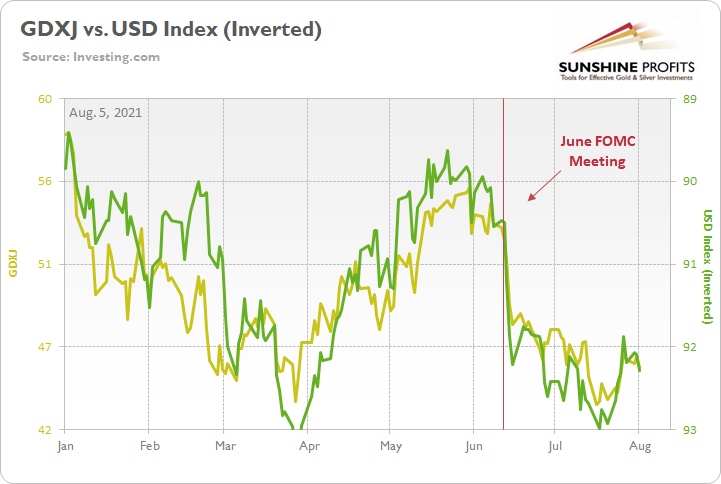
To explain, the gold line above tracks the GDXJ ETF (our short position), while the green line above tracks the inverted (again, scale flipped upside down) USD Index. If you analyze the relationship, the junior miners have been under immense pressure since the Fed turned hawkish in mid-June, while the USD Index has regained its mojo. Thus, unless the Fed delivers a complete 180, the trend is likely to continue.
To that point, with part one already on the books, the second act will likely unfold once the Fed formally begins its taper in “either mid-November or mid-December.” Thus, history implies that the GDXJ ETF still has plenty of downside left.
For one, the pace of the Fed’s 2021 taper (according to Powell) is much more hawkish than it was in 2013. To explain, I wrote on Sep. 23:
With ~$120 billion worth of bond purchases poised to hit zero in roughly nine months, the accelerated liquidity drain is extremely bullish for the USD Index.
Please see below:
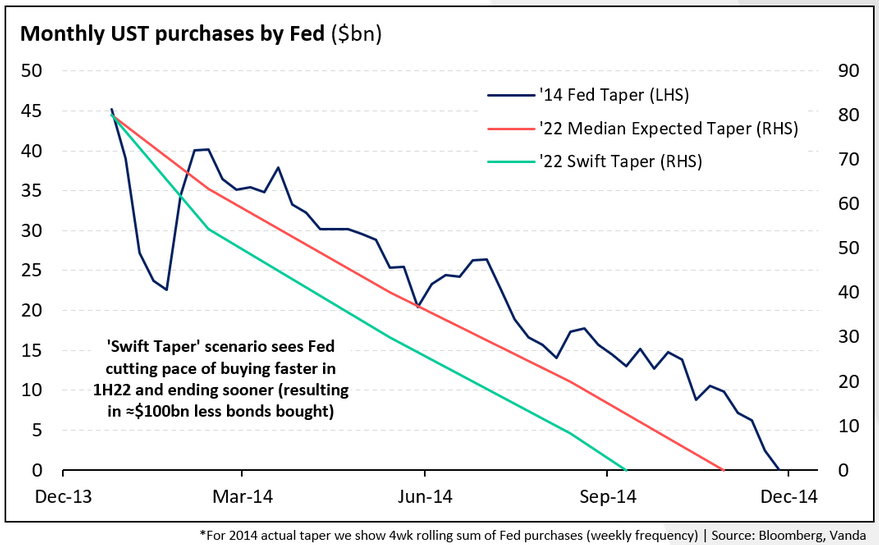
To explain, the dark blue line above tracks the pace of the Fed’s taper following its announcement in December 2013, while the orange line above tracks the consensus estimate this time around. However, if you focus your attention on the light blue line, you can see that Powell’s taper timeline pushes QE to zero in advance of both the precedent set in 2014 and the current consensus estimate.
As further evidence, the WSJ’s article from Oct. 22 also cites how the forthcoming taper is poised to commence at an accelerated pace:
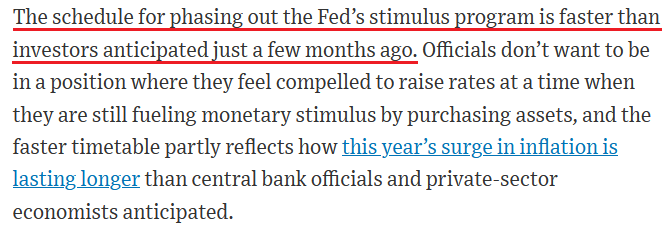 Source: WSJ
Second, the story doesn’t end there. Powell admitted on Oct. 22 that elevated inflation will likely “last longer than previously expected, likely well into next year…. Supply-side constraints have gotten worse,” he said. “The risks are clearly now to longer and more-persistent bottlenecks, and thus, to higher inflation.”
Furthermore, while he also said that “if the economy evolves broadly as expected, [the taper] will be completed by the middle of next year,” he added that “I don’t think it is time to raise rates.”
Originally, the Fed forecasted that it wouldn’t have to taper its asset purchases until well into 2022. However, surging inflation pulled that forecast forward. Now, the Fed forecasts that it won’t have to raise interest rates until well into 2023. However, surging inflation will likely pull that forecast forward as well.
Case in point: IHS Markit released its U.S. Composite PMI on Oct. 22. And while the headline index increased from 55.0 in September to 57.3 in October, the report also revealed:
“October also saw a survey-record rise in backlogs of work as firms struggled to meet demand due to supply chain bottlenecks and labor shortages, in turn, driving the steepest rise in prices yet recorded by the survey.”
Please see below:
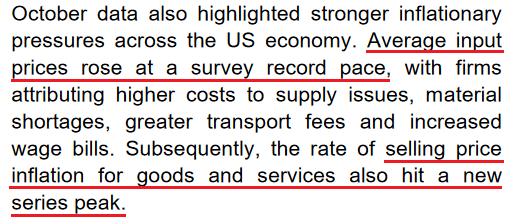 Source: IHS Markit
Likewise, the Dallas Fed released its Texas Manufacturing Outlook Survey on Oct. 25. The report revealed:
“Prices and wages continued to increase strongly in October. The raw materials prices remained near an all-time high but edged down to 76.3, while the finished goods prices index rose to a new high of 49.8. The wages and benefits index held near its own series high at 44.1.”
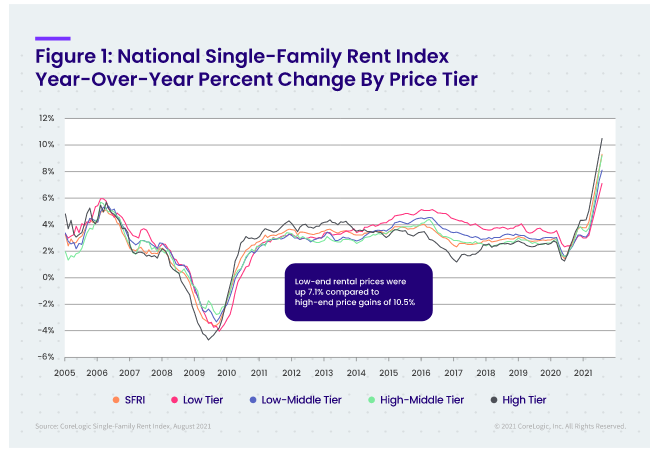
On top of that, while I’ve been warning for months that rent inflation still hasn’t made its presence felt, CoreLogic – a leading global property information, analytics, and data-enabled solutions provider – revealed on Oct. 19 that “single-family rent growth reached another record in August at 9.3%, the highest annual gain since at least January 2005.”
For context, among the four tiers that CoreLogic tracks, the year-over-year (YoY) percentage changes in national single-family rents in August were as follows:
- Lower-priced (75% or less than the regional median): up 7.1% (vs. 2.4% in August 2020
- Lower-middle priced (75% to 100% of the regional median): up 8.1%, (vs. 2% in August 2020)
- Higher-middle priced (100% to 125% of the regional median): up 9.2% (vs. 2% in August 2020)
- Higher-priced (125% or more than the regional median): up 10.5% (vs. 2.3% in August 2020).
Please see below:
Finally, while it’s clear that commodity, wage and rent inflation are still accelerating, even Powell’s “transitory” basket is giving him grief. For context, I wrote on Apr. 16:
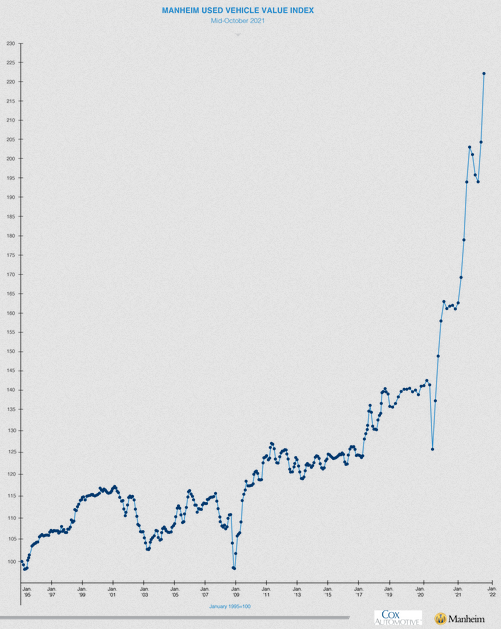
The Manheim Used Vehicle Index – compiled from a database of more than five million annual used vehicle transactions – increased by 5.87% month-over-month to a record high 179.2 in March. What’s more, the pace of the surge is unlike anything that we’ve ever witnessed before.
And after another bi-weekly update, Manheim revealed that wholesale used vehicle prices “increased 8.3% in the first 15 days of October compared to the month of September. This brought the Manheim Used Vehicle Index to [a record high] 221.8.”
Please see below:
The bottom line? While the PMs behave as if it’s clear skies ahead, their fundamentals are actually worse now than they were during the summer swoons. With the taper a done deal and the liquidity drain likely to outpace the precedent set in 2014, the PMs have not performed well when the Fed turns hawkish. Furthermore, with the Fed still materially behind the inflation curve, the pressure to raise interest rates will likely intensify in 2022. As a result, while fits and starts were part of the GDXJ ETF’s 2014-2015 post-taper downtrend, this post-taper environment should also be one of ‘USD Index up, PMs down.’
In conclusion, the PMs rallied on Oct. 25, and they continue to ride the S&P 500’s bullish wave. However, with the USD Index ripping higher and history highlighting the fallibility of the PMs’ recent rallies, the GDXJ ETF will likely find the terrain much tougher once the Fed removes its policy support. As a result, lower lows should materialize in the coming months, and the recent strength is likely a corrective upswing within a medium-term downtrend.
Overview of the Upcoming Part of the Decline
- It seems to me that the current corrective upswing in gold is over, and the next short-term move lower is about to begin. Since it seems to be another short-term move more than it seems to be a continuation of the bigger decline, I think that junior miners would be likely to (at least initially) decline more than silver.
- It seems that the first stop for gold will be close to its previous 2021 lows, slightly below $1,700. Then it will likely correct a bit, but it’s unclear if I want to exit or reverse the current short position based on that – it depends on the number and the nature of the bullish indications that we get at that time. Before the next big slide, I will likely prefer to get back to the short position in the junior mining stocks.
- After the above-mentioned correction, we’re likely to see a powerful slide, perhaps close to the 2020 low ($1,450 - $1,500).
- If we see a situation where miners slide in a meaningful and volatile way while silver doesn’t (it just declines moderately), I plan to – once again – switch from short positions in miners to short positions in silver. At this time, it’s too early to say at what price levels this could take place, and if we get this kind of opportunity at all – perhaps with gold close to $1,600.
- I plan to exit all remaining short positions when gold shows substantial strength relative to the USD Index while the latter is still rallying. This might take place with gold close to $1,350 - $1,400. I expect silver to fall the hardest in the final part of the move. This moment (when gold performs very strongly against the rallying USD and miners are strong relative to gold after its substantial decline) is likely to be the best entry point for long-term investments, in my view. This might also happen with gold close to $1,375, but it’s too early to say with certainty at this time. I expect the final bottom to take place near the end of the year, perhaps in mid-December.
- As a confirmation for the above, I will use the (upcoming or perhaps we have already seen it?) top in the general stock market as the starting point for the three-month countdown. The reason is that after the 1929 top, gold miners declined for about three months after the general stock market started to slide. We also saw some confirmations of this theory based on the analogy to 2008. All in all, the precious metals sector is likely to bottom about three months after the general stock market tops.
- The above is based on the information available today, and it might change in the following days/weeks.
You will find my general overview of the outlook for gold on the chart below:
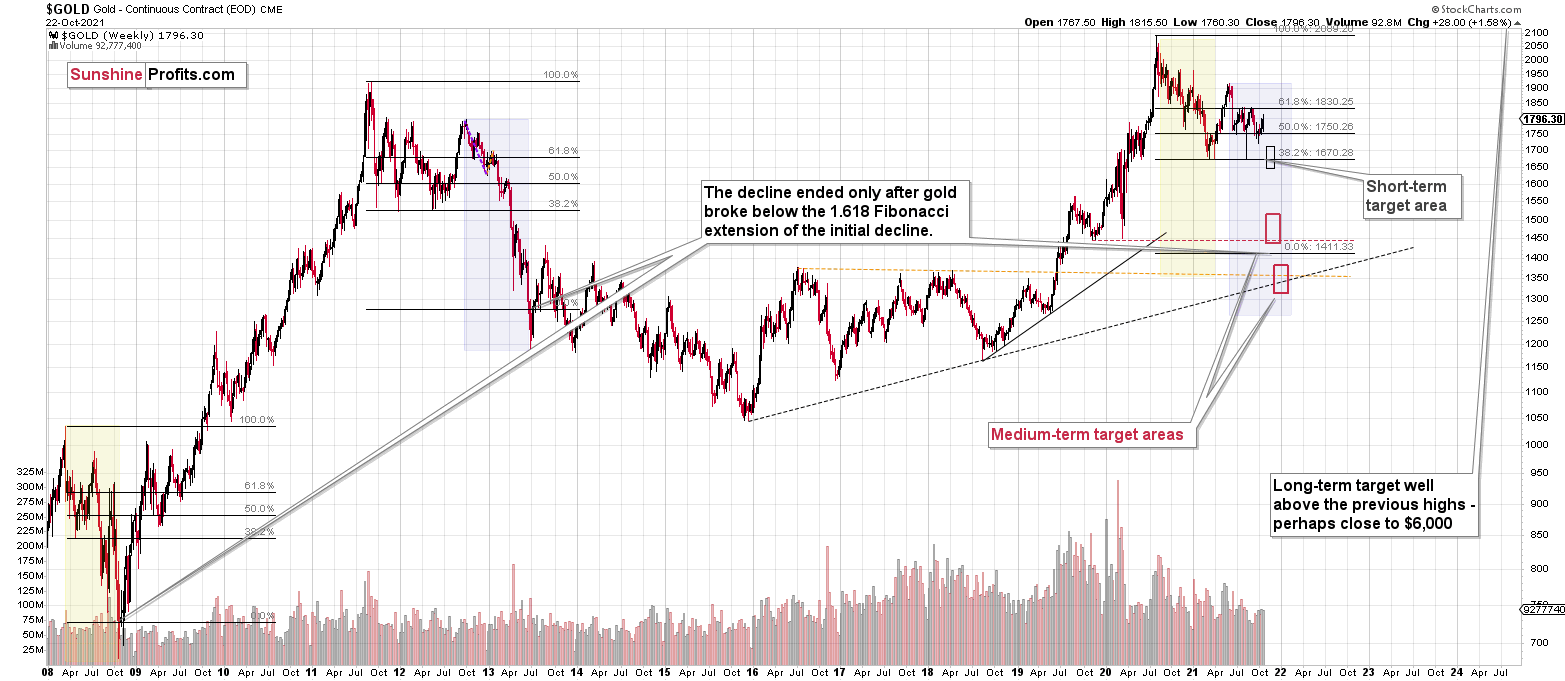
Please note that the above timing details are relatively broad and “for general overview only” – so that you know more or less what I think and how volatile I think the moves are likely to be – on an approximate basis. These time targets are not binding or clear enough for me to think that they should be used for purchasing options, warrants or similar instruments.
Summary
To summarize, the outlook for the precious metals sector remains extremely bearish for the next few months. Since it seems that the PMs are starting another short-term move lower more than it seems that they are continuing their bigger decline, I think that junior miners would be likely to (at least initially) decline more than silver.
From the medium-term point of view, the key two long-term factors remain the analogy to 2013 in gold and the broad head and shoulders pattern in the HUI Index. They both suggest much lower prices ahead.
It seems that our profits from the short positions are going to become truly epic in the following months.
After the sell-off (that takes gold to about $1,350 - $1,500), I expect the precious metals to rally significantly. The final part of the decline might take as little as 1-5 weeks, so it's important to stay alert to any changes.
Most importantly, please stay healthy and safe. We made a lot of money last March and this March, and it seems that we’re about to make much more on the upcoming decline, but you have to be healthy to enjoy the results.
As always, we'll keep you - our subscribers - informed.
By the way, we’re currently providing you with the possibility to extend your subscription by a year, two years, or even three years with a special 20% discount. This discount can be applied right away, without the need to wait for your next renewal – if you choose to secure your premium access and complete the payment upfront. The boring time in the PMs is definitely over, and the time to pay close attention to the market is here. Naturally, it’s your capital, and the choice is up to you, but it seems that it might be a good idea to secure more premium access now while saving 20% at the same time. Our support team will be happy to assist you in the above-described upgrade at preferential terms – if you’d like to proceed, please contact us.
To summarize:
Trading capital (supplementary part of the portfolio; our opinion): Full speculative short positions (300% of the full position) in junior mining stocks are justified from the risk to reward point of view with the following binding exit profit-take price levels:
Mining stocks (price levels for the GDXJ ETF): binding profit-take exit price: $35.73; stop-loss: none (the volatility is too big to justify a stop-loss order in case of this particular trade)
Alternatively, if one seeks leverage, we’re providing the binding profit-take levels for the JDST (2x leveraged) and GDXD (3x leveraged – which is not suggested for most traders/investors due to the significant leverage). The binding profit-take level for the JDST: $16.18; stop-loss for the JDST: none (the volatility is too big to justify a SL order in case of this particular trade); binding profit-take level for the GDXD: $32.08; stop-loss for the GDXD: none (the volatility is too big to justify a SL order in case of this particular trade).
For-your-information targets (our opinion; we continue to think that mining stocks are the preferred way of taking advantage of the upcoming price move, but if for whatever reason one wants / has to use silver or gold for this trade, we are providing the details anyway.):
Silver futures downside profit-take exit price: $19.12
SLV profit-take exit price: $17.72
ZSL profit-take exit price: $41.38
Gold futures downside profit-take exit price: $1,683
HGD.TO – alternative (Canadian) inverse 2x leveraged gold stocks ETF – the upside profit-take exit price: $12.48
Long-term capital (core part of the portfolio; our opinion): No positions (in other words: cash
Insurance capital (core part of the portfolio; our opinion): Full position
Whether you already subscribed or not, we encourage you to find out how to make the most of our alerts and read our replies to the most common alert-and-gold-trading-related-questions.
Please note that we describe the situation for the day that the alert is posted in the trading section. In other words, if we are writing about a speculative position, it means that it is up-to-date on the day it was posted. We are also featuring the initial target prices to decide whether keeping a position on a given day is in tune with your approach (some moves are too small for medium-term traders, and some might appear too big for day-traders).
Additionally, you might want to read why our stop-loss orders are usually relatively far from the current price.
Please note that a full position doesn't mean using all of the capital for a given trade. You will find details on our thoughts on gold portfolio structuring in the Key Insights section on our website.
As a reminder - "initial target price" means exactly that - an "initial" one. It's not a price level at which we suggest closing positions. If this becomes the case (like it did in the previous trade), we will refer to these levels as levels of exit orders (exactly as we've done previously). Stop-loss levels, however, are naturally not "initial", but something that, in our opinion, might be entered as an order.
Since it is impossible to synchronize target prices and stop-loss levels for all the ETFs and ETNs with the main markets that we provide these levels for (gold, silver and mining stocks - the GDX ETF), the stop-loss levels and target prices for other ETNs and ETF (among other: UGL, GLL, AGQ, ZSL, NUGT, DUST, JNUG, JDST) are provided as supplementary, and not as "final". This means that if a stop-loss or a target level is reached for any of the "additional instruments" (GLL for instance), but not for the "main instrument" (gold in this case), we will view positions in both gold and GLL as still open and the stop-loss for GLL would have to be moved lower. On the other hand, if gold moves to a stop-loss level but GLL doesn't, then we will view both positions (in gold and GLL) as closed. In other words, since it's not possible to be 100% certain that each related instrument moves to a given level when the underlying instrument does, we can't provide levels that would be binding. The levels that we do provide are our best estimate of the levels that will correspond to the levels in the underlying assets, but it will be the underlying assets that one will need to focus on regarding the signs pointing to closing a given position or keeping it open. We might adjust the levels in the "additional instruments" without adjusting the levels in the "main instruments", which will simply mean that we have improved our estimation of these levels, not that we changed our outlook on the markets. We are already working on a tool that would update these levels daily for the most popular ETFs, ETNs and individual mining stocks.
Our preferred ways to invest in and to trade gold along with the reasoning can be found in the how to buy gold section. Furthermore, our preferred ETFs and ETNs can be found in our Gold & Silver ETF Ranking.
As a reminder, Gold & Silver Trading Alerts are posted before or on each trading day (we usually post them before the opening bell, but we don't promise doing that each day). If there's anything urgent, we will send you an additional small alert before posting the main one.
Thank you.
Przemyslaw Radomski, CFA
Founder, Editor-in-chief

