

Briefly: in our opinion, full (300% of the regular position size) speculative short positions in junior mining stocks are justified from the risk/reward point of view at the moment of publishing this Alert.
Friday’s session was rather uneventful, so today’s analysis is going to be rather brief. However, there is one part of the precious metals sector that’s definitely worth discussing.
The junior mining stocks closed the week above the declining medium-term support line, which might be viewed as something bullish. Let’s take a closer look.
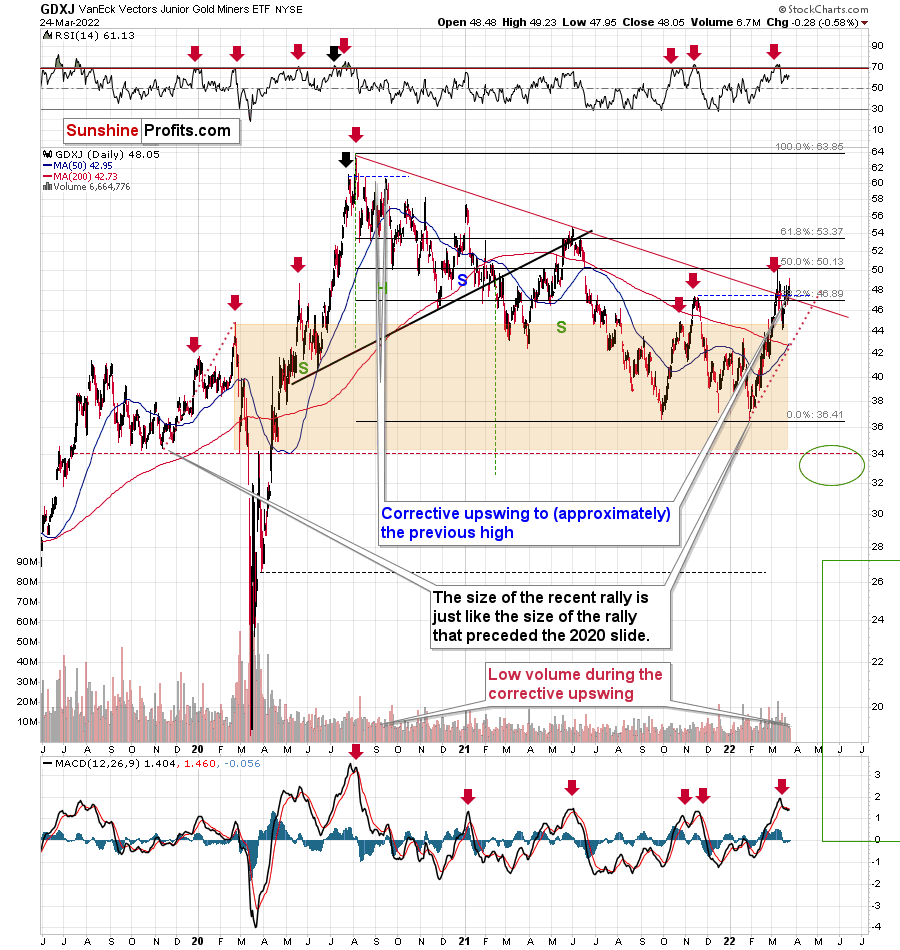
The GDXJ ETF closed the week above the declining red line and below the 38.2% Fibonacci retracement level. However, should one view this as really bullish?
Not really, as long as one remembers that not everything is about the price. The volume is also an important indicator as it shows, among other things, how much the market participants are really convinced that a given move is likely to take place. If the price moved higher on significant volume (but not excessively huge, as that could mean that the rally burnt itself out), it would mean that bulls won after a fierce fight.
Friday’s volume, however, was small. In fact, it was the lowest volume in the GDXJ ETF that we have seen this year. The second-lowest volume was recorded on Jan. 4, which was right before GDXJ’s decline.
So, should the breakout above the declining resistance be trusted? No, at least not yet.
This is especially the case given that the sell signal from the MACD indicator remains intact. These signals were highly effective at detecting major short-term tops. The fact that we just saw one indicates that the outlook for mining stocks is bearish.
Besides, while the GDXJ ETF moved above its medium-term resistance line, it also moved below its rising short-term support line, as we can see on the below 4-hour chart.
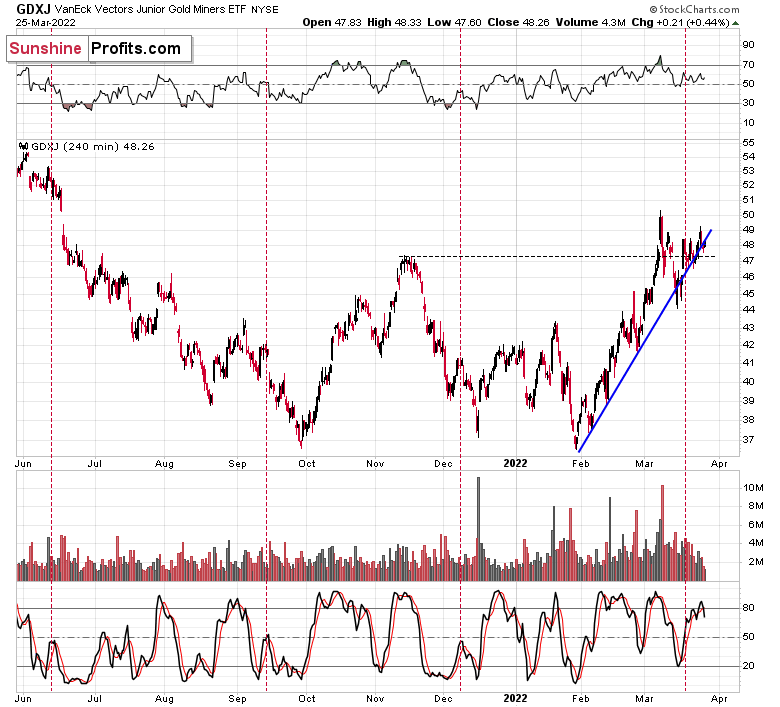
The ETF closed practically right at the line at the end of the week, but the initial breakdown indicates that a major slide could happen any day – or hour – now.
Based on the above, the small breakout above the declining red resistance line (visible on GDXJ’s daily chart) is likely to be invalidated, and much lower GDXJ prices are likely to follow.
Let’s keep in mind that, based on the clearly confirmed breakout in the USD Index and a visible breather in it, the U.S. currency is likely to rally in the following days / weeks. This means that the precious metals sector is likely to get a bearish push shortly.
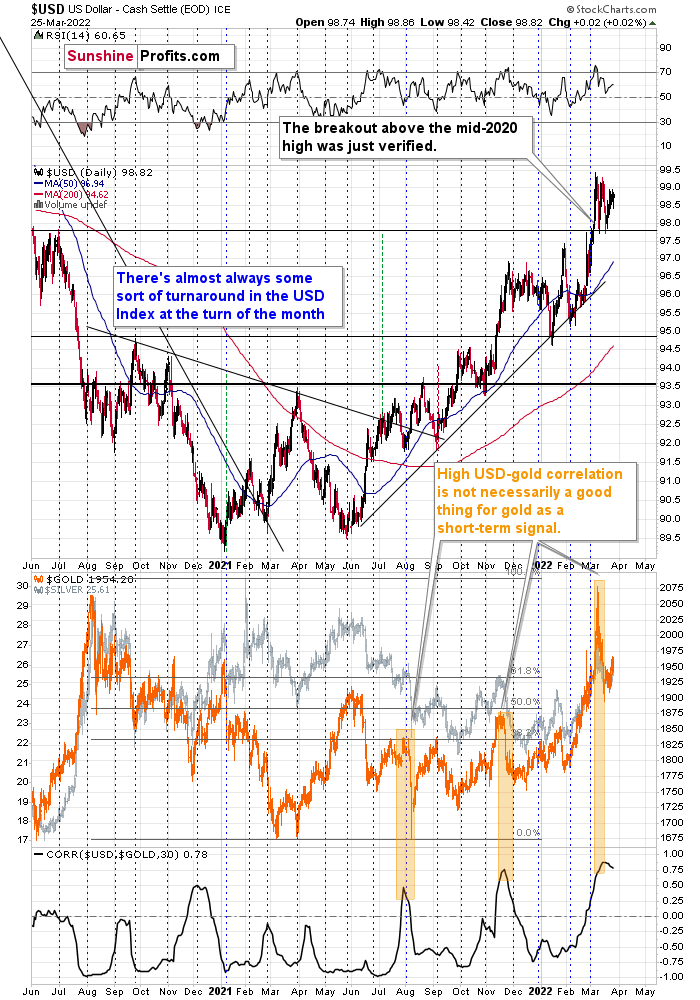
As the war-based premiums on gold and the USD appear to be waning, a high-interest-rate-driven rally in the USD is likely to trigger declines in gold. The correlation between these two assets started to decline. When that happened during the last two cases (marked with orange), gold declined profoundly shortly thereafter.
However, isn’t gold forming a cup-and-handle pattern that could make it soar?
Let’s take a look at the gold market from a broader point of view to find out.
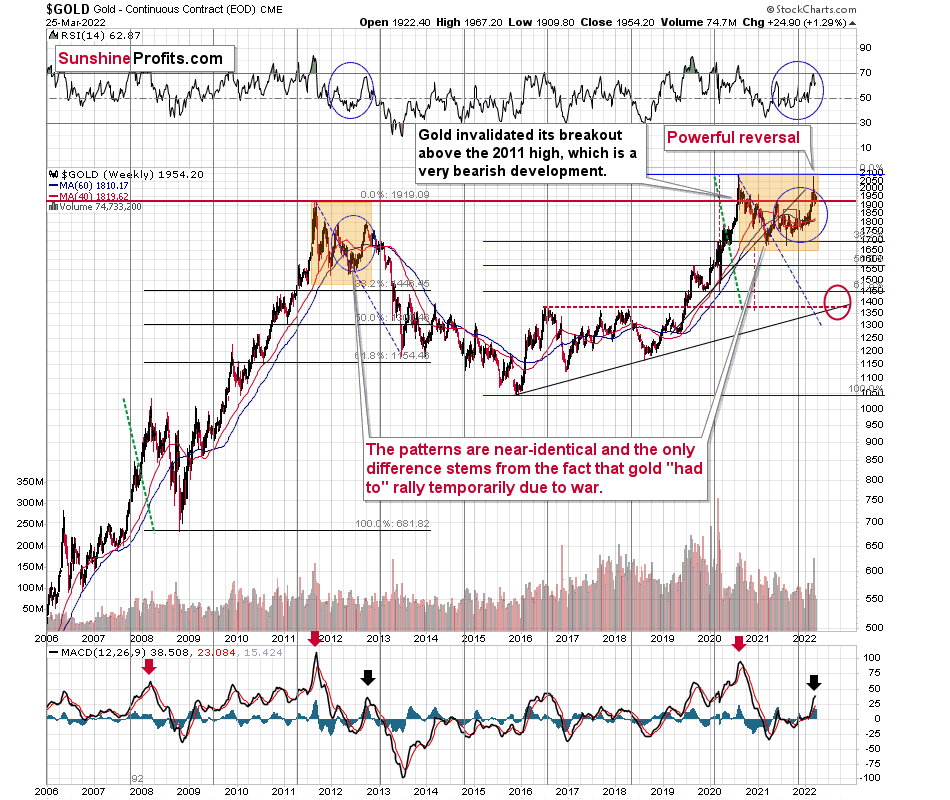
Well, it might be, but we won’t know until we see a confirmed breakout above the top of the pattern – the previous 2020 and 2022 highs.
What we saw recently was an indication that it’s unlikely to happen anytime soon, without gold’s major decline taking place first. What indication? One might ask. The answer is that despite raging inflation (and still low interest rates), a pandemic, and war in Europe that at some point looked like something that could turn into a nuclear war, gold still failed to rally above its 2020 high. In fact, at the moment of writing these words, gold is trading at about $1,935, which is just slightly above its 2011 high. Yes, you read that right: despite all these factors that should have made gold exceed the old highs a long time ago, it didn’t manage to do so.
That’s just gold. You know what silver and gold stocks did, right? They didn’t even rally close to their 2020 high, which itself was not even close to their 2011 highs. In fact, they both managed to only correct half of their declines that started in 2011.
So, no. I don’t think we’ll see the completion of the cup-and-handle formation in gold before we see a profound decline, and the way gold, silver, and mining stocks reacted (they almost didn’t) to the recent developments confirms it. On the technical front, please keep in mind that before a formation is completed, its implications are nonexistent – it’s all just potential. If you bought a lottery ticket, you could potentially be a multi-millionaire. However, until you actually win, it doesn’t happen (unless you are one right now, of course). It is the same with patterns, until they are completed, they have no implications.
Besides, the “it’s a huge cup-and-handle pattern” argument is an old one. We heard it multiple times in 2012 when gold, silver, and mining stocks were topping, and before we saw a major slide in them. The patterns are just like what we saw back then, with the tiny exception that this time gold peaked close to the original top. However, it’s a normal, geopolitically-driven thing. Without it, the patterns might have been almost 100% identical. The implications are very bearish for the following weeks/months, especially that self-similarity to late 2012 is present also in silver and gold stocks.
Of course, if the Russians use tactical nuclear weapons, gold prices might again react in the near term. If it escalates into a full-blown nuclear war, then:
- We’ll have many other problems to worry about than the near-term price of gold. The more common problems would be securing access to clean water and electricity (bitcoin payments without electricity, anyone? Or maybe electronic currency is useful except times at when you really need it).
- The gold that we have in the insurance part of our capital (all Gold & Silver Trading Alerts feature details for three parts of the portfolio : trading, investment, and insurance) would likely soar, more than making up for any financial losses one might incur on many fronts due to the nuclear war.
I’m writing about the above as I received a question that I’d like to quote below:
“There are rumors that Russia may begin to use tactical nuclear weapons in the very near future (2-4 weeks). How do you see this affecting gold prices if this eventuates?”
The important detail here is visible at the beginning of the question: “There are rumors.” If the rumors are already present, then it means that gold has already reacted to it and it’s already after a rally based on that. The market buys on rumor and sells on fact. Consequently, it’s even possible that if nuclear weapons are used on a small scale and without an analogous reaction from other nuclear powers, then gold’s price could actually decline as markets could view it as a “relief” from the scenario in which a full-blown nuclear war starts.
Again, please make sure you remember this rule: the market moves on rumor and then moves back on fact. If you see that the rumors are prevalent, you’ll know that the price has most likely already reacted to it.
All in all, technicals favor a decline in the precious metals sector sooner rather than later.
Having said that, let’s take a look at the markets from a more fundamental point of view.
Only a Matter of Time
While Fed officials have ratcheted up the hawkish rhetoric recently, calm has drifted over the stock and commodities markets. However, with the bond market on edge, the U.S. 10-Year Treasury yield closed at another 2022 high of 2.48% on Mar. 25.
Please see below:
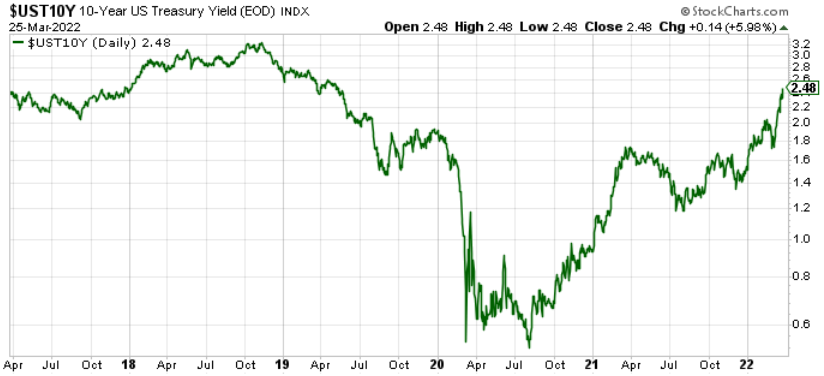
Moreover, while investors assume that all is well on Wall Street, the implications of the Fed's hawkish shift will likely result in deep drawdowns for many asset classes over the medium term.
To explain, when the Fed tightens monetary policy, it's actively trying to slow down the U.S. economy. As a result, the tradeoff for calming inflation is less consumption, lower growth, and pressure on asset prices. However, while investors think the Fed will pull a rabbit out of its hat and materially slow inflation without hurting the U.S. economy, the prospect is unrealistic.
For example, U.S. pending home sales declined by 4.1% month-over-month (MoM) on Mar. 25, well below the consensus estimate of a 1% increase. Moreover, while the National Association of Realtors' Chief Economist, Lawrence Yun, said that "pending transactions diminished in February mainly due to the low number of homes for sale" and that "buyer demand is still intense, but it's as simple as 'one cannot buy what is not for sale,'" he also noted:
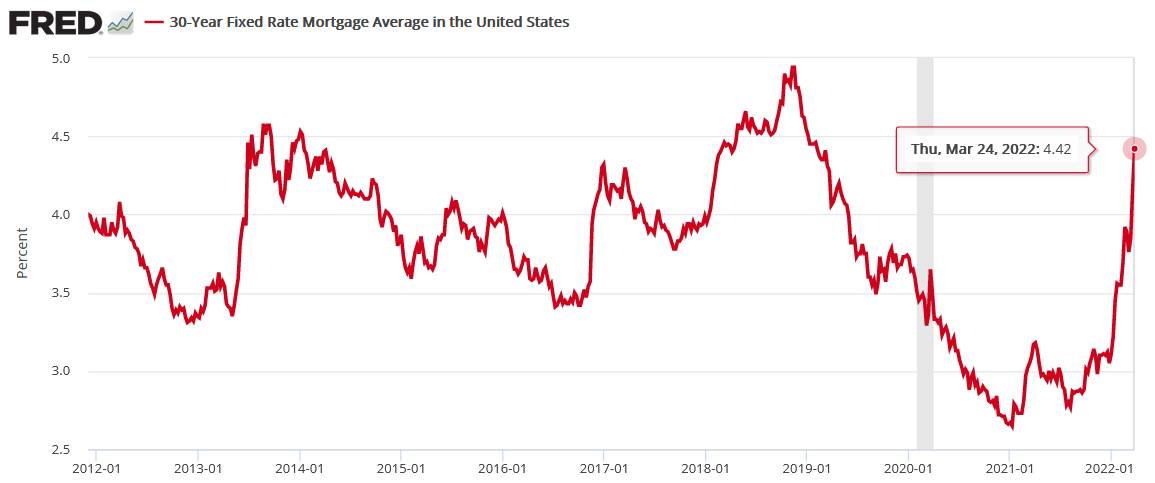
"The surge in home prices combined with rising mortgage rates can easily translate to another $200 to $300 in mortgage payments per month, which is a major strain for many families already on tight budgets."
Speaking of which, the average U.S. 30-year fixed mortgage rate has risen materially in recent weeks. With the Fed caught between curbing inflation and avoiding stress in the housing market, the lose-lose situation is profoundly bearish for risk assets.
Please see below:
Moreover, while I’ve been warning for months that higher interest rates should materialize, overbought conditions may elicit a short-term pullback. However, with higher highs and higher lows coupled with a reliable historical track record, the Fed confronts a serious problem. To explain, I wrote on Jan. 19:
If the U.S. 10-Year Treasury yield declines in 2022, it will defy nearly 40 years of historical precedent.
Please see below:
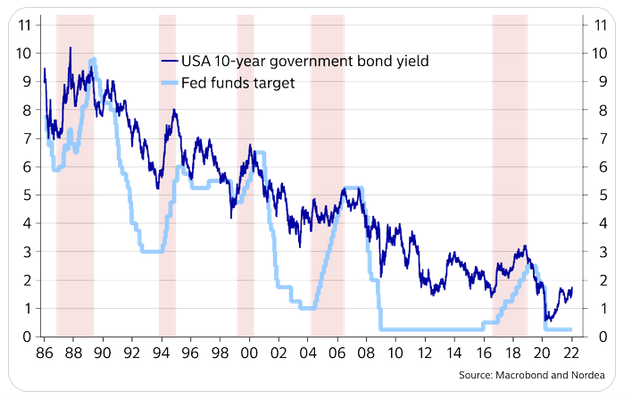
To explain, the dark blue line above tracks the U.S. 10-Year Treasury yield, while the light blue line above tracks the U.S. Federal Funds Rate. If you analyze the latter's ascents starting in 1987, 1993, 1999, 2004 and 2017, you can see that the U.S. 10-Year Treasury yield always rallies when the Fed increases the U.S. Federal Funds Rate.
Moreover, the U.S. 10-Year Treasury yield doesn't usually peak until after the Fed finishes its rate hike cycles. For example, if you focus your attention on the light blue line's highs, notice how the U.S. 10-Year Treasury yield keeps rising until the Fed stops hiking? With a rate hike in March likely a done deal and Fed officials projecting anywhere from two to four rate hikes in 2022, is this time really different?
To that point, with two to four morphing into seven to 12, the Fed’s rate hike cycle still has plenty of room to run. After Goldman Sachs increased its forecast last week, Citigroup one-upped its rival. For example, Citigroup Chief Economist Andrew Hollenhorst told clients on Mar. 25:
“We are revising our ‘base case’ for Fed policy rates from 200bp of rate hikes in 2022 to 275bp in rate hikes in 2022. Rather than one 50bp rate hike in May (our previous base case), we now expect the Fed to raise rates in 50bp increments in May, June, July, and September followed by 25bp hikes in October and December.”
“Should inflation moderate more than we expect or broader financial conditions tighten abruptly (e.g. a 20%+ equity market sell-off), officials might return to 25bp hikes in July meaning a total of 225bp of rate hikes. On the other hand, continued 5%+ annualized inflation could lead to 50bp hikes at every remaining meeting, delivering 325bp of cumulative rate increase.”
As such, Citigroup expects four 50 basis point rate hikes by the Fed over the next four meetings. Remember, the FOMC’s median projection in September was for one rate hike in 2022. Furthermore, while Hollenhorst wrote that moderating inflation could result in a more patient Fed, he added that the forecast is “skewed heavily to the upside” and that “inflation [is] likely to be very strong in March (headline 1%+MoM thanks to higher gasoline prices and core continuing to rise ~0.5%MoM) and to remain elevated in April.”
Thus, when we piece together the puzzle, market participants have come around to the inflationary realities that I warned about throughout 2021. With the data above highlighting how the U.S. 10-Year Treasury yield usually doesn’t peak until the Fed stops hiking, it implies material upside for medium-to long-term interest rates.
Furthermore, with U.S. consumers still fretting over inflation, the Fed’s preference for patience has blown up politically. As a result, how can officials explain that a dovish 180 is the right course of action?
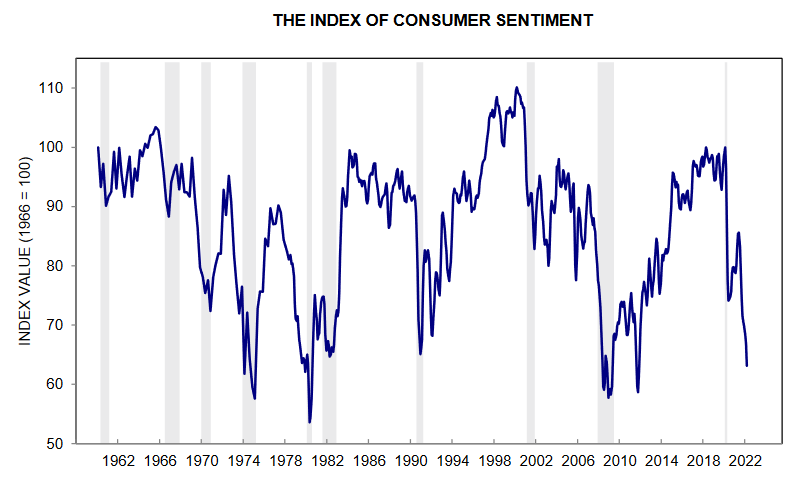
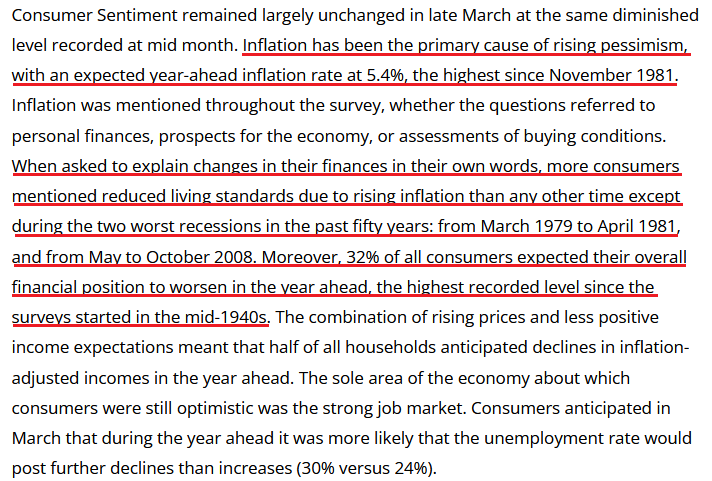
As evidence, the University of Michigan released its Index of Consumer Sentiment on Mar. 25. With the index hitting another new low in March, the Fed’s “transitory” narrative has died a horrible death.
Please see below:
 Source: University of Michigan
Chief Economist Richard Curtin said:
 Source: University of Michigan
Moreover, he added:
“Strong job growth will continue to put upward pressures on wages, resulting in higher income and stronger job prospects. This strength will then act to expand consumer demand and ultimately lead to another cycle of price and wage increases. These factors represent the necessary (but not sufficient) conditions for the development of inflationary psychology as a self-fulfilling prophecy. Prevention of inflationary psychology is much less costly before it becomes ingrained in the economic behavior of consumers and firms.”
As a result, if investors assume that the Fed will somehow bail out the financial markets, they’re likely in for a surprise. Likewise, with inflation still raging, the Fed should light plenty of hawkish fireworks in the coming months.
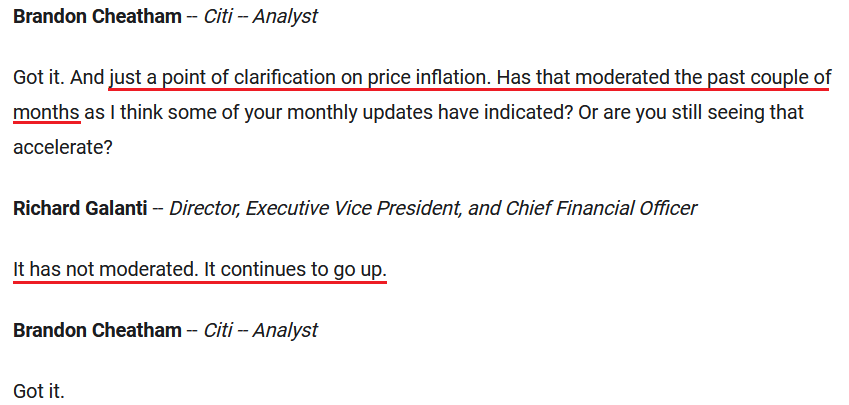
As further evidence, Costco released its second-quarter earnings on Mar. 3. Regarding inflation, CFO Richard Galanti said, “For the first quarter, I mentioned that we estimated, at that time, overall price inflation to have been in the 4.5% to 5% range. For the second quarter and talking with senior merchants, estimated overall price inflation was in the 6% range.
Has the situation improved?
 Source: Costco/The Motley Fool
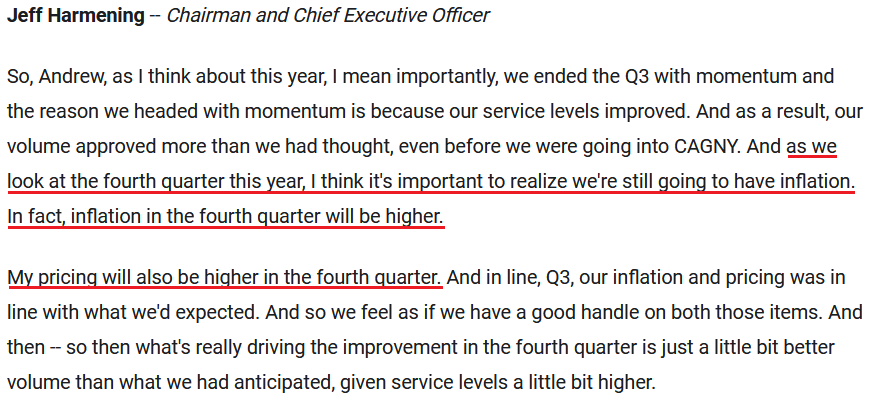
Singing a similar tune, General Mills released its third-quarter earnings on Mar. 23. CEO Jeff Harmening said:
 Source: General Mills/The Motley Fool
As a result, when two U.S. behemoths tell you that inflation is still extremely problematic, does it seem like we’re in an environment where the Fed can back down? Of course not. That’s why I’ve been warning for months that inflation would force the Fed into a hawkish corner.
While investors still hold out hope that inflation will calm on its own and the Fed will turn dovish again, the reality is that most things have gotten worse, not better. As such, the hawkish surprises should continue, and the PMs should suffer mightily as the drama unfolds.
Finally, while the consensus has been late to the party, the mood music is shifting.
Please see below:
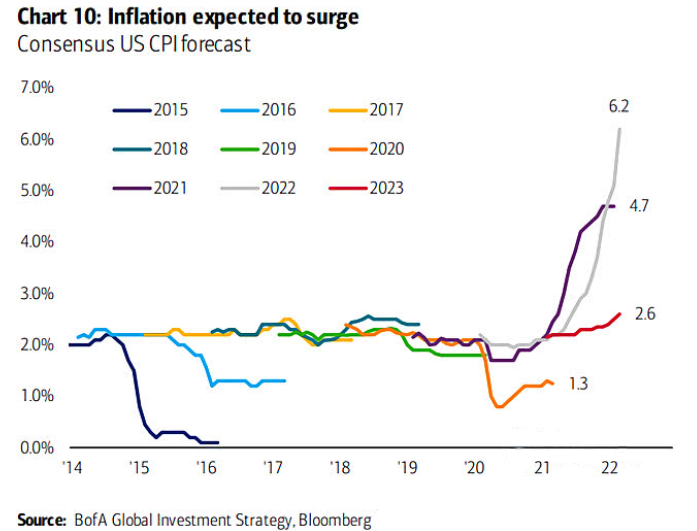
To explain, the various lines above track economists’ consensus estimates for the annualized percentage change in the headline Consumer Price Index (CPI). If you analyze the movement of the gray line (2022), notice how inflation expectations have spiked in recent months. Moreover, if you turn your attention to the movement of the red line (2023), you can see that next year’s inflation expectations are also rising. As a result, the Fed needs to fire plenty of hawkish bullets to finally kill inflation.
The bottom line? The PMs and the general stock market remain in la-la land. Despite repeated warnings from Fed officials and a rout in the bond market, both asset classes continue to ignore the potential ramifications. However, with the medium term likely to elicit a profound shift in sentiment, the Fed’s war with inflation should send shockwaves across the financial markets.
In conclusion, the PMs were mixed on Mar. 25, as denial remains the name of the game. However, with the Fed poised to shatter their confidence over the next few months, several asset classes should experience heightened volatility. Thus, while the price action diverges, the PMs’ medium-term fundamentals have severely deteriorated, and it’s likely only a matter of time before reality re-emerges.
Overview of the Upcoming Part of the Decline
- It seems to me that the corrective upswing is now over or very close to being over , and that gold, silver, and mining stocks are now likely to continue their medium-term decline.
- It seems that the first (bigger) stop for gold will be close to its previous 2021 lows, slightly below $1,800 . Then it will likely correct a bit, but it’s unclear if I want to exit or reverse the current short position based on that – it depends on the number and the nature of the bullish indications that we get at that time.
- After the above-mentioned correction, we’re likely to see a powerful slide, perhaps close to the 2020 low ($1,450 - $1,500).
- If we see a situation where miners slide in a meaningful and volatile way while silver doesn’t (it just declines moderately), I plan to – once again – switch from short positions in miners to short positions in silver. At this time, it’s too early to say at what price levels this could take place, and if we get this kind of opportunity at all – perhaps with gold close to $1,600.
- I plan to exit all remaining short positions once gold shows substantial strength relative to the USD Index while the latter is still rallying. This may be the case with gold close to $1,350 - $1,400. I expect silver to fall the hardest in the final part of the move. This moment (when gold performs very strongly against the rallying USD and miners are strong relative to gold after its substantial decline) is likely to be the best entry point for long-term investments, in my view. This can also happen with gold close to $1,375, but at the moment it’s too early to say with certainty.
- As a confirmation for the above, I will use the (upcoming or perhaps we have already seen it?) top in the general stock market as the starting point for the three-month countdown. The reason is that after the 1929 top, gold miners declined for about three months after the general stock market started to slide. We also saw some confirmations of this theory based on the analogy to 2008. All in all, the precious metals sector is likely to bottom about three months after the general stock market tops.
- The above is based on the information available today, and it might change in the following days/weeks.
You will find my general overview of the outlook for gold on the chart below:
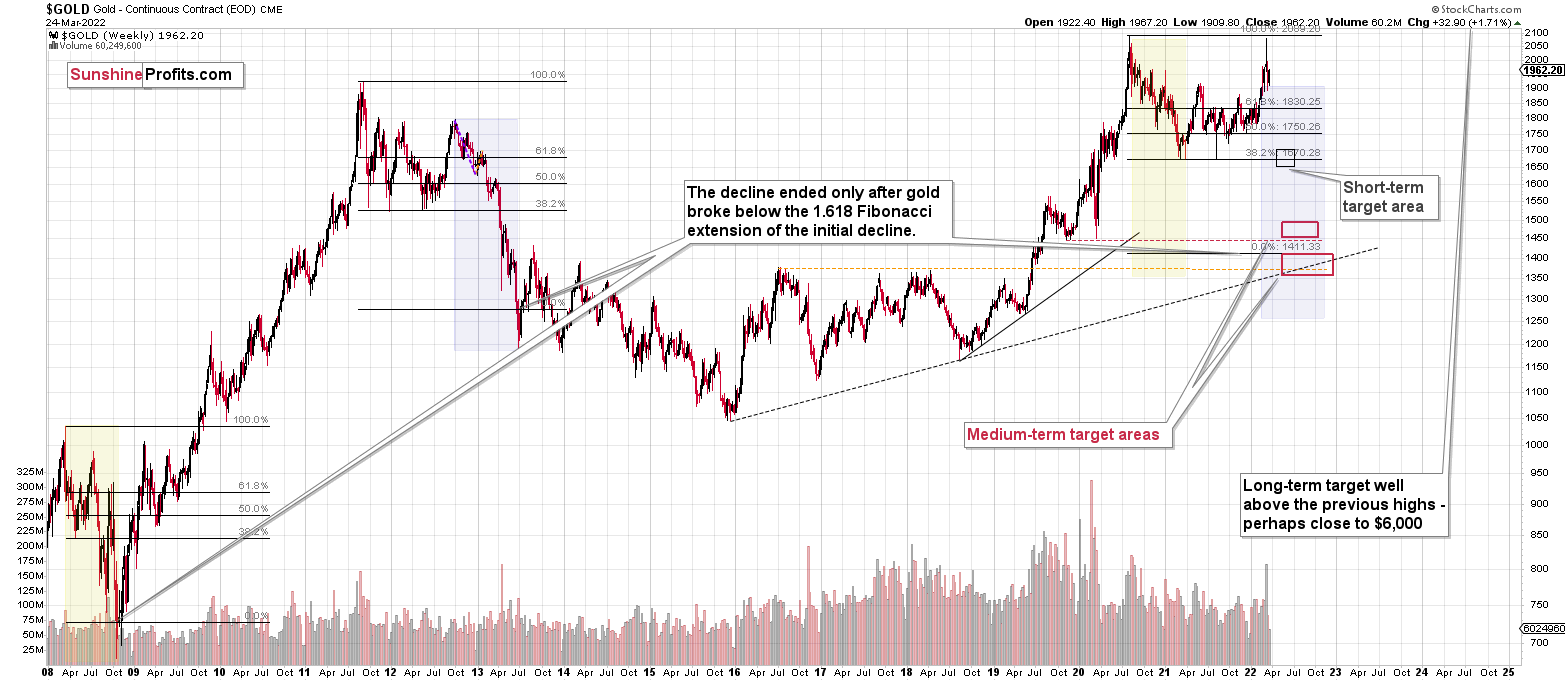
Please note that the above timing details are relatively broad and “for general overview only” – so that you know more or less what I think and how volatile I think the moves are likely to be – on an approximate basis. These time targets are not binding or clear enough for me to think that they should be used for purchasing options, warrants or similar instruments.
Summary
Summing up, despite the recent rally in gold, the outlook for junior mining stocks remains exactly as I described previously.
Crude oil’s extreme outperformance, the stock market’s weakness, and critical medium-term resistance levels reached by gold (all-time high!) and junior mining stocks, all indicate that the tops are at hand or have just formed. The huge-volume reversals in gold and (especially) mining stocks, along with silver’s short-term outperformance, all point to lower precious metals prices in the following days/weeks. It seems that the top is in.
Investing and trading are difficult. If it was easy, most people would be making money – and they’re not. Right now, it’s most difficult to ignore the urge to “run for cover” if you physically don’t have to. The markets move on “buy the rumor and sell the fact.” This repeats over and over again in many (all?) markets, and we have direct analogies to similar situations in gold itself. Junior miners are likely to decline the most, also based on the massive declines that are likely to take place (in fact, they have already started) in the stock markets.
From the medium-term point of view, the two key long-term factors remain the analogy to 2013 in gold and the broad head and shoulders pattern in the HUI Index. They both suggest much lower prices ahead.
It seems that our profits from short positions are going to become truly epic in the coming months.
After the sell-off (that takes gold to about $1,350-$1,500), I expect the precious metals to rally significantly. The final part of the decline might take as little as 1-5 weeks, so it's important to stay alert to any changes.
Most importantly, please stay healthy and safe. We made a lot of money last March and this March, and it seems that we’re about to make much more in the upcoming decline, but you have to be healthy to enjoy the results.
As always, we'll keep you - our subscribers - informed.
To summarize:
Trading capital (supplementary part of the portfolio; our opinion): Full speculative short positions (300% of the full position) in junior mining stocks are justified from the risk to reward point of view with the following binding exit profit-take price levels:
Mining stocks (price levels for the GDXJ ETF): binding profit-take exit price: $34.63; stop-loss: none (the volatility is too big to justify a stop-loss order in case of this particular trade)
Alternatively, if one seeks leverage, we’re providing the binding profit-take levels for the JDST (2x leveraged) and GDXD (3x leveraged – which is not suggested for most traders/investors due to the significant leverage). The binding profit-take level for the JDST: $14.98; stop-loss for the JDST: none (the volatility is too big to justify a SL order in case of this particular trade); binding profit-take level for the GDXD: $25.48; stop-loss for the GDXD: none (the volatility is too big to justify a SL order in case of this particular trade).
For-your-information targets (our opinion; we continue to think that mining stocks are the preferred way of taking advantage of the upcoming price move, but if for whatever reason one wants / has to use silver or gold for this trade, we are providing the details anyway.):
Silver futures downside profit-take exit price: $19.12
SLV profit-take exit price: $17.72
ZSL profit-take exit price: $38.28
Gold futures downside profit-take exit price: $1,683
HGD.TO – alternative (Canadian) inverse 2x leveraged gold stocks ETF – the upside profit-take exit price: $11.79
HZD.TO – alternative (Canadian) inverse 2x leveraged silver ETF – the upside profit-take exit price: $29.48
Long-term capital (core part of the portfolio; our opinion): No positions (in other words: cash
Insurance capital (core part of the portfolio; our opinion): Full position
Whether you already subscribed or not, we encourage you to find out how to make the most of our alerts and read our replies to the most common alert-and-gold-trading-related-questions.
Please note that we describe the situation for the day that the alert is posted in the trading section. In other words, if we are writing about a speculative position, it means that it is up-to-date on the day it was posted. We are also featuring the initial target prices to decide whether keeping a position on a given day is in tune with your approach (some moves are too small for medium-term traders, and some might appear too big for day-traders).
Additionally, you might want to read why our stop-loss orders are usually relatively far from the current price.
Please note that a full position doesn't mean using all of the capital for a given trade. You will find details on our thoughts on gold portfolio structuring in the Key Insights section on our website.
As a reminder - "initial target price" means exactly that - an "initial" one. It's not a price level at which we suggest closing positions. If this becomes the case (like it did in the previous trade), we will refer to these levels as levels of exit orders (exactly as we've done previously). Stop-loss levels, however, are naturally not "initial", but something that, in our opinion, might be entered as an order.
Since it is impossible to synchronize target prices and stop-loss levels for all the ETFs and ETNs with the main markets that we provide these levels for (gold, silver and mining stocks - the GDX ETF), the stop-loss levels and target prices for other ETNs and ETF (among other: UGL, GLL, AGQ, ZSL, NUGT, DUST, JNUG, JDST) are provided as supplementary, and not as "final". This means that if a stop-loss or a target level is reached for any of the "additional instruments" (GLL for instance), but not for the "main instrument" (gold in this case), we will view positions in both gold and GLL as still open and the stop-loss for GLL would have to be moved lower. On the other hand, if gold moves to a stop-loss level but GLL doesn't, then we will view both positions (in gold and GLL) as closed. In other words, since it's not possible to be 100% certain that each related instrument moves to a given level when the underlying instrument does, we can't provide levels that would be binding. The levels that we do provide are our best estimate of the levels that will correspond to the levels in the underlying assets, but it will be the underlying assets that one will need to focus on regarding the signs pointing to closing a given position or keeping it open. We might adjust the levels in the "additional instruments" without adjusting the levels in the "main instruments", which will simply mean that we have improved our estimation of these levels, not that we changed our outlook on the markets. We are already working on a tool that would update these levels daily for the most popular ETFs, ETNs and individual mining stocks.
Our preferred ways to invest in and to trade gold along with the reasoning can be found in the how to buy gold section. Furthermore, our preferred ETFs and ETNs can be found in our Gold & Silver ETF Ranking.
As a reminder, Gold & Silver Trading Alerts are posted before or on each trading day (we usually post them before the opening bell, but we don't promise doing that each day). If there's anything urgent, we will send you an additional small alert before posting the main one.
Thank you.
Przemyslaw Radomski, CFA
Founder, Editor-in-chief

