

Briefly: in our opinion, full (300% of the regular position size) speculative short positions in mining stocks are justified from the risk/reward point of view at the moment of publishing this Alert.
In yesterday’s extensive analysis, I elaborated on multiple factors due to which the precious metals sector is likely to move lower in the following weeks/months. I emphasized that with each passing day we see additional bearish confirmations as gold stocks continue to be weak relative to gold and silver is either strong relative to gold or performs relatively normally. Gold is also not reacting to the indications from the USD Index that “should have” caused it to rally strongly.
And today we once again see more of the same – more bearish confirmations from the relative front.
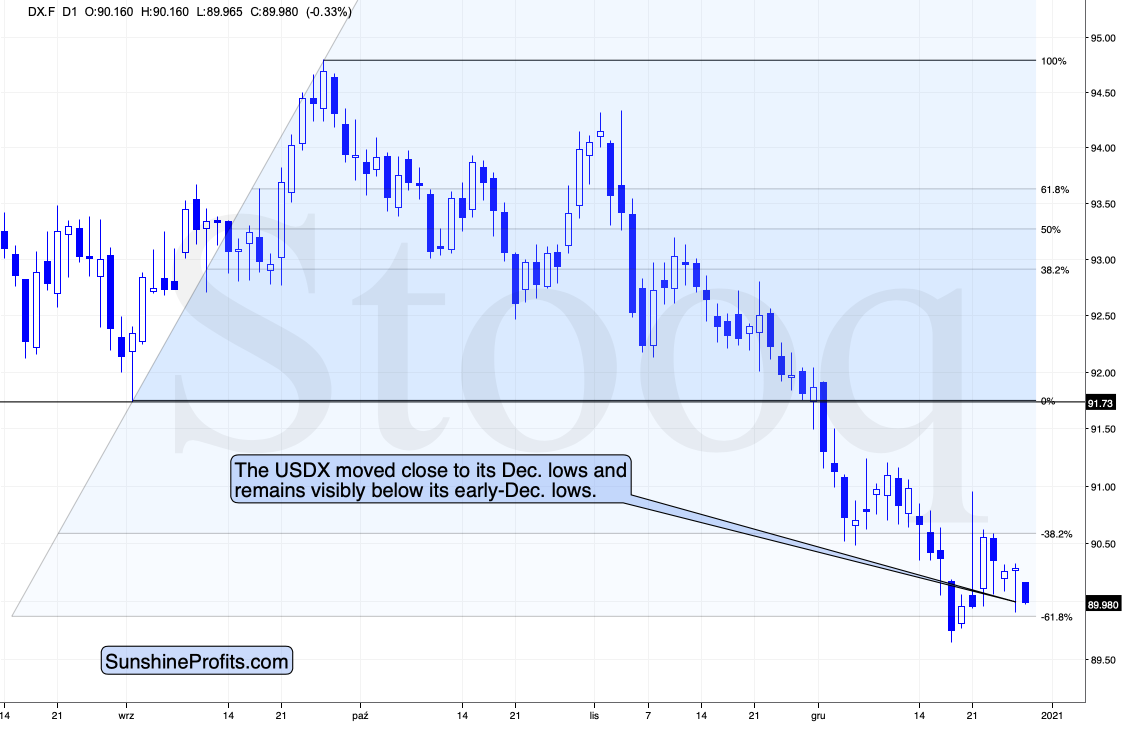
Figure 1 – USD Index
Yesterday, the USDX moved down and then back up, so the fact that gold did the opposite is relatively normal.
However, today, the USDX moved close to its yesterday’s intraday lows while at the same time…
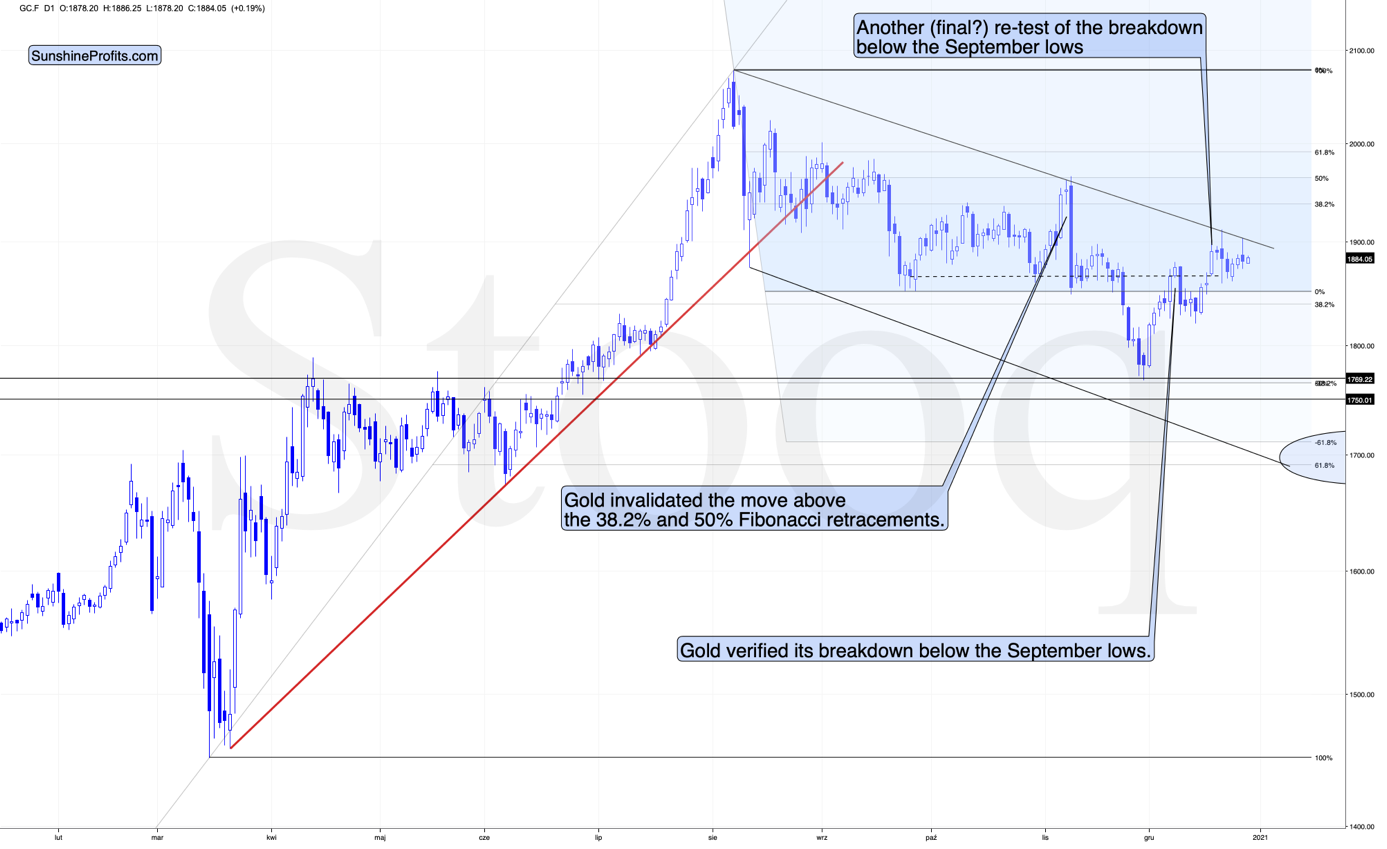
Figure 2 – COMEX Gold Futures
Gold didn’t move close to its yesterday’s intraday high.
While the USD Index is clearly and visibly below its early-December low, gold is just slightly above its early-December high.
Overall, from both the short-term and very-short-term perspective, the gold-USD link has bearish implications for the yellow metal.
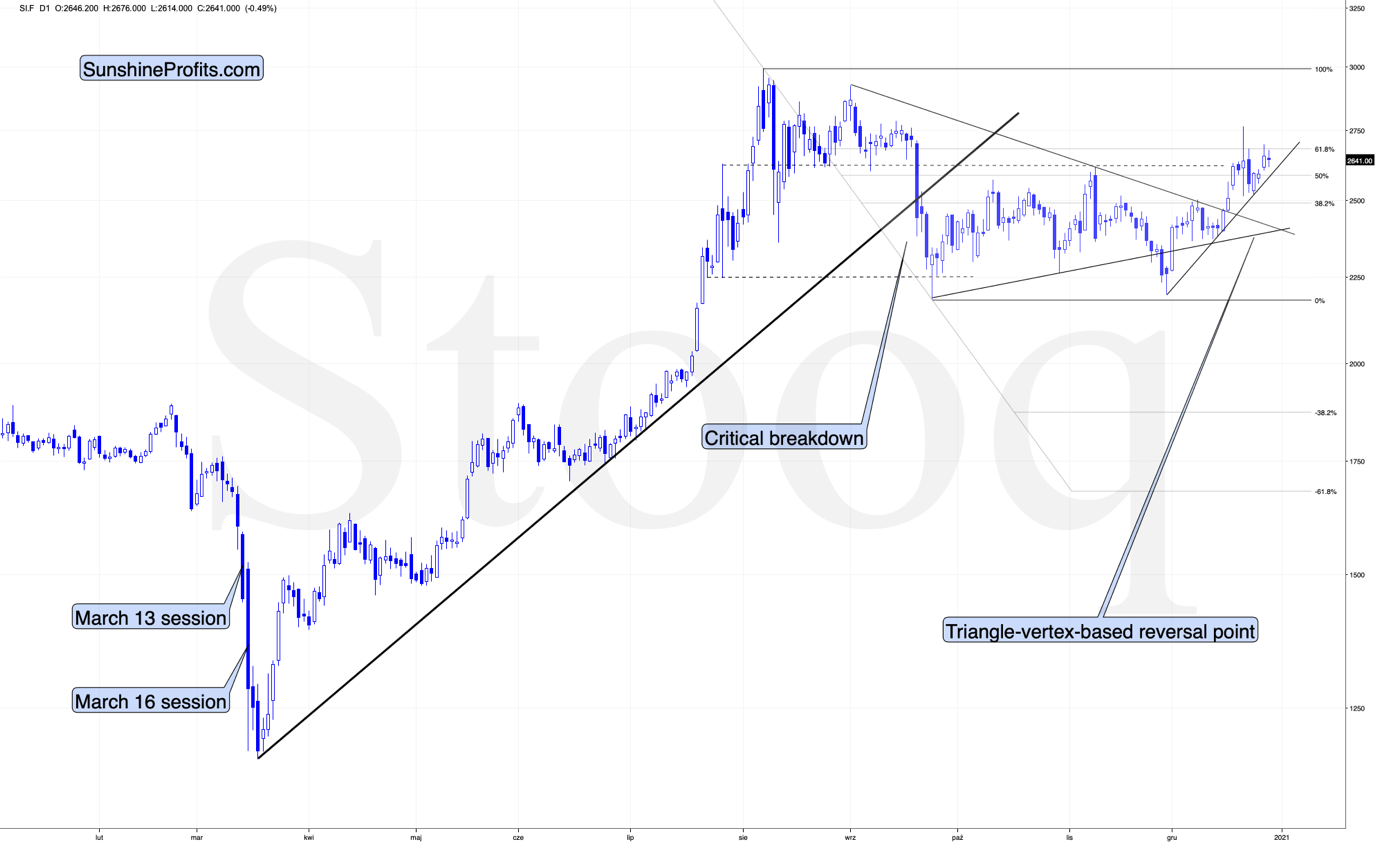
Figure 3 – COMEX Silver Futures
Silver is not only above its early-December high, it’s also above its October and November highs. The white metal is clearly outperforming gold. This combined with gold miners’ underperformance is something that we’ve seen over and over again before bigger declines. The implications are clearly bearish.
And speaking of mining stocks…
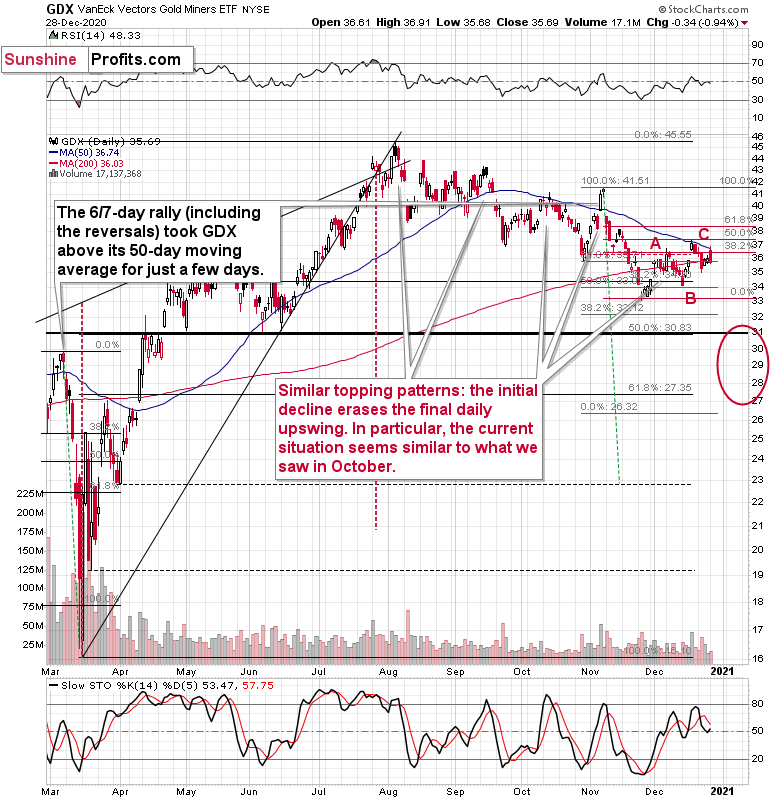
Figure 4 – GDX VanEck Vectors Gold Miners ETF
We see that the GDX ETF moved lower again despite the intraday attempt to rally. During yesterday’s session, miners moved back to their 50-day moving average once more, again verifying it as resistance. The implications are bearish.
Let’s get back to silver. On its chart (figure 3), you can see a triangle-vertex-based reversal at the end of the year. Before the price moves close to the reversal, it’s relatively unclear what kind of implications a given reversal is likely to have. Well, including today’s session, there remain only three sessions until the end of the year, so we’re likely to see the reversal shortly.
Based on the likelihood that the next big move is going to be to the downside, it would fit the overall picture more if the upcoming reversal was a top, not a bottom. A bottom would imply a rally in the following days or weeks, and the relative performance (as described above and yesterday) along with other factors (as described yesterday) continues to favor a bigger decline.
This means that we might not see a meaningful decline for a few more days, and we might even see one final move higher before the top is formed. This could be something that takes place in silver only or something that we see in gold and miners as well. Still, I don’t expect a move higher to be really significant in the case of the latter. The miners are underperforming the metals, after all.
Irrational Exuberance
Yesterday, I highlighted how S&P 500 (SPX) valuations are teetering on the brink of insanity. Across 11 of 15 fundamental metrics, the U.S. equity benchmark is either as, or more overvalued than at any point in the index’s history.
For more context, please see the chart below:
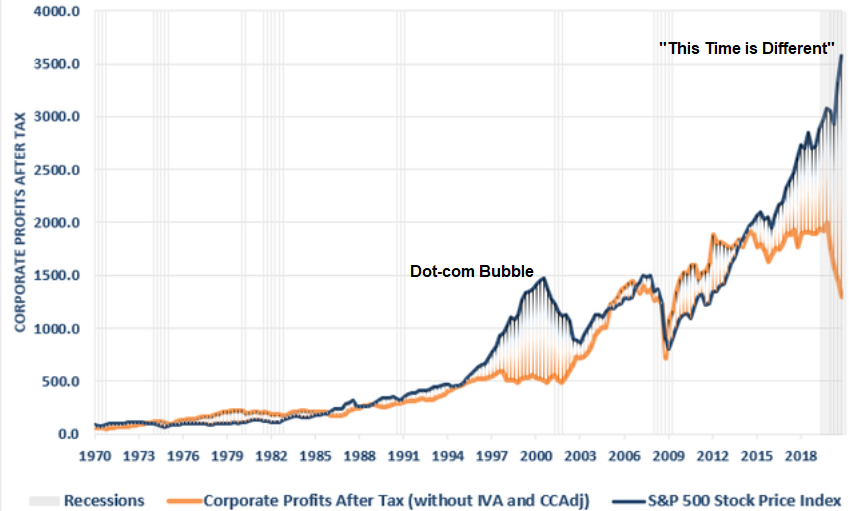 Figure 5 – (Source: Real Investment Advice)
To explain, the blue line (from left to right) represents the S&P 500’s price movement over the last ~50 years; showing a strong correlation, the orange line represents net-income earned by the index’s constituents during the same time period.
Analyzing the relationship, their movements are nearly identical. And the logic makes sense: Stock prices should trend higher (and lower) with earnings.
However, the dot-com bubble decided those rules no longer applied.
Notice the large gap between the 1997 and 2003 labels?
Well, when unprofitable tech companies convinced investors that clicks were greater than cash, valuations exploded beyond reason. But like other historical parabolas, gravity eventually took hold and the S&P 500 plunged by more than 50%.
Now look at the current gap:
In history, there has never been a larger divergence between valuations and fundamentals (net-income). And while pundits continue to suggest that “this time is different,” the chart suggests otherwise. Notice how the two lines eventually reconnect? If history repeats, there are two possible outcomes:
- Stock prices decline substantially to reflect the drop in net-income.
- Net-income rises sharply and catches up with stock prices.
And which outcome is most likely?
Well, given where we are in the business cycle, the latter seems nearly impossible. As evidence, the latest release from the U.S. Department of Labor (on December 23) shows that more than 20 million people are still collecting some form of unemployment benefits (the red box on the left).
Please see below:
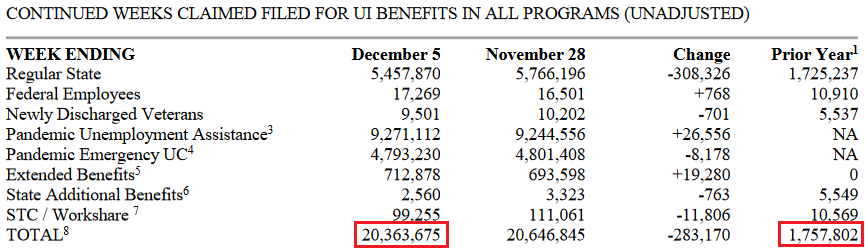 Figure 6 – (Source: U.S. Department of Labor)
In contrast, less than two million people were collecting unemployment benefits during the same period last year (the red box on the right).
Isaac Newton once said, “I can calculate the motion of heavenly bodies, but not the madness of people.”
And that madness? Well, it’s on full display right now.
While U.S. equities make new all-time highs, the latest data from the U.S. Financial Industry Regulatory Authority (FINRA) shows that monthly margin debt has exploded (and is currently at a five-year high).
Please see below:
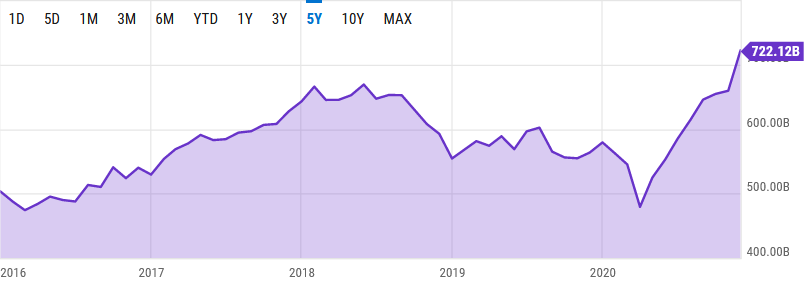 Figure 7 – (Source: FINRA)
To explain, margin is used by investors to increase the amount of assets in their portfolio. Essentially, it increases their buying power. For example, if an investor has $100,000 in cash, he can borrow $100,000 and increase his portfolio holdings to $200,000 (50% margin). And in a nutshell, speculative investors use margin to increase their total returns.
However, like a double-edged sword, margin also increases losses when trades go south. At the same time, brokerages can issue a ‘margin call’ and force the investor to sell all of his holdings.
The key takeaway?
High margin is a sign of excessive risk-taking. And when investors tilt their boat too far to one side, it often capsizes.
The bottom line is: If/when the equity market takes on water, the precious metals won’t be given a life jacket. Thus, it will be a long swim back to shore before, gold, silver and the miners are able to return to their previous highs.
U.S. Dollar Futures Update:
With prior resistance now acting as support, USD Index sentiment may have already shifted. After U.S. President Donald Trump delivered a Sunday surprise (Dec. 27) – signing the $900 billion coronavirus relief bill – the U.S. dollar didn’t flinch.
Trading roughly flat on Monday (Dec. 28), its behavior sharply contrasted the ‘death of the dollar’ narrative that’s been prevalent over the last several weeks.
So where are we headed?
Well, we may be on the cusp of one of the biggest short-squeezes ever.
For weeks, I’ve been warning about the excessive bearishness across the speculative futures market (non-commercial traders). And after another update, USD net-short positions are now at their highest level since 2006.
Please see the chart below:
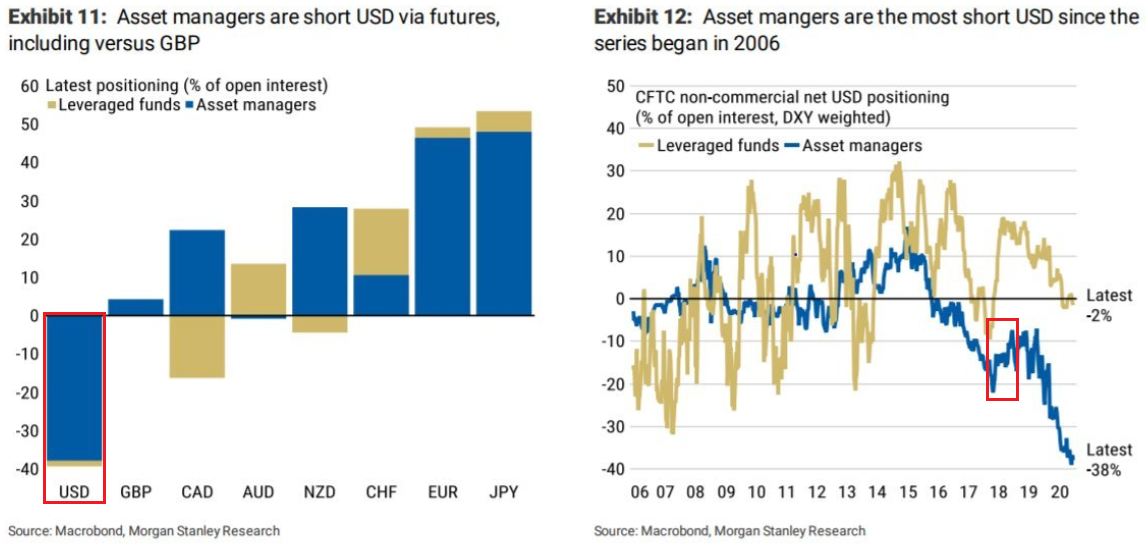
Figure 8 – Net-short futures positions
If you analyze the second red box (on the right side), you can see that the 2018 top in net-short futures positions ended with a violent short-covering rally, which propelled the USDX nearly 11% higher from trough to peak.
And considering that positioning is even more extreme today, the forethcoming rally could deliver plenty of fireworks.
Letters to the Editor
Q: Thanks for the heads up, but I prefer to look at the big picture. Care to hazard a guess as to where gold and silver will be any number of years down the road?
A: From the broader point of view, I think that after sliding below $1,700, gold is likely to soar above the previous highs, perhaps even above $5,000 - please take a look at this analysis for details. As far as silver is concerned, I think that with gold at or above $5000, silver could be above $200, maybe even above $300. So, I’m very bullish for the next decade or so, but bearish for the next several months / weeks. Of course, I can’t make any guarantees, but the above is my best (educated, but still) guesstimate.
Overview of the Upcoming Decline
- As far as the current overview of the upcoming decline is concerned, I think it has already begun.
- During the final part of the slide (which could end within the next 1-10 weeks or so), I expect silver to decline more than miners. That would align with how the markets initially reacted to the COVID-19 threat.
- The impact of all the new rounds of money printing in the U.S. and Europe on the precious metals prices is incredibly positive in the long run, which does not make the short-term decline improbable. Markets can and will get ahead of themselves and decline afterward – sometimes very profoundly – before continuing with their upward climb.
- The plan is to exit the current short positions in miners after they decline far and fast, but at the same time, silver drops just “significantly” (we expect this to happen in 1 – 5 weeks ). In other words, the decline in silver should be severe, but the decline in the miners should look “ridiculous”. That’s what we did in March when we bought practically right at the bottom . It is a soft, but simultaneously broad instruction, so additional confirmations are necessary.
- I expect this confirmation to come from gold, reaching about $1,700 - $1,750 . If – at the same time – gold moves to about $1,700 - $1,750 and miners are already after a ridiculously big drop (say, to $31 - $32 in the GDX ETF – or lower), we will probably exit the short positions in the miners and at the same time enter short positions in silver. However, it could also be the case that we’ll wait for a rebound before re-entering short positions in silver – it’s too early to say at this time. It’s also possible that we’ll enter very quick long positions between those short positions.
- The precious metals market's final bottom is likely to take shape when gold shows significant strength relative to the USD Index . It could take the form of a gold’s rally or a bullish reversal, despite the ongoing USD Index rally.
Summary
While Christmas came early for the precious metals last week, the holiday cheer isn’t likely to last very long. Despite doing its best Santa Clause impersonation, silver’s gift-giving isn’t rubbing off on gold or the gold miners. And given its relative outperformance, it’s most likely only a matter of time before silver’s sleigh crashes.
The divergent price action signals that the next move lower in the precious metals market is already underway. It will likely take another 1-5 weeks to play out (or perhaps even longer), with gold falling to or below $1,700 and with a substantial decline in silver (downside target is unclear) and miners ($1,700 in gold is likely to correspond to about $31 in GDX).
Remember, the recent upswing is a relatively normal bounce within a bigger decline. And after last week’s drawdown, this corrective upswing might have already ended.
Despite a recent decline, it seems that the USD Index is going to move higher in the following months and weeks, in turn causing gold to decline. At some point gold is likely to stop responding to dollar’s bearish indications, and based on the above analysis, it seems that this is already taking place.
Naturally, everyone's trading is their responsibility. But in our opinion, if there ever was a time to either enter a short position in the miners or increase its size if it was not already sizable, it's now. We made money on the March decline, and on the March rebound, with another massive slide already underway.
After the sell-off (that takes gold to about $1,700 or lower), we expect the precious metals to rally significantly. The final decline might take as little as 1-5 weeks, so it's important to stay alert to any changes.
Most importantly, please stay healthy and safe. We made a lot of money on the March decline and the subsequent rebound (its initial part) price moves (and we'll likely earn much more in the following weeks and months), but you have to be healthy to enjoy the results.
As always, we'll keep you - our subscribers - informed.
To summarize:
Trading capital (supplementary part of the portfolio; our opinion): Full speculative short positions (300% of the full position) in mining stocks is justified from the risk to reward point of view with the following binding exit profit-take price levels:
Senior mining stocks (price levels for the GDX ETF): binding profit-take exit price: $32.02; stop-loss: none (the volatility is too big to justify a SL order in case of this particular trade); binding profit-take level for the DUST ETF: $28.73; stop-loss for the DUST ETF: none (the volatility is too big to justify a SL order in case of this particular trade)
Junior mining stocks (price levels for the GDXJ ETF): binding profit-take exit price: $42.72; stop-loss: none (the volatility is too big to justify a SL order in case of this particular trade); binding profit-take level for the JDST ETF: $21.22; stop-loss for the JDST ETF: none (the volatility is too big to justify a SL order in case of this particular trade)
For-your-information targets (our opinion; we continue to think that mining stocks are the preferred way of taking advantage of the upcoming price move, but if for whatever reason one wants / has to use silver or gold for this trade, we are providing the details anyway. In our view, silver has greater potential than gold does):
Silver futures downside profit-take exit price: unclear at this time - initially, it might be a good idea to exit, when gold moves to $1,703.
Gold futures downside profit-take exit price: $1,703
Long-term capital (core part of the portfolio; our opinion): No positions (in other words: cash
Insurance capital (core part of the portfolio; our opinion): Full position
Whether you already subscribed or not, we encourage you to find out how to make the most of our alerts and read our replies to the most common alert-and-gold-trading-related-questions.
Please note that we describe the situation for the day that the alert is posted in the trading section. In other words, if we are writing about a speculative position, it means that it is up-to-date on the day it was posted. We are also featuring the initial target prices to decide whether keeping a position on a given day is in tune with your approach (some moves are too small for medium-term traders, and some might appear too big for day-traders).
Additionally, you might want to read why our stop-loss orders are usually relatively far from the current price.
Please note that a full position doesn't mean using all of the capital for a given trade. You will find details on our thoughts on gold portfolio structuring in the Key Insights section on our website.
As a reminder - "initial target price" means exactly that - an "initial" one. It's not a price level at which we suggest closing positions. If this becomes the case (like it did in the previous trade), we will refer to these levels as levels of exit orders (exactly as we've done previously). Stop-loss levels, however, are naturally not "initial", but something that, in our opinion, might be entered as an order.
Since it is impossible to synchronize target prices and stop-loss levels for all the ETFs and ETNs with the main markets that we provide these levels for (gold, silver and mining stocks - the GDX ETF), the stop-loss levels and target prices for other ETNs and ETF (among other: UGL, GLL, AGQ, ZSL, NUGT, DUST, JNUG, JDST) are provided as supplementary, and not as "final". This means that if a stop-loss or a target level is reached for any of the "additional instruments" (GLL for instance), but not for the "main instrument" (gold in this case), we will view positions in both gold and GLL as still open and the stop-loss for GLL would have to be moved lower. On the other hand, if gold moves to a stop-loss level but GLL doesn't, then we will view both positions (in gold and GLL) as closed. In other words, since it's not possible to be 100% certain that each related instrument moves to a given level when the underlying instrument does, we can't provide levels that would be binding. The levels that we do provide are our best estimate of the levels that will correspond to the levels in the underlying assets, but it will be the underlying assets that one will need to focus on regarding the signs pointing to closing a given position or keeping it open. We might adjust the levels in the "additional instruments" without adjusting the levels in the "main instruments", which will simply mean that we have improved our estimation of these levels, not that we changed our outlook on the markets. We are already working on a tool that would update these levels daily for the most popular ETFs, ETNs and individual mining stocks.
Our preferred ways to invest in and to trade gold along with the reasoning can be found in the how to buy gold section. Furthermore, our preferred ETFs and ETNs can be found in our Gold & Silver ETF Ranking.
As a reminder, Gold & Silver Trading Alerts are posted before or on each trading day (we usually post them before the opening bell, but we don't promise doing that each day). If there's anything urgent, we will send you an additional small alert before posting the main one.
Thank you.
Przemyslaw Radomski, CFA
Founder, Editor-in-chief

