

Briefly: in our opinion, full (250% of the regular size of the position) speculative short position in gold, silver, and mining stocks is justified from the risk/reward perspective at the moment of publishing this Alert.
Gold stocks have repeated their decline once again yesterday while gold and silver soldier on. When will the miners take gold and silver down with them? Underperformance is a critical sign of weakness, there’s no denying that. Would today’s Fed policy pronouncements provide the spark? While waiting, we explored everyone’s favorite subject: the CoT report. While an evergreen, today from an angle you probably haven’t heard before anywhere else. Get wiser and benefit!
Very little had changed from the short-term point of view based on yesterday’s session, so the part of our analysis that discusses the most recent events will be rather short. The market more or less repeated its previous signals, which simply added to their credibility.
Another Day, Another Signal Repeated
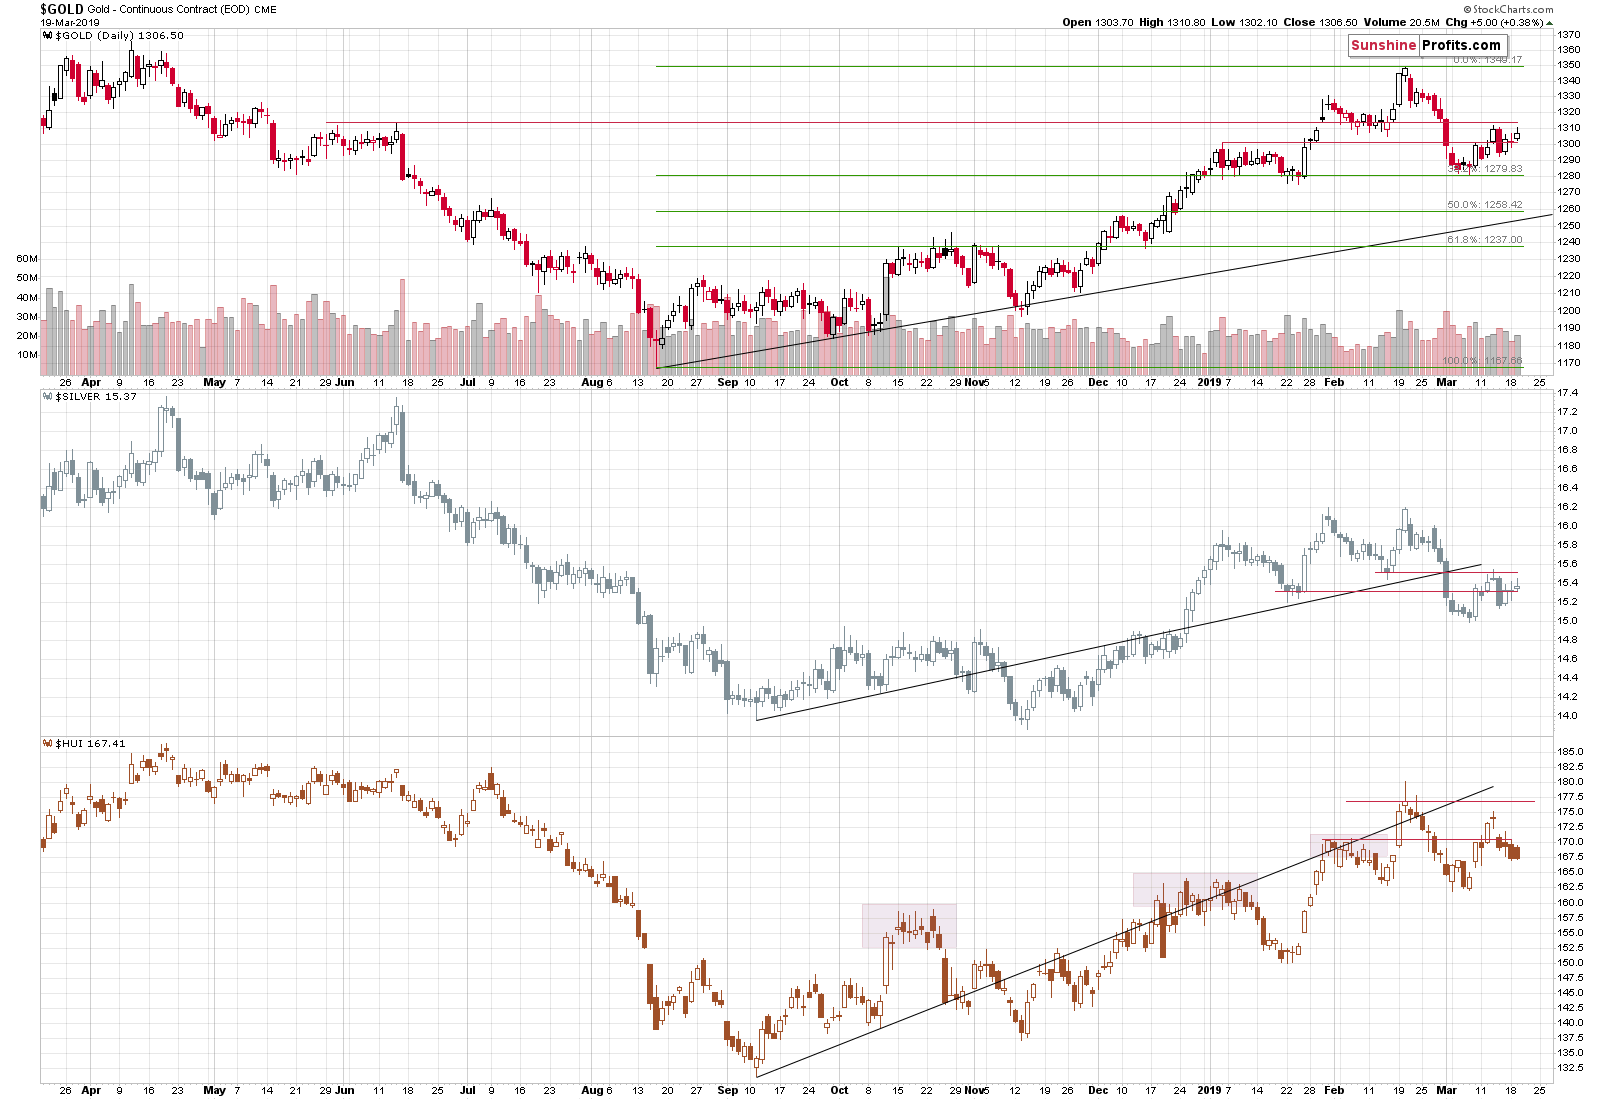
Gold stocks underperformed gold once again, which is a crystal-clear confirmation that the early-March rally is just a counter-trend bounce, not a start of another major upswing. This further validates what we wrote previously:
The important thing about Friday’s performance is that it was a second day when the miners declined, which was also a weekly close which partially confirms that the move lower was more than a correction within an upswing. The fact that miners just refused to move higher despite gold’s and silver’s upswing is a clear confirmation that in fact it was the recent upswing that was a correction by itself and the downswing was a return to normalcy, not the other way around. It may seem odd that a session, when miners have done anything in terms of the closing prices was so meaningful, but that actually was the case.
Yesterday’s close marked the third day after the decline, which confirmed the bearish nature of the recent price moves.
The second factor confirming the bearish nature of the recent moves in the PMs is the situation in the USD Index. In case of the US currency, our yesterday’s comments also remain up-to-date:
The USD Index: More of the Same
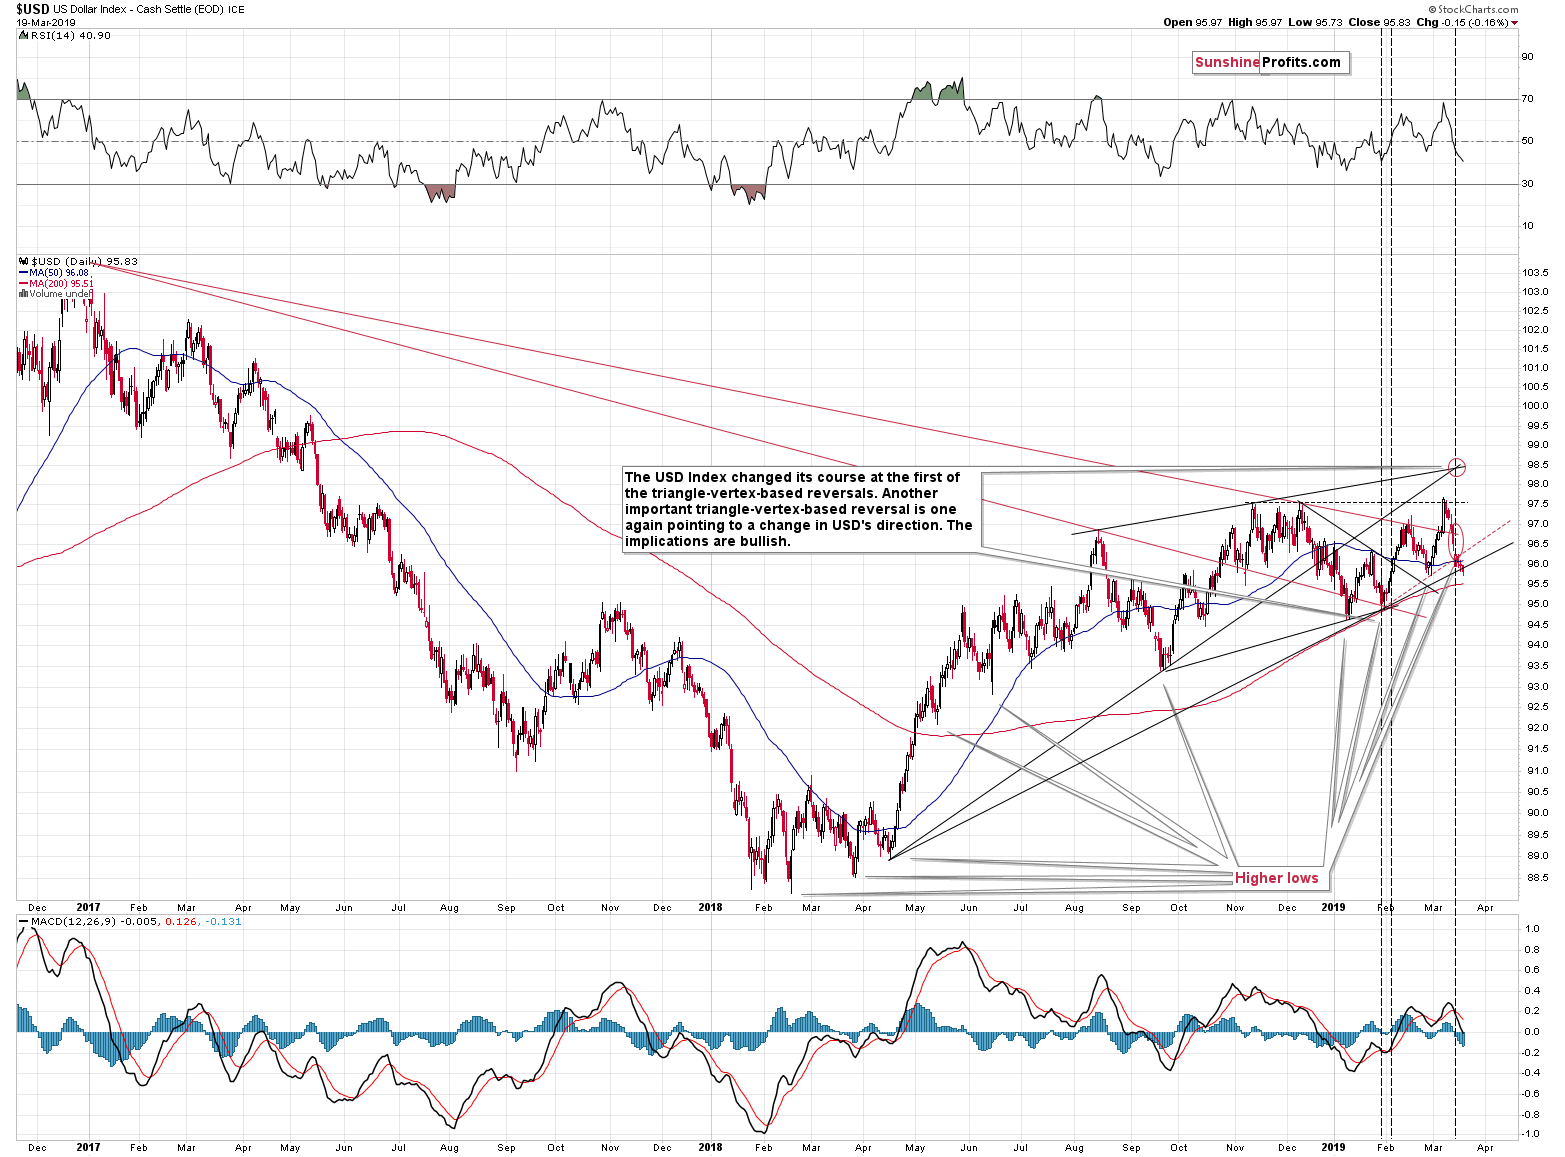
The USDX had previously moved to our target area and then just declined a little bit more. That’s not a serious breakdown as there are strong support levels just below and the above doesn’t change a lot for the USD itself. It was yet another higher low that fits the overall bullish picture for the medium term.
We see more interesting implications in case of the gold-USD link. The USDX is currently close to its recent lows, but gold is not even close to its early recent highs. Gold topped at $1345 in late February and its currently trading about $40 lower. This clearly shows the medium-term underperformance of gold and serves as a confirmation that the several-month-long corrective upswing in the precious metals market has come to an end. Actually, the big decline in the PMs is likely already underway.
The USDX moved a bit lower yesterday, but not below the late-February low, so we can still say that the local lows in the USDX have been formed at increasingly higher levels for more than a year. The US currency close a bit below the rising black support line, and we expect this move to be invalidated shortly.
Let’s keep in mind that today is the Fed policy decision day, so the price moves could be volatile. The Fed previously provided the market with a dovish surprise, so investors likely expect more dovish comments also this time. If the Fed is rather neutral, or even hawkish in its comments, the investors will be – once again – surprised, and the USD Index will likely rally. Gold and the rest of the PM sector are expected to decline in this case. Let’s keep in mind that the USD didn’t really slide after Fed’s previous dovish remarks. Precisely, there was a very initial decline that was then followed by more strength. The USDX sold off a bit recently, but given the change in Fed’s tone, it both could and should have declined much more. This (lack of) reaction shows strength of the USD and supports our medium-term outlook for the currency – we expect it to move much higher in the following months.
CoT Reports from a Different Angle
Having discussed the very recent developments, we would like to once again discuss the issue of the CoT reports and their predictive power. Once again, because we dedicated the first analysis of this year to this matter as we wanted to have something to link to whenever we receive more CoT-related questions and comments in order to put it all in the proper context. The thing that we will discuss today is what we recently received about the part of the CoT report – the money managers’ positions.
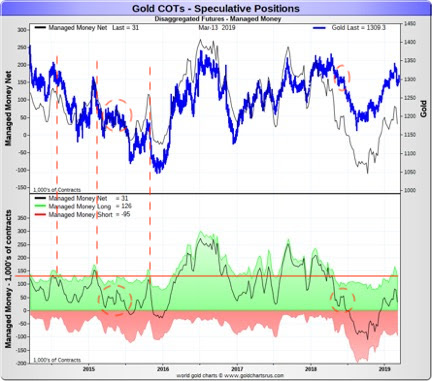
The upper part of the chart features the price of gold and the lower part of the chart shows the futures positions of the money managers on COMEX. The green area represents the long positions, while the red area represents the short positions. The black line shows the net positions (longs minus shorts).
This chart shows high correlation between gold and the net positions of money managers. Both have been moving in very close tune in the last few years. We were informed that this supposedly proves or indicates that gold price is manipulated. The moves being so highly correlated, so it must indicate that the money managers are responsible for gold’s price moves – right?
Did you know that the stock market returns are (inversely) correlated with the length of women’s skirts? Does it prove or indicate that the stock market movement is manipulated by skirt producers, skirt buyers, or skirt users?
Ummm… There must be some other explanation, I guess…
Of course there is – in both cases. The above link provides some possible explanations behind the skirt correlation and the other possible explanation is that stocks tend to move higher in the first half of the year. Most trading is done in the northern hemisphere, which means that it gets warmer in spring and thus short skirts are becoming more popular. In other words, the above may be just a fancy way to describe a regular market stock market seasonality.
In case of gold price, the explanation is even simpler. Investors’ sentiment moves along with price. This applies to both: professional and amateur investors. And… That’s it. This is enough to explain the high correlation between the money managers’ positions and the price of gold. As the price moves higher, investors get more confident and add to their positions and/or other investors become convinced that the price is going to move higher and enter the market.
But shouldn’t the professionals be more market-neutral? The investment public can be biased towards long positions, but the professionals shouldn’t.
It’s true that the investment public favors long positions, but the same can be said about the market professionals. The extent is not as big as in case of the former, but the tendency is still in place.
One reason is that when one’s running an investment service that allows shorting (for instance a private gold fund), they still have to adhere to the fund’s mandate. If it’s a gold fund, the odds are that it was presented as being a proxy for gold. Fund clients – often private investors – are likely going to favor a situation in which the fund invests in tune with the underlying market, not against it. This means that the fund manager and/or owner will be rewarded (more clients attracted) if they move in tune with the underlying asset. In our case, it would mean being mostly long gold.
Very few people will have clients that understand that at times it’s a good idea to either get out of the market or even temporarily enter a position against it, and even fewer money managers will have the courage to do so, even if they think that it’s a wise decision. Investors may not be willing to forgive a wrong decision that moves against their favorite market, but they would be more willing to forgive a wrong decision that’s in tune with their favorite market. This is really the case and we know this from our experience. We are blessed with clients who understand our approach, but we also know that if we simply followed the always-buy-gold mantra we would have bigger following. In our Alerts, we regularly choose doing what appears to be more profitable in the end, not what is more pleasant to read, but we know that it’s difficult and thus the natural drift toward long positions among money managers is perfectly understandable.
Just like there was a more believable explanation behind the stock-skirt manipulation theory, there is one for high correlation between gold and money managers’ positions. And the correlation is not as high in the very long run as the last few years might indicate.
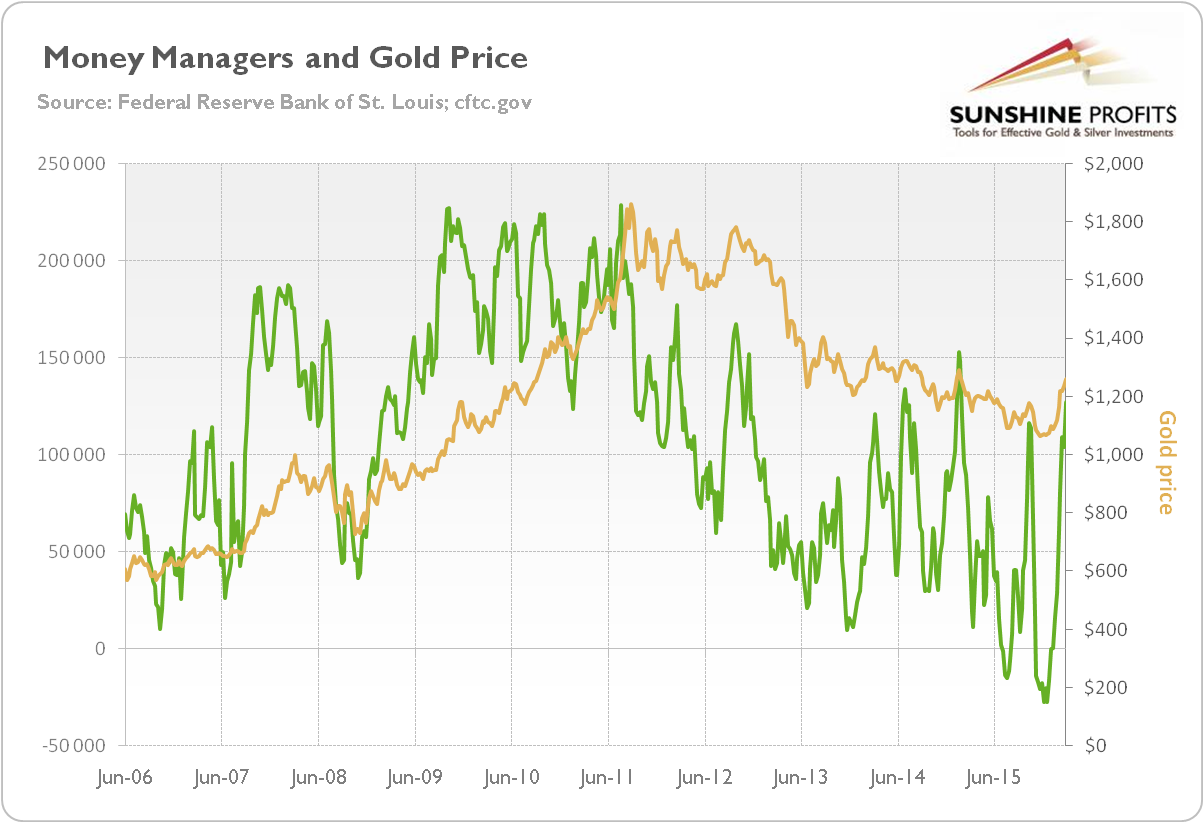
In the preceding years, money managers’ net position in gold was also correlated with gold, but to a much smaller extent. Please note that their net position topped in 2009 and then refused to move to new highs while gold was making them. In 2012, it was making new lows before gold did. Overall, the positions of money managers are not as highly correlated with gold as it seems based on the last few years, and even if it were, it would not be a significant indication, let alone proof that gold price is controlled by the money managers. This is what we can say based on the charts, without even taking into account how big the gold market really is and how many other gold market participants there are.
Before summarizing, let’s move back to the previous chart for a minute. The CoT positions are a weak technical indicator, but if one insists on using it, we can see some bearish indications on it. There were a few times when long positions in the money managers were at similar levels (red horizontal line) and all that indicated was that a bigger move lower has just begun (marked with red dashed lines). If we take the net position into account, we have a situation that’s similar to two other cases (marked with red ellipses) – gold declined in both cases as well. Again, this is not a very reliable indication, but since other techniques point to much lower prices of gold, it seems that we can use it as a confirmation. The outlook remains bearish.
Summary
Summing up, it’s almost certain that the next big move lower has already begun and that the 2013-like slide is in its early stage. Based on the updated version of the 2013-now link, the implications are even more bearish than we had initially assumed. The downside target for gold remains intact ($890), and the corrective upswing that we just saw seems to be rather natural part of the bigger move lower – not a beginning of an important move higher. And it seems that the corrective move higher in the PMs is either over or about to be over shortly.
To summarize:
Trading capital (supplementary part of the portfolio; our opinion): Full short position (250% of the full position) in gold, silver, and mining stocks is justified from the risk/reward perspective with the following stop-loss orders and exit profit-take price levels:
- Gold: profit-take exit price: $1,062; stop-loss: $1,357; initial target price for the DGLD ETN: $82.96; stop-loss for the DGLD ETN $39.87
- Silver: profit-take exit price: $12.32; stop-loss: $16.44; initial target price for the DSLV ETN: $47.67; stop-loss for the DSLV ETN $23.68
- Mining stocks (price levels for the GDX ETF): profit-take exit price: $13.12; stop-loss: $24.17; initial target price for the DUST ETF: $76.87; stop-loss for the DUST ETF $15.47
Note: the above is a specific preparation for a possible sudden price drop, it does not reflect the most likely outcome. You will find a more detailed explanation in our August 1st Alert. In case one wants to bet on junior mining stocks’ prices (we do not suggest doing so – we think senior mining stocks are more predictable in the case of short-term trades – if one wants to do it anyway, we provide the details), here are the stop-loss details and target prices:
- GDXJ ETF: profit-take exit price: $17.52; stop-loss: $35.67
- JDST ETF: initial target price: $143.87 stop-loss: $30.97
Long-term capital (core part of the portfolio; our opinion): No positions (in other words: cash)
Insurance capital (core part of the portfolio; our opinion): Full position
Important Details for New Subscribers
Whether you already subscribed or not, we encourage you to find out how to make the most of our alerts and read our replies to the most common alert-and-gold-trading-related-questions.
Please note that the in the trading section we describe the situation for the day that the alert is posted. In other words, it we are writing about a speculative position, it means that it is up-to-date on the day it was posted. We are also featuring the initial target prices, so that you can decide whether keeping a position on a given day is something that is in tune with your approach (some moves are too small for medium-term traders and some might appear too big for day-traders).
Plus, you might want to read why our stop-loss orders are usually relatively far from the current price.
Please note that a full position doesn’t mean using all of the capital for a given trade. You will find details on our thoughts on gold portfolio structuring in the Key Insights section on our website.
As a reminder – “initial target price” means exactly that – an “initial” one, it’s not a price level at which we suggest closing positions. If this becomes the case (like it did in the previous trade) we will refer to these levels as levels of exit orders (exactly as we’ve done previously). Stop-loss levels, however, are naturally not “initial”, but something that, in our opinion, might be entered as an order.
Since it is impossible to synchronize target prices and stop-loss levels for all the ETFs and ETNs with the main markets that we provide these levels for (gold, silver and mining stocks – the GDX ETF), the stop-loss levels and target prices for other ETNs and ETF (among other: UGLD, DGLD, USLV, DSLV, NUGT, DUST, JNUG, JDST) are provided as supplementary, and not as “final”. This means that if a stop-loss or a target level is reached for any of the “additional instruments” (DGLD for instance), but not for the “main instrument” (gold in this case), we will view positions in both gold and DGLD as still open and the stop-loss for DGLD would have to be moved lower. On the other hand, if gold moves to a stop-loss level but DGLD doesn’t, then we will view both positions (in gold and DGLD) as closed. In other words, since it’s not possible to be 100% certain that each related instrument moves to a given level when the underlying instrument does, we can’t provide levels that would be binding. The levels that we do provide are our best estimate of the levels that will correspond to the levels in the underlying assets, but it will be the underlying assets that one will need to focus on regarding the signs pointing to closing a given position or keeping it open. We might adjust the levels in the “additional instruments” without adjusting the levels in the “main instruments”, which will simply mean that we have improved our estimation of these levels, not that we changed our outlook on the markets. We are already working on a tool that would update these levels on a daily basis for the most popular ETFs, ETNs and individual mining stocks.
Our preferred ways to invest in and to trade gold along with the reasoning can be found in the how to buy gold section. Additionally, our preferred ETFs and ETNs can be found in our Gold & Silver ETF Ranking.
As a reminder, Gold & Silver Trading Alerts are posted before or on each trading day (we usually post them before the opening bell, but we don't promise doing that each day). If there's anything urgent, we will send you an additional small alert before posting the main one.
=====
Latest Free Trading Alerts:
Currency market participants look cautious before tomorrow’s big day of the Fed pronouncements. Looks reasonable but even guarded moves can give telling signs. Of where the action is now and where it’s likely to go next, to paraphrase one famous Canadian ice hockey player. Remember, one doesn’t have to shout in order to be heard. Also, we still keep an eye on the candidate for opening new positions. Emerging throughout the currencies arena, here are the clues to share.
Calm and Boredom Before The Storm Tomorrow? Not in the Least!
=====
Thank you.
Sincerely,
Przemyslaw Radomski, CFA
Editor-in-chief, Gold & Silver Fund Manager

