

Briefly: in our opinion, full (300% of the regular position size) speculative short positions in mining stocks are justified from the risk/reward point of view at the moment of publishing this Alert.
Yesterday’s session was relatively inconsequential, so I’ll keep today’s technical comments relatively short.

Figure 1 – COMEX Gold Futures
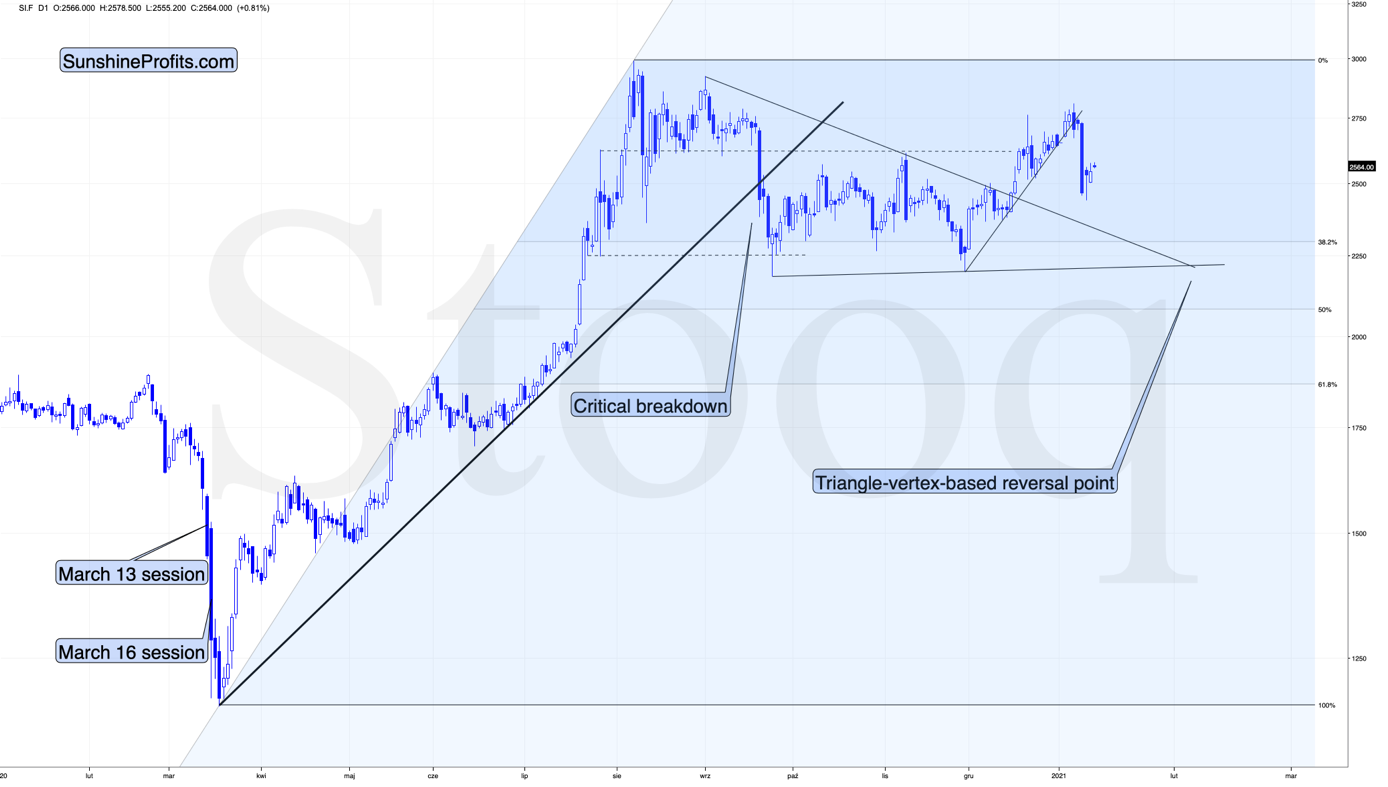
Figure 2 – COMEX Silver Futures
In short, the breather in gold and silver continues. This is natural and normal, given the size of the slide that we saw recently. The decline is likely to resume shortly.
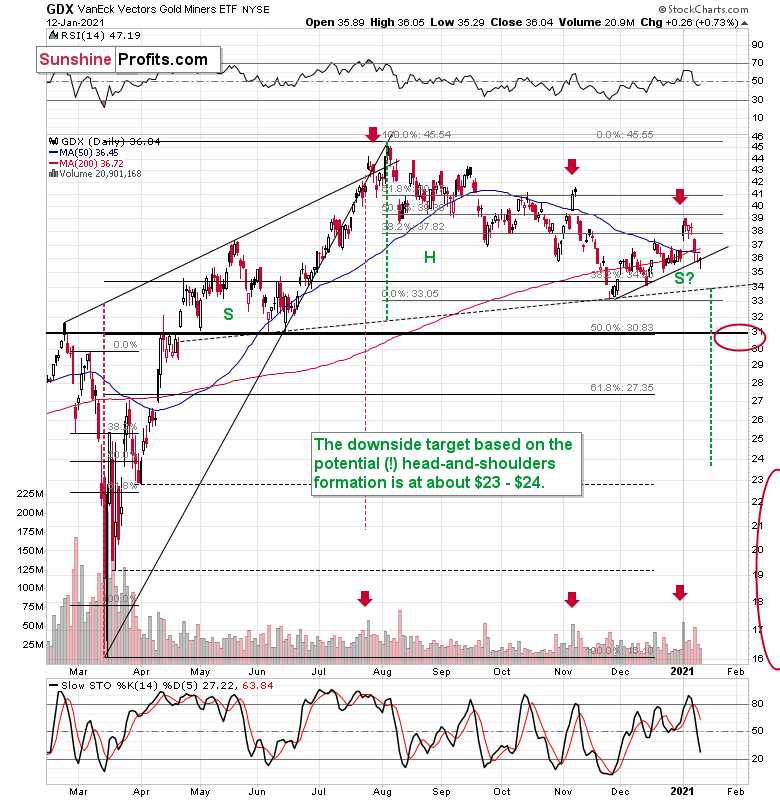
Figure 3 - VanEck Vectors Gold Miners ETF (GDX)
Mining stocks moved slightly higher yesterday (Jan. 12), which is also normal in the current situation. GDX’s performance is similar to what we saw in mid-November, when miners moved slightly higher for two days, only to decline even more shortly thereafter.
Miners formed a reversal in terms of prices, but they did so on volume that was relatively low, which means (as I explained yesterday) that it was actually just a breather, and not a major bullish development.
Consequently, my previous comments on the above chart remain up-to-date:
The sell signal from the stochastic indicator remains in place, and so does the sell signal coming from the volume spike in the first session of the year (analogy to July and November tops).
Please note that, based on the analogy to the November top, a small, two-day corrective upswing, would be quite normal here. It wouldn’t change the bearish outlook at all.
In addition, the GDX is on the cusp of forming a head and shoulders pattern. If you analyze the chart above, the area on the left (marked S) represents the first shoulder, while the area in the middle (H) represents the head and the area on the right (second S) represents the potential second shoulder.
Right now, $33.7-$34 is the do-or-die area. If the GDX breaks below this (where the right shoulder forms) it could trigger a decline back to the $24 to $23 range (measured by the spread between the head and the neckline; marked with green).
Since there’s a significant support at about $31 in the form of the 50% retracement based on the 2020 rally, and the February 2020 high, it seems that we might see the miners pause there. In fact, it wouldn’t be surprising to see a pullback from these levels to about $33, which could serve as the verification of the completion of the head-and-shoulder pattern. This might take place at the same time, when gold corrects the decline to $1,700, but it’s too early to say with certainty.
Also, let’s not forget that the GDX ETF has recently invalidated the breakout above the 61.8% Fibonacci retracement based on the 2011 – 2016 decline.
On top of that we have a classic post-breakout action in the USD Index.
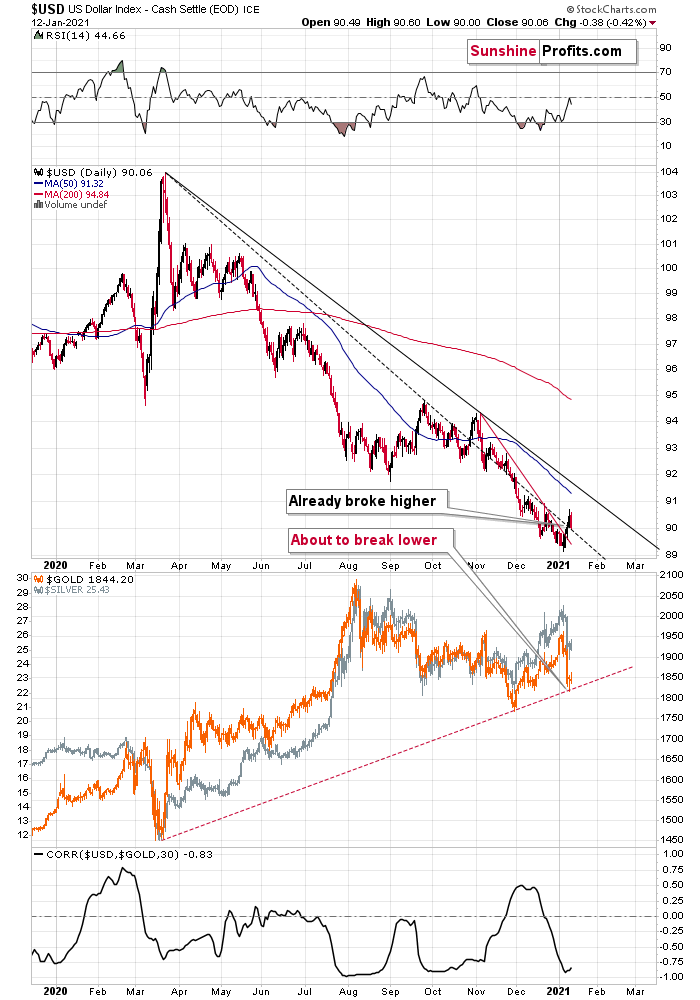
Figure 4 - USD Index, USD, GOLD and CORR Comparison
In yesterday’s (Jan. 12) analysis, I described the above chart in the following way:
After confirming the breakout above the very short-term declining resistance line, the USD Index has now broken above the declining dashed line that’s based on the March 2020 and September 2020 tops.
With the correlation between the USD index and gold (bottom part of the chart) being strongly negative, the USD’s breakouts are bullish for gold. Namely, they tell us that after a breather, the USD Index is likely to continue its rally, while precious metals are likely to fall.
The next big move in the PMs is likely to take place once gold breaks below its rising support line, and that’s likely to happen relatively soon. Moreover, please note that the existence of the support line is – by itself – a reason for gold to correct before sliding. This makes the theory of yesterday’s (Jan. 11) reversal not being a true reversal even more valid.
All in all, it seems that the precious metals sector is about to decline once again, if not immediately, then shortly.
The breakout above the declining dashed line based on the March 2020 and September 2020 tops is now being verified. In other words, the USD Index moved back to this line without breaking below it. Once the USDX rallies once again, this breakout will be verified, and another short-term rally will be very likely to start.
The above is likely to mark the end of the pause in the precious metals’ and miners’ decline.
Before summarizing, let’s take a more fundamental look at precious metals price drivers: currencies, yields, and stocks.
As you can see in our Correlation Matrix, the 30-trading-day correlation values are strongly negative in the case of all key parts of the precious metals market (gold, silver, senior miners, junior miners) and the USD Index, while they remain generally positive in case of the link with the stock market. Both links are most visible when we take the 250 trading days into account (effectively about 1 year).
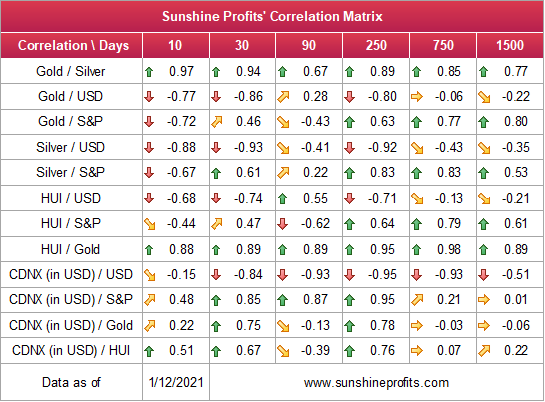
Figure 5
The closer to -1 the number gets, the more negatively correlated given assets are, and the closer to 1 it gets, the stronger the positive correlation. Numbers close to zero imply no correlation.
So, what do these markets tell us about future movements in the price of gold?
Future History
Yesterday, I highlighted the record excess that’s building up across U.S. equities. And as we approach the middle of January, investors are giving new meaning to Paul Engemann’s Push It to the Limit.
Last week, the S&P 500’s option Gamma (21-day moving average) reached the top 0.37% of all-time readings. And on Monday (Jan. 11), the 10-day MA set a new record.
Please see the chart below:
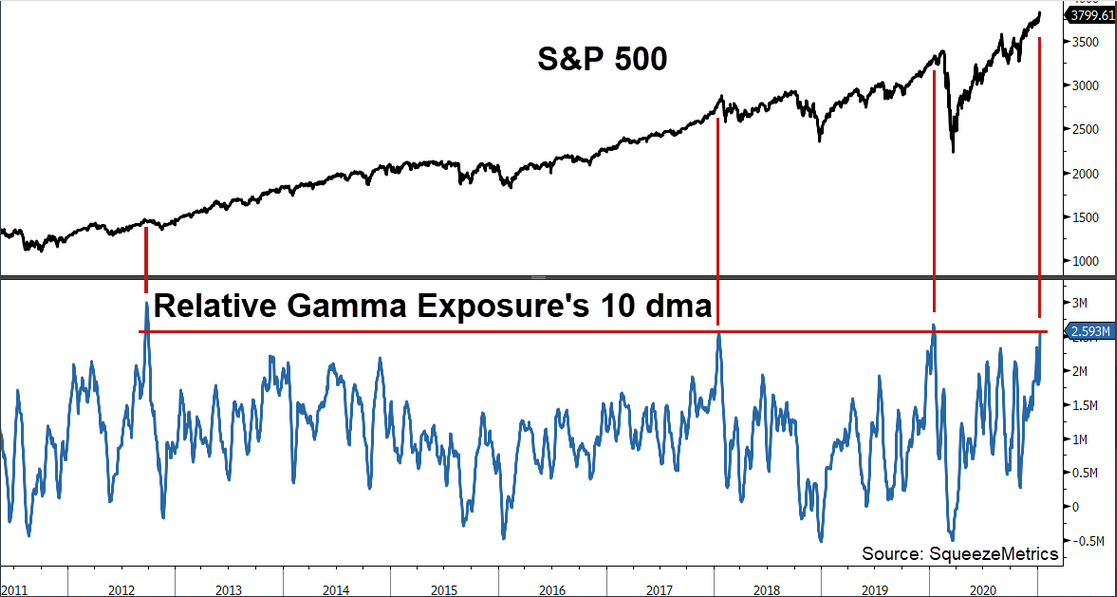
Figure 6
Keep in mind, Monday’s record was set on an absolute basis (by analyzing the number of outstanding options contracts). However, relative to the S&P 500’s market cap (which biases the reading lower as stocks move higher), it’s the fourth-highest since 2011. More importantly though, the last three times Gamma exposure reached the current level, the S&P 500 fell by 7.9%, 7.3% and 31.0% over the following two months (the vertical red lines above).
From a valuation perspective, the derivatives frenzy has also helped push the NASDAQ (4.17x), S&P 500 (2.85x) and Russell 2000’s (1.49x) price-to-sales (P/S) ratios to their highest levels ever.
Please see below:
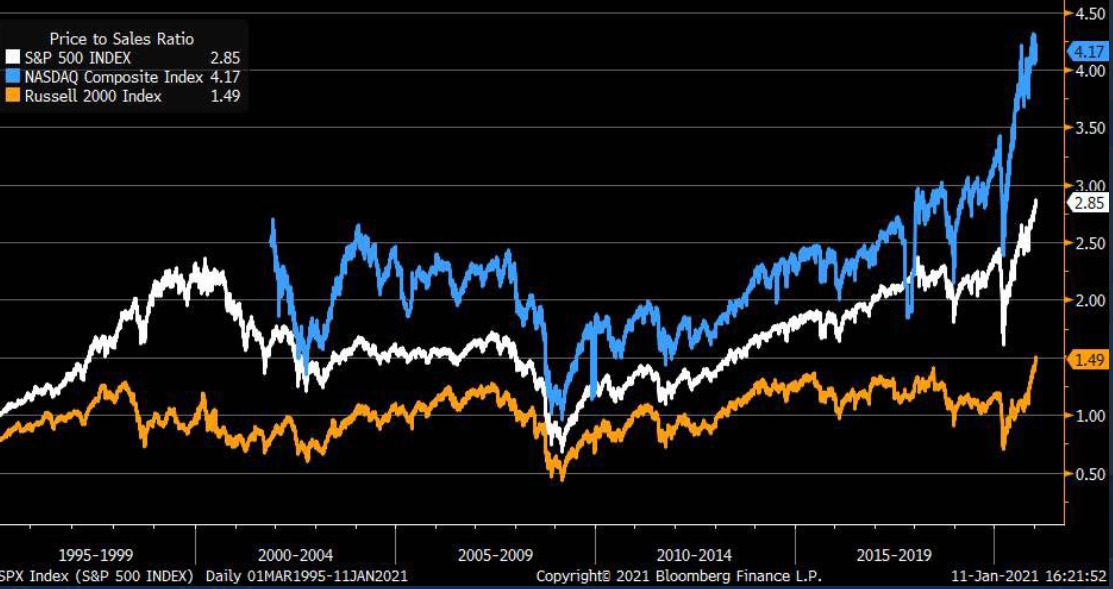
Figure 7 – (Source: Bloomberg/ Liz Ann Sonders)
And a day after the milestones were set, U.S. small business confidence (the NFIB Small Business Optimism Index) fell to a seven-month low (Jan. 12).
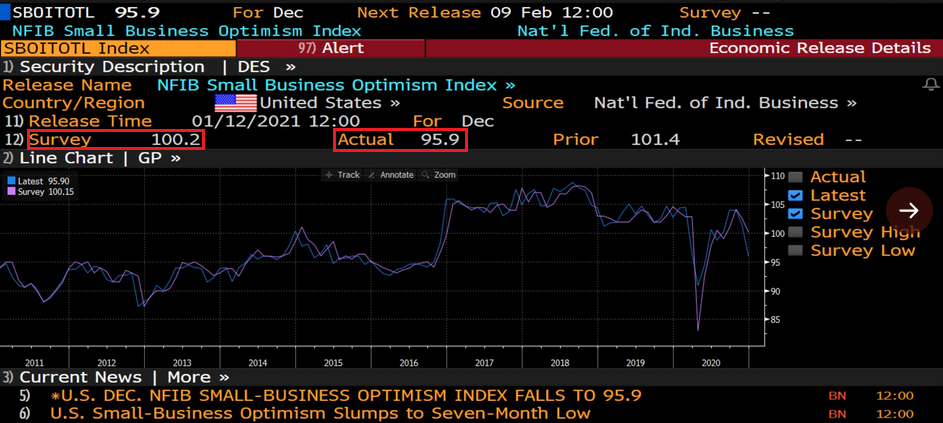
Figure 8 - (Source: Bloomberg/Daniel Lacalle)
In addition, while economists expected a print of 100.2 (the red box on the left), the reading came in at 95.9 (the red box on the right), more than two points below the index’s historical average. Furthermore, nine out of 10 survey categories indicated that economic conditions are worse than they were in November.
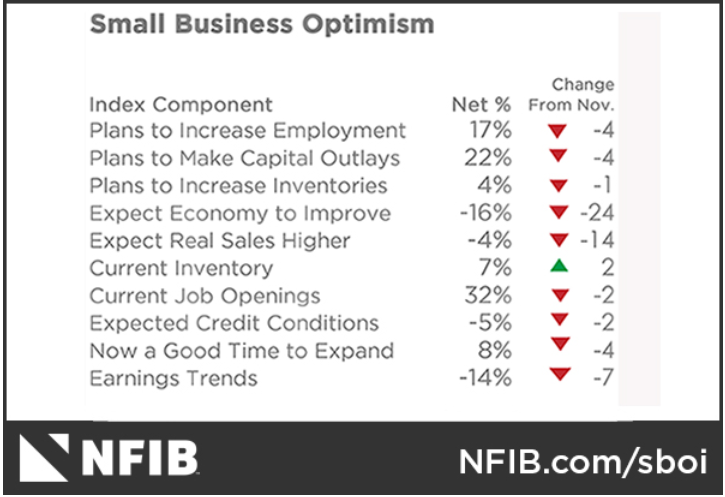
Figure 9
As another wonder to marvel at, U.S. Treasury yields are also surging (which I’ve mentioned during previous editions). And because corporate profits are still on life support (due to the lack of real economic activity), the spread between the S&P 500’s earnings yield and the U.S. 10-Year Treasury yield just hit its lowest level in over two years.
Please see below:
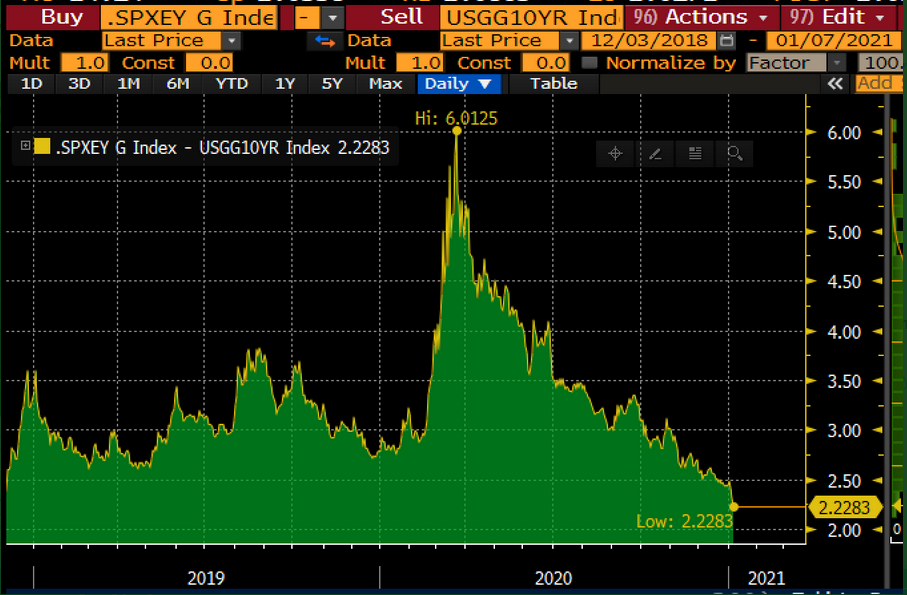
Figure 10 – (Source: Bloomberg/ Lisa Abramowicz
To explain, the earnings yield is the inverse of the S&P 500’s price-to-earnings (P/E) ratio (calculated as earnings divided by price). The percentage is often compared to the yield on the U.S. 10-Year Treasury to gauge the relative value of stocks versus bonds. If you look at the middle of the chart, you can see that the spread between the two peaked at more than 6% in 2019 (as companies’ EPS rose and bond yields fell). However, with the opposite occurring today, the spread between the two has fallen below 2.23%.
Thus, with bond yields beginning to breathe new life, Jerome Powell’s (Chairman of the U.S. Federal Reserve) argument that P/E multiples are “not as relevant” in a world of low interest rates is starting to lose its luster.
EUR/USD Struggles with Reality
Despite bouncing yesterday (as declines rarely happen linearly), the EUR/USD is still treading fundamental water.
Over the last few weeks, I’ve been highlighting the increased economic divergence – as a weak U.S. economy is overshadowed only by an even-weaker Eurozone economy (Remember, currencies trade on a relative basis.)
And as another data point of validation, yesterday, Bloomberg Economics reduced its first-quarter GDP forecast (for Europe) from a rise of 1.3% to a decline of 4.0%. Furthermore, the team also reduced their full-year GDP growth forecast from 4.8% to 2.9%.
Please see below:
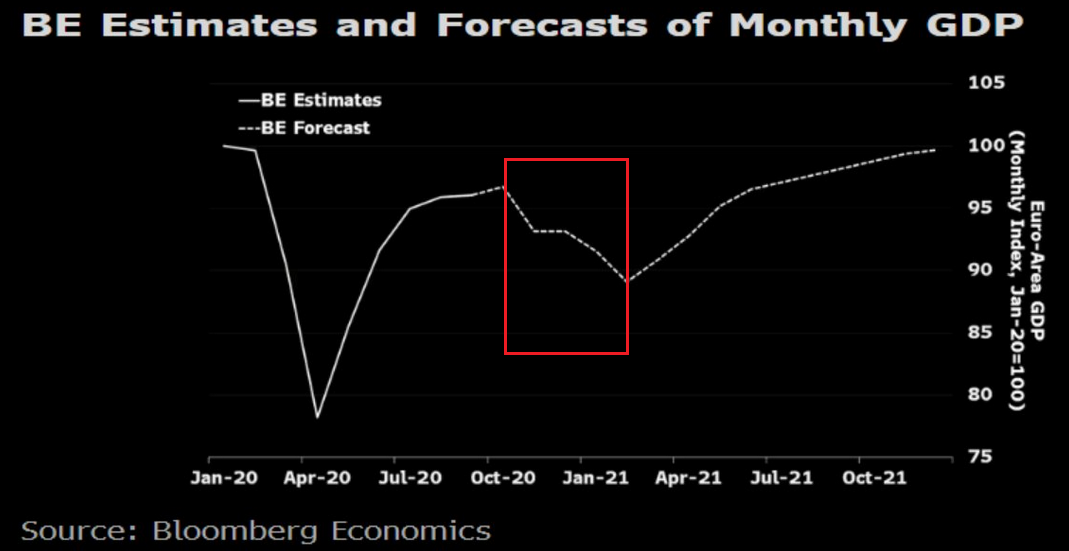
Figure 11
If you analyze the red box, you can see the massive drop in economic activity that’s expected during the first three months of 2021. And even more pessimistic, Peter Vanden Houte, ING’s Chief Economist wrote (on Jan. 7) that he believes “it will take until the summer of 2023 for the Eurozone to regain its pre-crisis activity level.”
Also plaguing Europe, please have a look at the sharp decline in the Eurozone household savings rate:
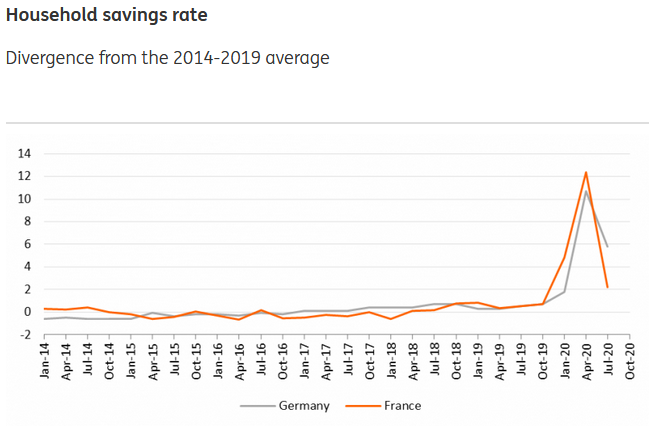
Figure 12 – (Source: Refinitiv/ING)
To explain, the huge spike in 2020 was a function of government programs to replace lost wages at the onset of the pandemic. However, as the crisis unfolded and the level of government spending became unsustainable, the household savings rate in Germany and France (Europe’s two largest economies) sunk like a stone.
Moreover, with Eurozone retail sales plunging by 6.1% in November, and assuming the household savings rate followed suit, you can infer that households are allocating resources to necessities and not discretionary items that boost GDP.
The bottom line?
The European economy is underperforming the U.S. economy and the deluge of bad data is slowly chipping away at the euro. And as the fundamental damage continues, the EUR/USD should come under pressure and help propel the USD Index higher.
As part of the fallout, gold will likely drop below its rising support line and then decline further. Once it bottoms, we’ll have a very attractive entry point to go long in the precious metals and mining stocks.
Overview of the Upcoming Decline
- As far as the current overview of the upcoming decline is concerned, I think it has already begun.
- During the final part of the slide (which could end within the next 1-12 weeks or so), I expect silver to decline more than miners. That would align with how the markets initially reacted to the COVID-19 threat.
- The impact of all the new rounds of money printing in the U.S. and Europe on the precious metals prices is incredibly positive in the long run, which does not make the short-term decline improbable. Markets can and will get ahead of themselves and decline afterward – sometimes very profoundly – before continuing with their upward climb.
- The plan is to exit the current short positions in miners after they decline far and fast, but at the same time, silver drops just “significantly” (we expect this to happen in 0 – 5 weeks ). In other words, the decline in silver should be severe, but the decline in the miners should look “ridiculous”. That’s what we did in March when we bought practically right at the bottom . It is a soft, but simultaneously broad instruction, so additional confirmations are necessary.
- As a point of reference, given that the inverse pattern above mirrors today’s price action, the duration of the precious metals’ decline could last longer than my initial forecast. Keep in mind though, a prolonged bear market is not my base case; I’m merely indicating that the possibility exists.
- The final bottom in gold could form close to $1,500, after a temporary rebound from about $1,700. The $1,700 is likely to correspond to a move to about $31 in the GDX ETF. We will likely exit the short positions at that time, and we might even open quick long positions. During the next move lower silver might decline more than gold and miners, so we might focus on shorting that market at that time.
- The precious metals market's final bottom is likely to take shape when gold shows significant strength relative to the USD Index . It could take the form of a gold’s rally or a bullish reversal, despite the ongoing USD Index rally.
Summary
Summing up, the outlook for gold and the rest of the precious metals market is bearish for at least the next few weeks. After topping at its triangle-vertex-based reversal, gold moved sharply lower and it just invalidated the breakout above its declining resistance line, while breaking below the rising support line. All this happened as the USD Index rallied visibly above its declining resistance lines and invalidated the breakdown below the 2020 lows. This creates a strongly bearish combination for the precious metals market.
The USD Index and cryptocurrencies suggest that we’re seeing the repeat of early 2018, when the USD Index bottomed. Given the current correlations between PMs and the USD Index, the rally in the USDX is likely to have very bearish implications for the precious metals market.
Despite a recent decline, it seems that the USD Index is going to move higher in the following months and weeks, in turn causing gold to decline. At some point gold is likely to stop responding to dollar’s bearish indications, and based on the above analysis, it seems that this is already taking place.
Naturally, everyone's trading is their responsibility. But in our opinion, if there ever was a time to either enter a short position in the miners or increase its size if it was not already sizable, it's now. We made money on the March decline, and on the March rebound, with another massive slide already underway.
After the sell-off (that takes gold to about $1,500), we expect the precious metals to rally significantly. The final part of the decline might take as little as 1-5 weeks, so it's important to stay alert to any changes.
Most importantly, please stay healthy and safe. We made a lot of money on the March decline and the subsequent rebound (its initial part) price moves (and we'll likely earn much more in the following weeks and months), but you have to be healthy to enjoy the results.
As always, we'll keep you - our subscribers - informed.
To summarize:
Trading capital (supplementary part of the portfolio; our opinion): Full speculative short positions (300% of the full position) in mining stocks is justified from the risk to reward point of view with the following binding exit profit-take price levels:
Senior mining stocks (price levels for the GDX ETF): binding profit-take exit price: $32.02; stop-loss: none (the volatility is too big to justify a SL order in case of this particular trade); binding profit-take level for the DUST ETF: $28.73; stop-loss for the DUST ETF: none (the volatility is too big to justify a SL order in case of this particular trade)
Junior mining stocks (price levels for the GDXJ ETF): binding profit-take exit price: $42.72; stop-loss: none (the volatility is too big to justify a SL order in case of this particular trade); binding profit-take level for the JDST ETF: $21.22; stop-loss for the JDST ETF: none (the volatility is too big to justify a SL order in case of this particular trade)
For-your-information targets (our opinion; we continue to think that mining stocks are the preferred way of taking advantage of the upcoming price move, but if for whatever reason one wants / has to use silver or gold for this trade, we are providing the details anyway. In our view, silver has greater potential than gold does):
Silver futures downside profit-take exit price: unclear at this time - initially, it might be a good idea to exit, when gold moves to $1,703.
Gold futures downside profit-take exit price: $1,703
Long-term capital (core part of the portfolio; our opinion): No positions (in other words: cash
Insurance capital (core part of the portfolio; our opinion): Full position
Whether you already subscribed or not, we encourage you to find out how to make the most of our alerts and read our replies to the most common alert-and-gold-trading-related-questions.
Please note that we describe the situation for the day that the alert is posted in the trading section. In other words, if we are writing about a speculative position, it means that it is up-to-date on the day it was posted. We are also featuring the initial target prices to decide whether keeping a position on a given day is in tune with your approach (some moves are too small for medium-term traders, and some might appear too big for day-traders).
Additionally, you might want to read why our stop-loss orders are usually relatively far from the current price.
Please note that a full position doesn't mean using all of the capital for a given trade. You will find details on our thoughts on gold portfolio structuring in the Key Insights section on our website.
As a reminder - "initial target price" means exactly that - an "initial" one. It's not a price level at which we suggest closing positions. If this becomes the case (like it did in the previous trade), we will refer to these levels as levels of exit orders (exactly as we've done previously). Stop-loss levels, however, are naturally not "initial", but something that, in our opinion, might be entered as an order.
Since it is impossible to synchronize target prices and stop-loss levels for all the ETFs and ETNs with the main markets that we provide these levels for (gold, silver and mining stocks - the GDX ETF), the stop-loss levels and target prices for other ETNs and ETF (among other: UGL, GLL, AGQ, ZSL, NUGT, DUST, JNUG, JDST) are provided as supplementary, and not as "final". This means that if a stop-loss or a target level is reached for any of the "additional instruments" (GLL for instance), but not for the "main instrument" (gold in this case), we will view positions in both gold and GLL as still open and the stop-loss for GLL would have to be moved lower. On the other hand, if gold moves to a stop-loss level but GLL doesn't, then we will view both positions (in gold and GLL) as closed. In other words, since it's not possible to be 100% certain that each related instrument moves to a given level when the underlying instrument does, we can't provide levels that would be binding. The levels that we do provide are our best estimate of the levels that will correspond to the levels in the underlying assets, but it will be the underlying assets that one will need to focus on regarding the signs pointing to closing a given position or keeping it open. We might adjust the levels in the "additional instruments" without adjusting the levels in the "main instruments", which will simply mean that we have improved our estimation of these levels, not that we changed our outlook on the markets. We are already working on a tool that would update these levels daily for the most popular ETFs, ETNs and individual mining stocks.
Our preferred ways to invest in and to trade gold along with the reasoning can be found in the how to buy gold section. Furthermore, our preferred ETFs and ETNs can be found in our Gold & Silver ETF Ranking.
As a reminder, Gold & Silver Trading Alerts are posted before or on each trading day (we usually post them before the opening bell, but we don't promise doing that each day). If there's anything urgent, we will send you an additional small alert before posting the main one.
Thank you.
Przemyslaw Radomski, CFA
Founder, Editor-in-chief

