

Briefly: In our opinion, short (full) speculative positions in gold, silver and mining stocks are justified from the risk/reward point of view.
Gold plunged below the previous lows yesterday and the breakdown was clear and big. The extreme decline in mining stocks was even bigger. Miners continued to underperform and the XAU Index is relatively close to its… 2000 low. 2 weeks ago we wrote that the situation was exactly what we [had seen] in April 2013 right before the major breakdown in gold and silver and the subsequent plunge in the entire precious metals sector. Is the plunge really just starting and will our profits from shorting move from huge to enormous?
Let’s take a closer look (charts courtesy of http://stockcharts.com).

Today we’re going to focus on the long-term chart, as that’s where we can see the most important developments and targets. Gold broke well below the previous lows and the similarity between now and 2013 is still significant.
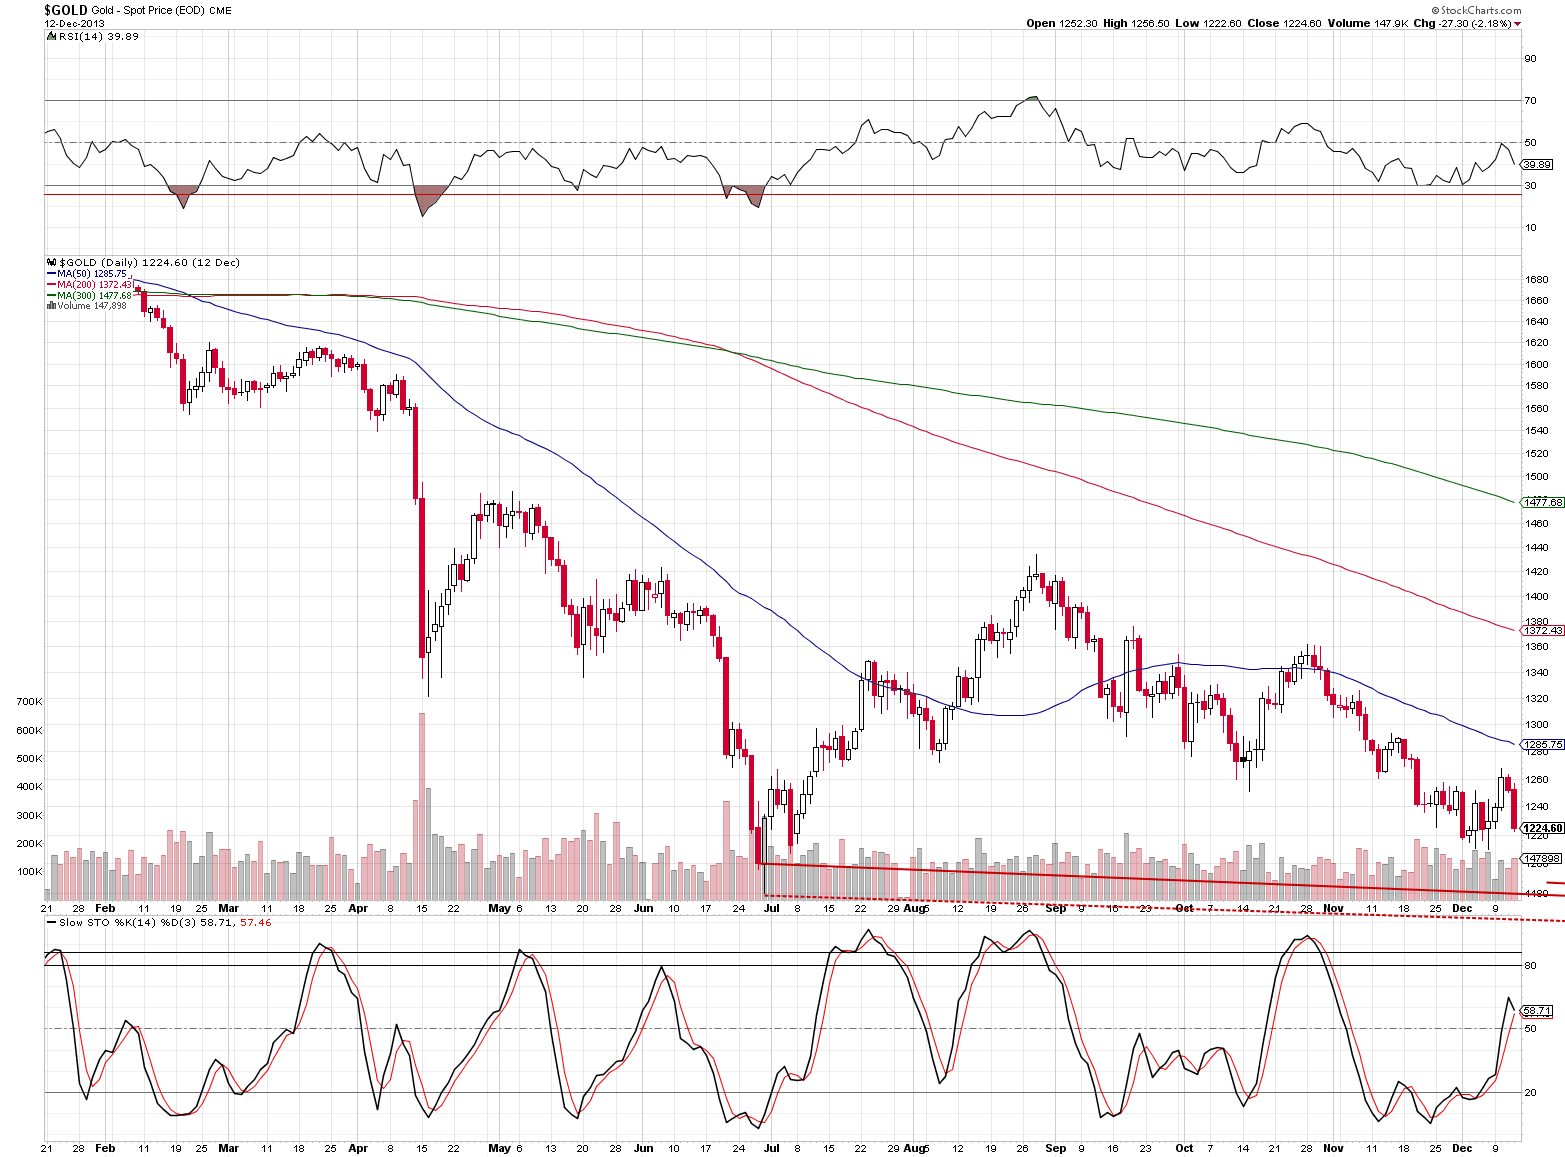
Both declines started rather insignificantly – there were a few local tops in late 2012 and gold has been trading back and forth in the past few months as well (after forming a local top in the winter). Each local top in both cases was lower than the previous one. The final top before the plunge was relatively close to the declining dashed resistance line. In both cases the plunge was below the major horizontal support and in both cases many analysts and investors believed that these levels would not be broken (how many times did you recently read that the bottom for the precious metals sector had been formed in November 2014?). In both cases miners were significantly underperforming and they broke below the key support levels much sooner than gold did.
Now, history rhymes, so it’s quite likely that what we’ll see next will be similar to what we saw after the initial plunge in 2013.
Back in 2013 gold plunged initially, corrected somewhat and continued the decline to form the true bottom later that year. That seems to be the likely outlook also this time (which is in tune with what we have been writing for many weeks – we featured 2 targets for gold and one could be the first bottom and the second would be the final low, later this year).
Here’s the game plan. Since we will probably not see enough confirmations that the final bottom for this decline is in, we will likely not write about getting back into the precious metals market with the long-term investment capital. Again, that’s what will likely take place, but there are no guarantees – we will re-evaluate the situation each day and let you know if anything changes regarding the above.
However, the corrective upswing is likely to be big enough to make it worth trading (in our opinion). Taking profits off the table seems to be a good idea if the precious metals sector is likely to correct relatively soon – and that seems to be the case. Why? Before we discuss the technical details, let’s keep in mind that gold is now making headlines in a big way and the titles are bearish. Many journalists are writing about gold’s demise. That’s a bullish sign, as it means that those who were considering selling gold are likely doing so now or have already done so.
Moving back to the technical part of the discussion, will gold decline as significantly in the near terms as it did in 2013? Not necessarily. Let’s get back to the long-term chart. We’re pasting it also below for your convenience.
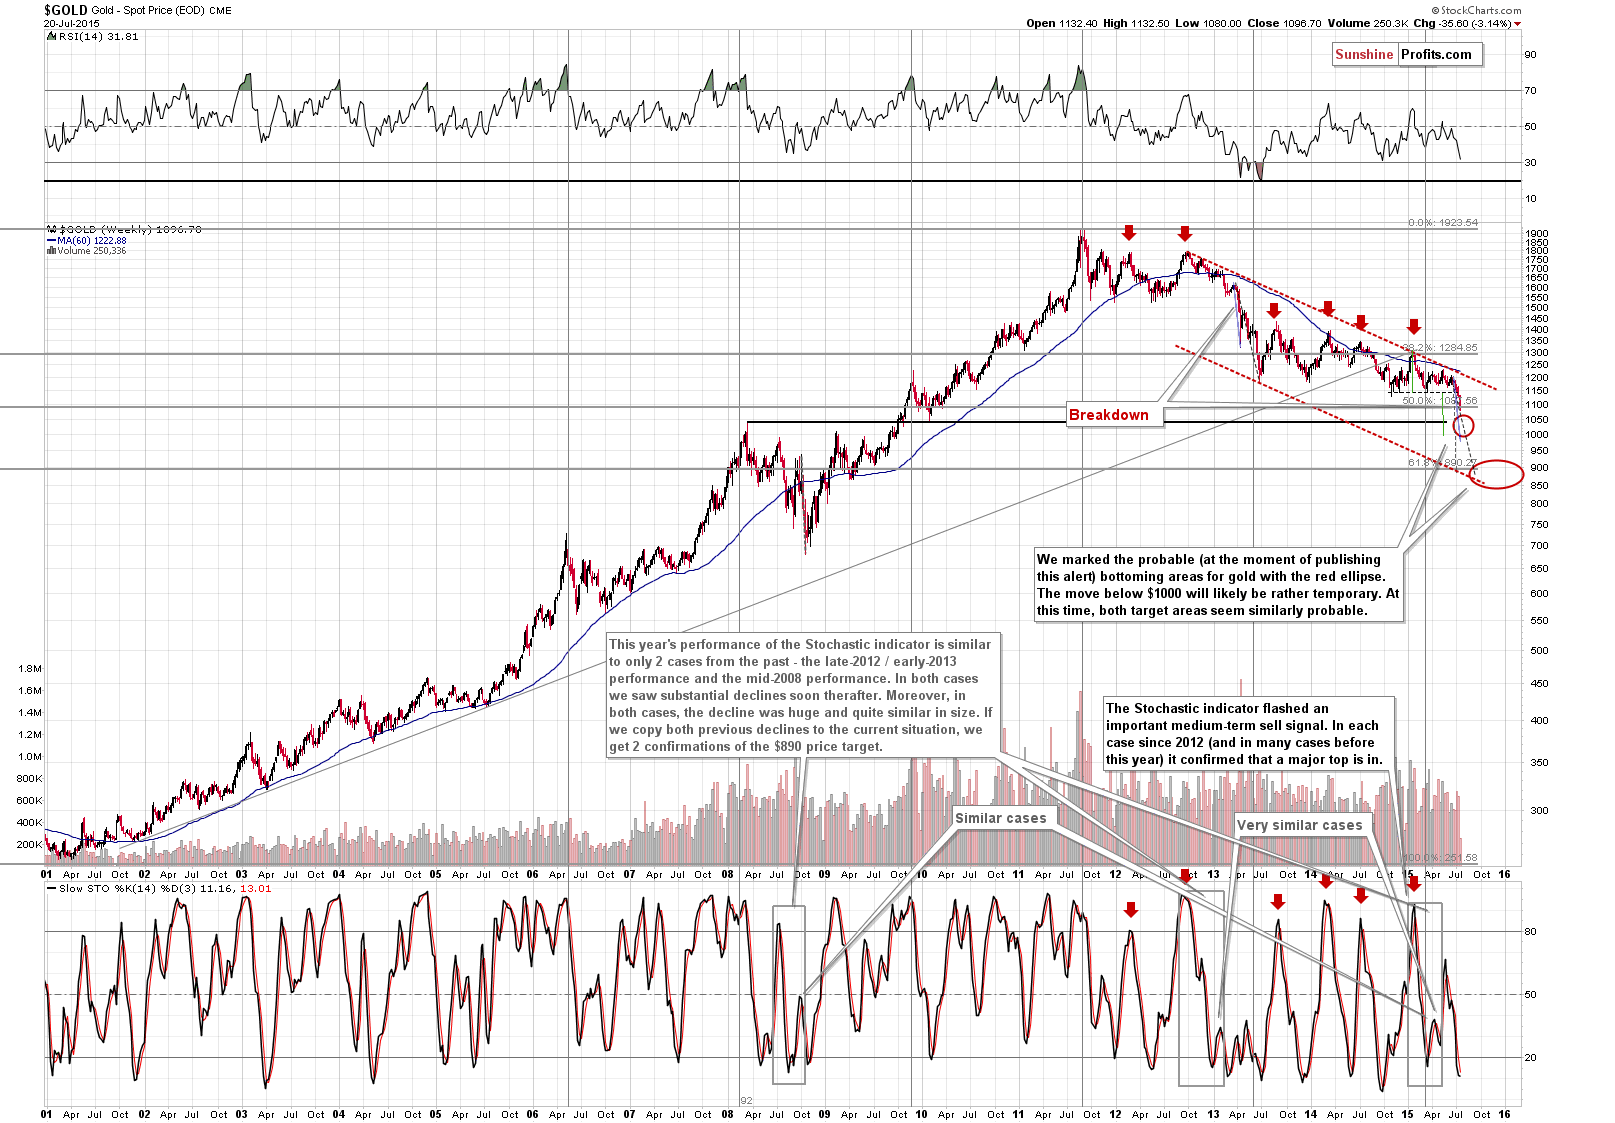
Back in 2013 gold declined almost to the closest previous significant bottom – the 2011 bottom. It could’ve been the case (and it’s likely that it was indeed the case) that gold declined that low temporarily because it didn’t have a strong support level that was higher. The size of the following correction and its sharpness clearly show that gold moved too low too soon.
Therefore, the question is, what is the strong support for gold that is relatively close to where gold is now. It’s the thick, horizontal black line. It covers the 2010 bottom and the 2008 top, which makes it very significant. The 2010 bottom was a bit higher - $1,044.50. That’s the upper part of our initial target area for gold. Can gold move lower in the short term? Naturally, but the decline below the mentioned level seems less probable than a move to it. Consequently, it is only up to this level that the risk/reward ratio will favor keeping short positions opened.
Having said that, let’s take a look at the other charts.
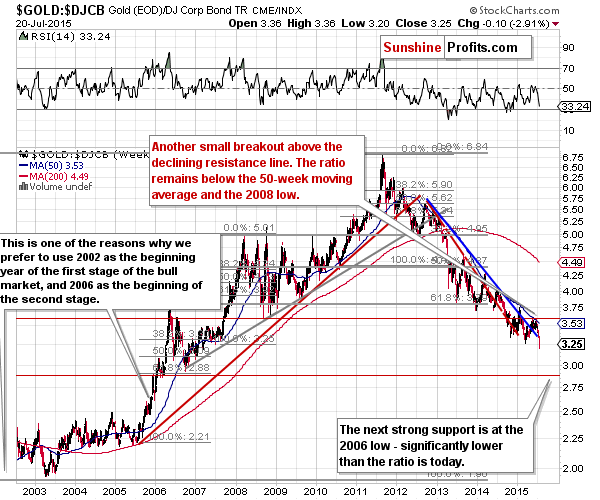
The gold to bonds ratio shows that the next strong support is visibly below yesterday’s low, which is a sign that says that the final bottom is not at hand just yet.
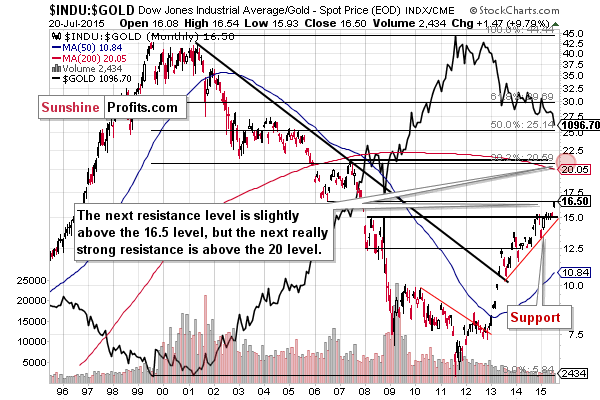
The Dow to gold ratio, however, shows that gold is likely at or very close to at least a local bottom (since the ratio encountered significant resistance – the 2006 low).
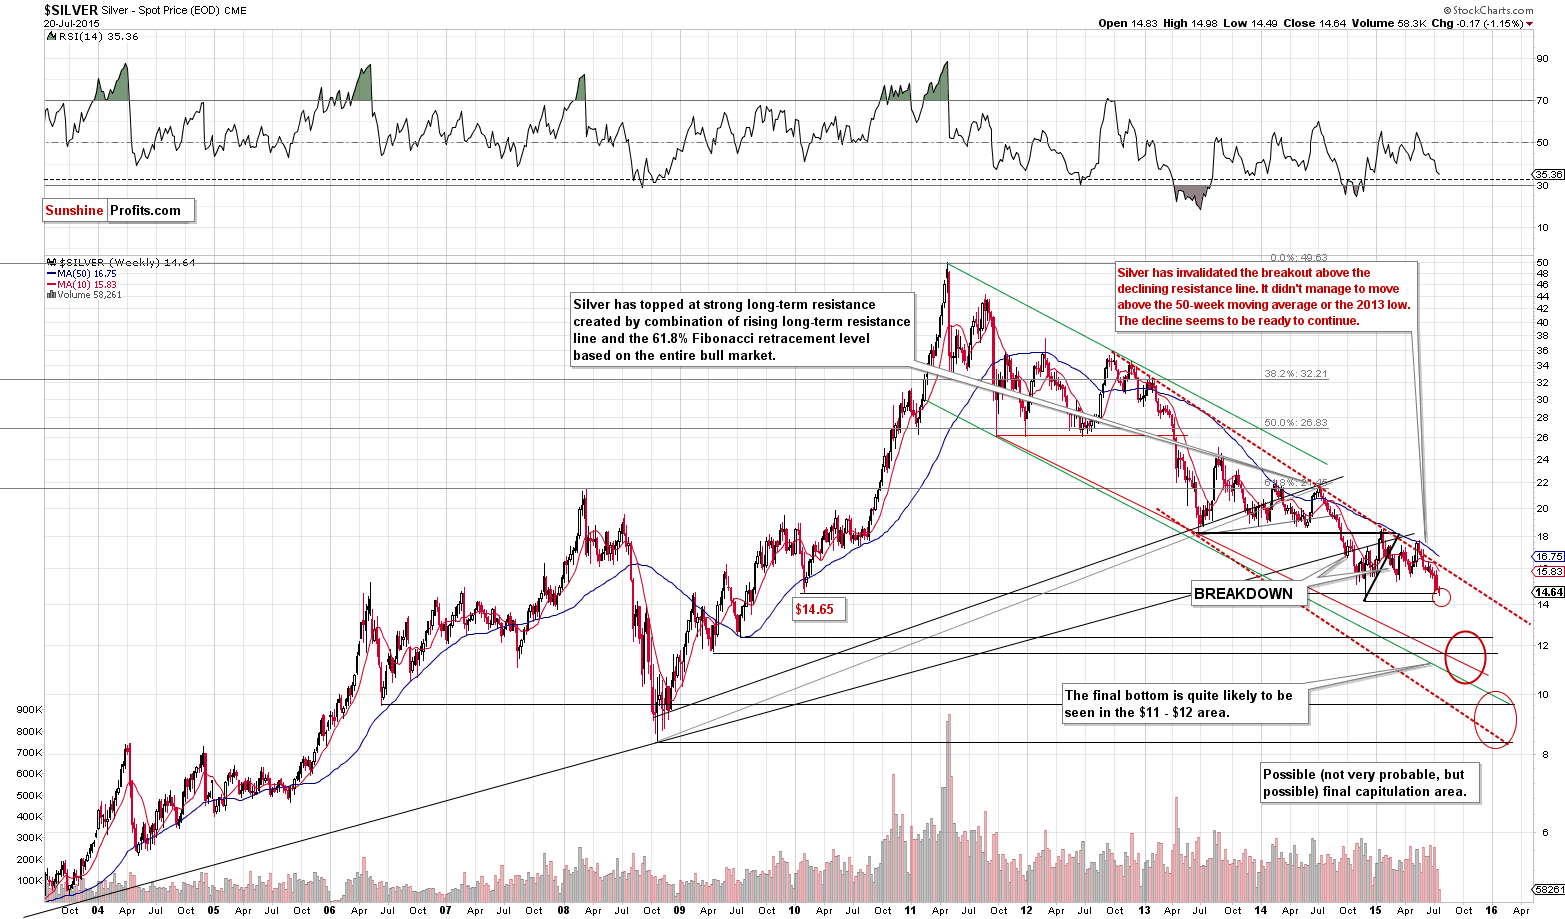
Silver is within our interim target area and it seems that it could decline to the 2014 low before correcting.
Our previous comments on the above chart remain up-to-date:
The decline continues as expected. Will silver form a local bottom soon? It could be the case and it’s moderately likely. Will it be the final bottom? We view it as unlikely. The points that we made when we discussed the price targets for silver remain up-to-date, so if you didn’t read this discussion, we encourage you to read it today.
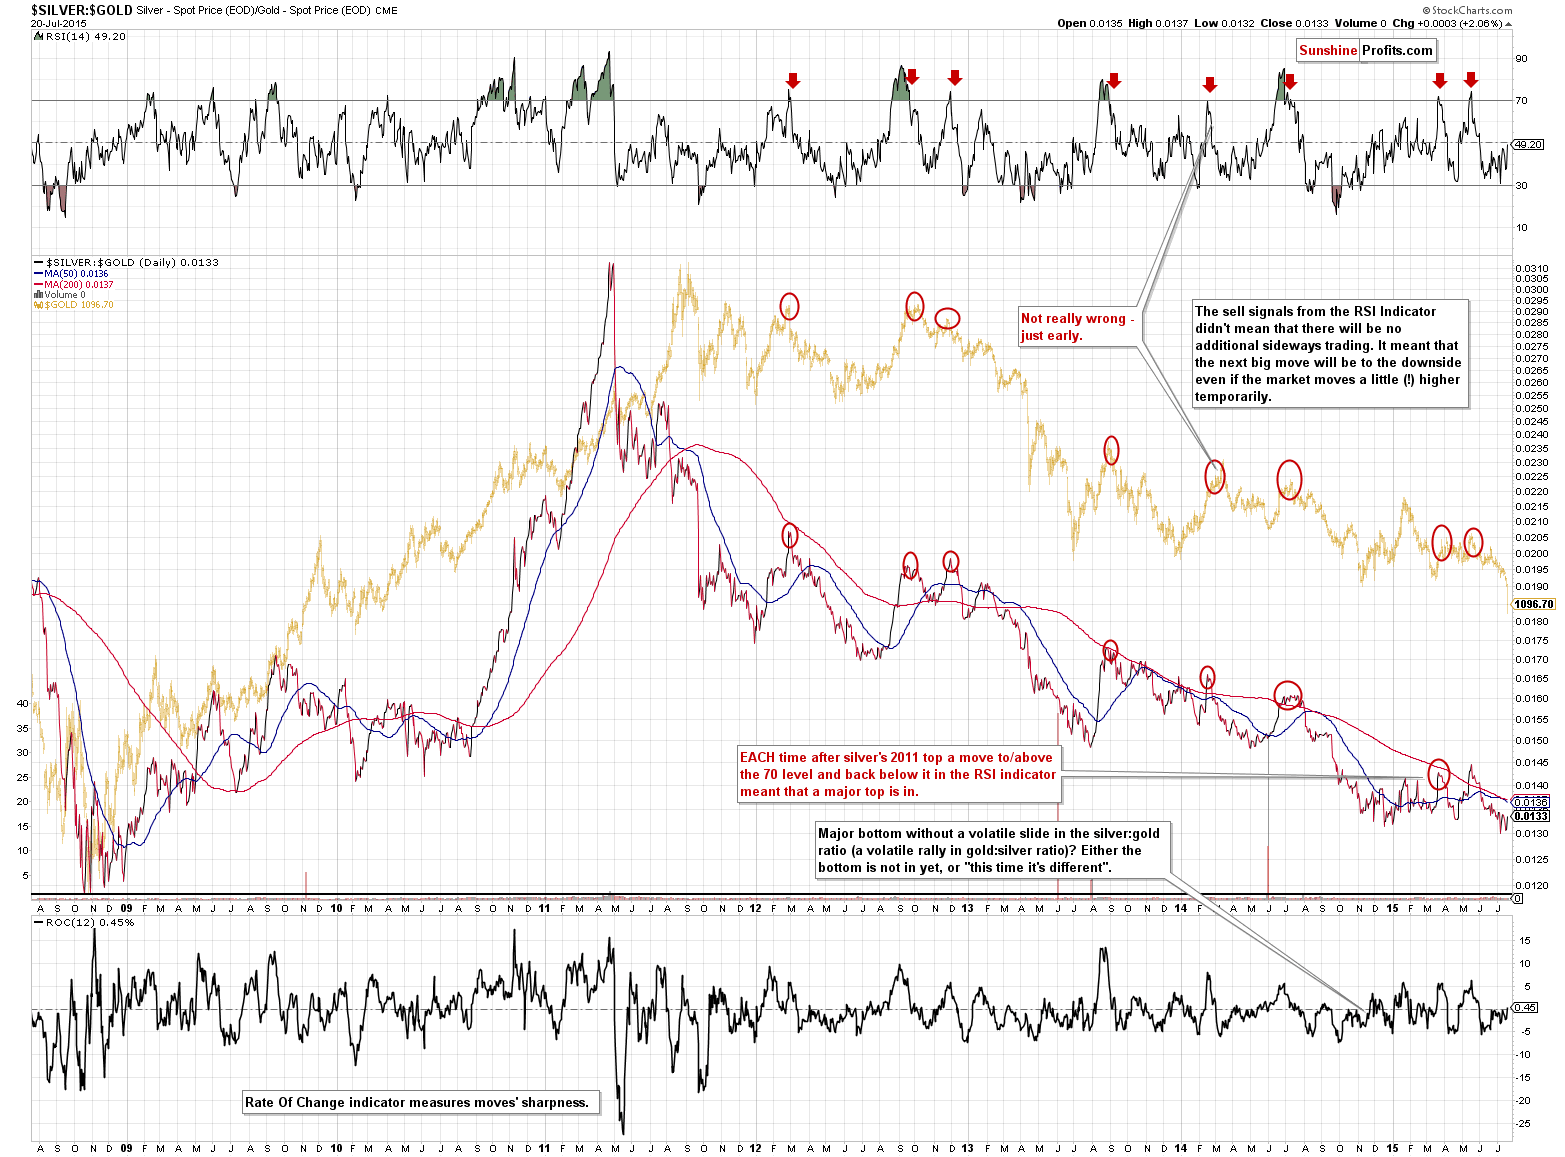
The lack of silver’s sharp underperformance is one of the reasons for which we think that the final bottom is not yet in or close to being in. Please note that previous major bottoms in the precious metals sector were accompanied by sharp underperformance of the white metal. We have yet to see this kind of development during the current decline.
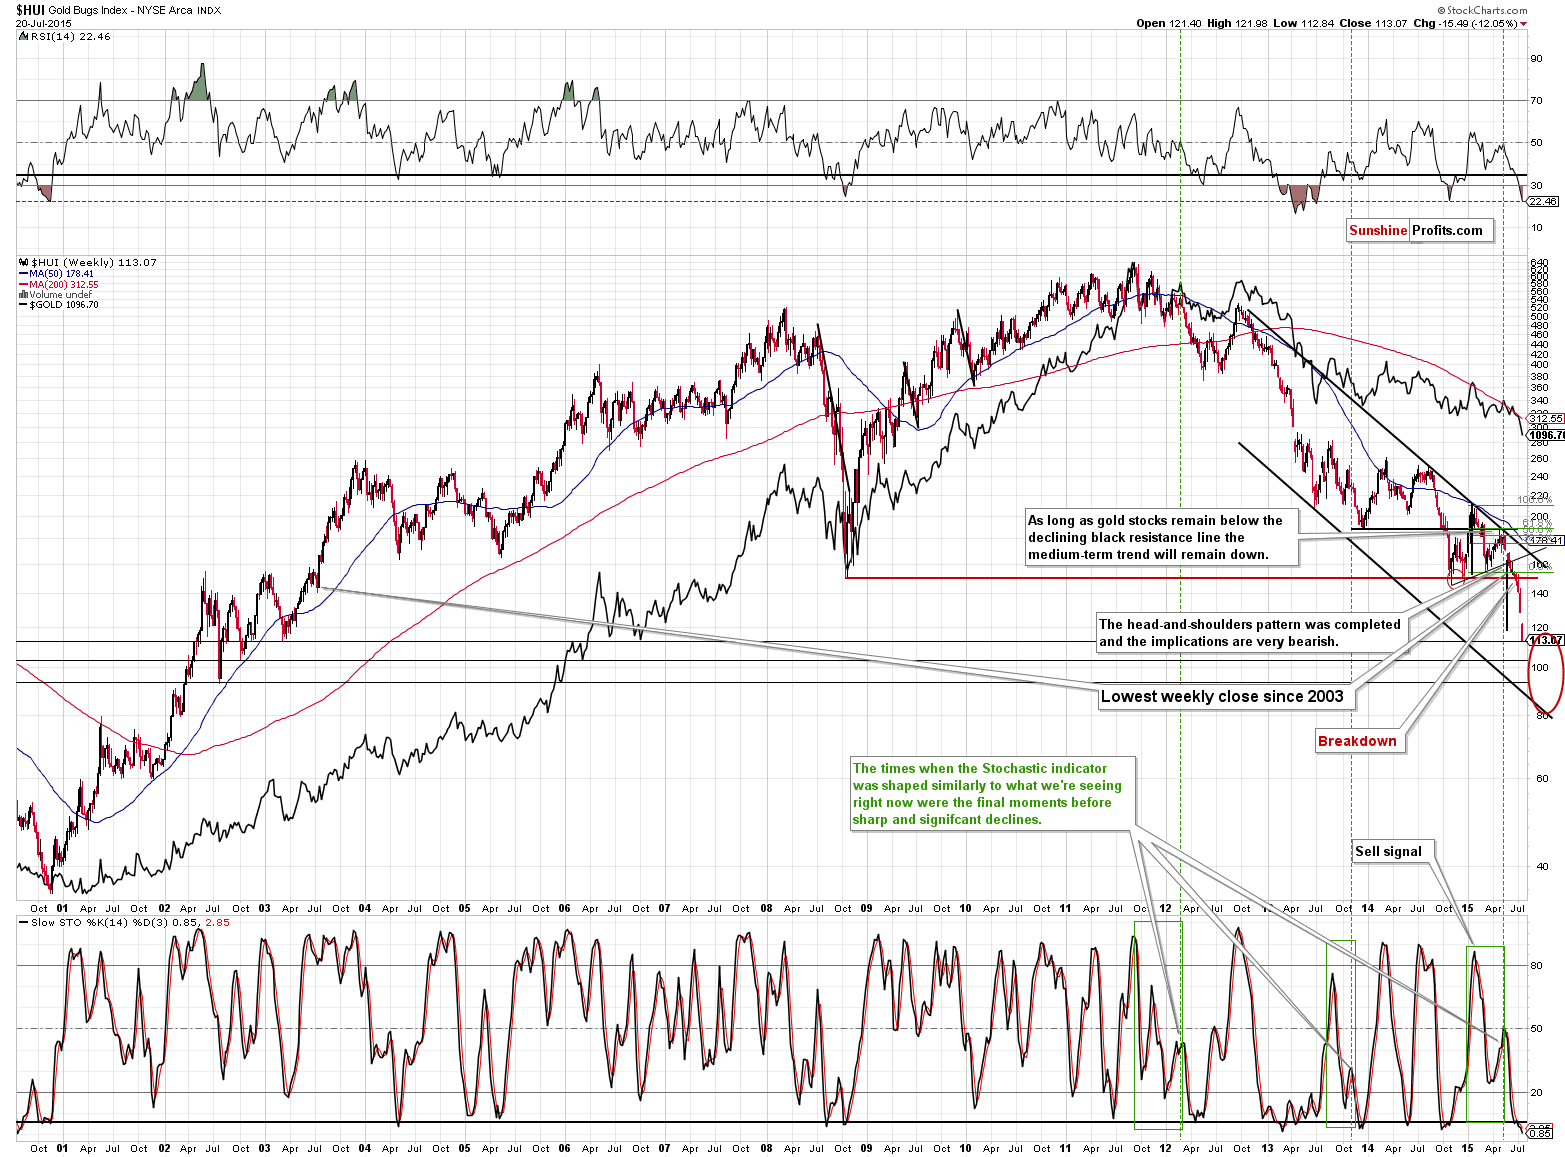
We previously commented on the above chart in the following way:
For the past several days we have been writing that the situation for mining stocks is very bearish as they broke below their 2008 lows. We can say the same thing also today. The outlook was very bearish and it still is. As you can see on the above HUI Index chart, we expect the final bottom to take place between 90 and 120, which is a rather broad range, but the 100 level seems to be the most likely target.
If gold and silver move higher temporarily then miners would likely move temporarily higher as well, but the very strong resistance created by the 2008 low will very likely not be broken as a result of such corrective rally. Whether this move in gold stocks and silver stocks is worth betting on will depend on confirmations that we get.
Speaking of confirmations, we dedicated a large part of one of the previous alerts to discussing the confirmations that we expect to see when the final bottom is in – they are more important than price levels, so if you haven’t had the chance to read about it previously, we encourage you to do so today.
The thing that we would like to add today is that if gold closes below $1,100 or so, we could see HUI close to or below 120. This level is the upper part of our target area and it’s the target level based on the head-and-shoulders formation that started forming in the final part of the previous year.
We might limit or close the current short positions when HUI gets to 120 or so, but that’s not certain just yet.
We didn’t close the short positions and we didn’t limit them and it turned out to be a very profitable decision. The HUI Index plunged more than 12% on just one day and closed at 113.07. The level that stopped the decline was the 2003 low. That’s right, gold stocks are as low as they were more than 12 years ago. That’s the upper part of our target area. Was the bottom formed? That could be the case, but another move lower – to the late 2002 bottom or the 100 level can’t be ruled out. In fact, it’s seems likely. We wouldn’t say that another decline was likely after an already major move lower if it wasn’t for gold’s likely move lower. If gold is to decline about $50 in the coming days, then it’s unrealistic to expect miners not to decline, especially that they haven’t started to show strength yet.
What about the final bottom? It seems that miners will have to move even lower before the final bottom is formed. How low would that be? Quite likely close to the 90 level – close to the declining support line. If this line doesn’t stop the miners, then the next support is the late 2001 low – close to the 60 level. We are not adjusting our broad target area on the above chart, as the situation is still rather unclear as far as the final bottom is concerned. It’s a bit clearer on the XAU Index chart.
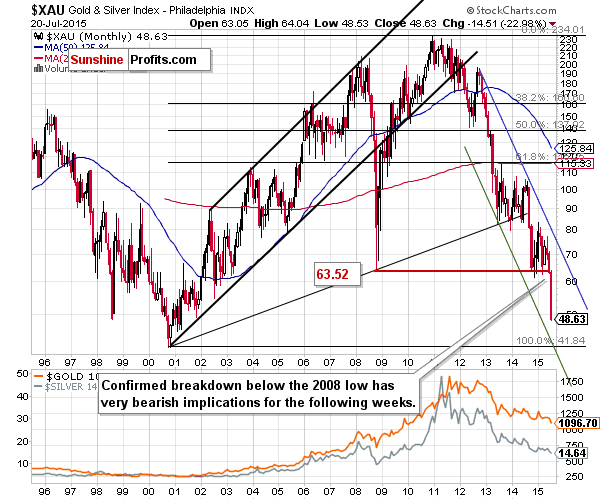
The 2000 bottom is a major target (especially that it corresponds to the declining support line) and it will take just a little more than a repeat of yesterday’s decline for the mining stocks to reach it. That would be a major development and if gold declines another $50, then it’s very likely that it will indeed take place.
The most interesting part is that the 2000 bottom doesn’t have to be the final bottom for the current decline. If we see this level, but not enough other confirmations, then it might not be enough for us to consider getting back in the market with the long-term investment capital. It might be enough to get back in with half thereof.
Summing up, the situation in the precious metals market is critical and it seems that we will get a corrective upswing relatively soon as there is too much negativity regarding gold in the mainstream media. The odds are that this will not be the final bottom, but a local one. The coming move higher, however, is something that we would like to trade. Consequently, we are adjusting our target levels in our speculative positions (below) and we are changing them from “initial target prices” to “profit-take orders”. This means that when these levels are hit, we think the positions should be exited (as it will seem justified from the risk/reward perspective).
We might consider going long with the speculative capital or even getting back in the market with part of the long-term investment capital, but we are not doing so right now. In other words, we might make changes in the long-term investment part of the portfolio but that’s not certain.
On a side note, if you’re not familiar with the way we choose individual gold stocks and silver stocks, we suggest that you become familiar with our tools: Golden StockPicker and Silver StockPicker – these are the tools that we will utilize to select miners to buy when getting back on the long side of the market, as they have greatly enhanced the performance of the simple buy-and-hold approach.
We will keep you – our subscribers – updated.
To summarize:
Trading capital (our opinion): Short position (full) position in gold, silver and mining stocks is justified from the risk/reward perspective with the following stop-loss orders and profit-take orders:
- Gold: profit-take order: $1,053; stop-loss: $1,208, profit-take order for the DGLD ETN: $99.92; stop loss for the DGLD ETN $66.49
- Silver: profit-take order: $14.33; stop-loss: $17.11, profit-take order for the DSLV ETN: $75.46; stop loss for DSLV ETN $38.32
- Mining stocks (price levels for the GDX ETN): profit-take order: $12.33; stop-loss: $18.73, profit-take order for the DUST ETN: $46.46; stop loss for the DUST ETN $14.08
In case one wants to bet on lower junior mining stocks' prices (we do not suggest doing so – we think senior mining stocks are more predictable in case of short-term trades – we if one wants to do it anyway, we provide the details), here are the stop-loss details and initial target prices:
- GDXJ: profit-take order: $16.73; stop-loss: $25.78
- JDST: profit-take order: $21.67; stop-loss: $5.79
Long-term capital (our opinion): No positions
Insurance capital (our opinion): Full position
Please note that a full position doesn’t mean using all of the capital for a given trade. You will find details on our thoughts on gold portfolio structuring in the Key Insights section on our website.
As a reminder – “initial target price” means exactly that – an “initial” one, it’s not a price level at which we suggest closing positions. If this becomes the case (like it did in the previous trade) we will refer to these levels as levels of exit orders (exactly as we’ve done previously). Stop-loss levels, however, are naturally not “initial”, but something that, in our opinion, might be entered as an order.
Since it is impossible to synchronize target prices and stop-loss levels for all the ETFs and ETNs with the main markets that we provide these levels for (gold, silver and mining stocks – the GDX ETF), the stop-loss levels and target prices for other ETNs and ETF (among other: UGLD, DGLD, USLV, DSLV, NUGT, DUST, JNUG, JDST) are provided as supplementary, and not as “final”. This means that if a stop-loss or a target level is reached for any of the “additional instruments” (DGLD for instance), but not for the “main instrument” (gold in this case), we will view positions in both gold and DGLD as still open and the stop-loss for DGLD would have to be moved lower. On the other hand, if gold moves to a stop-loss level but DGLD doesn’t, then we will view both positions (in gold and DGLD) as closed. In other words, since it’s not possible to be 100% certain that each related instrument moves to a given level when the underlying instrument does, we can’t provide levels that would be binding. The levels that we do provide are our best estimate of the levels that will correspond to the levels in the underlying assets, but it will be the underlying assets that one will need to focus on regarding the sings pointing to closing a given position or keeping it open. We might adjust the levels in the “additional instruments” without adjusting the levels in the “main instruments”, which will simply mean that we have improved our estimation of these levels, not that we changed our outlook on the markets. We are already working on a tool that would update these levels on a daily basis for the most popular ETFs, ETNs and individual mining stocks.
Our preferred ways to invest in and to trade gold along with the reasoning can be found in the how to buy gold section. Additionally, our preferred ETFs and ETNs can be found in our Gold & Silver ETF Ranking.
As always, we'll keep you - our subscribers - updated should our views on the market change. We will continue to send out Gold & Silver Trading Alerts on each trading day and we will send additional Alerts whenever appropriate.
The trading position presented above is the netted version of positions based on subjective signals (opinion) from your Editor, and the Tools and Indicators.
As a reminder, Gold & Silver Trading Alerts are posted before or on each trading day (we usually post them before the opening bell, but we don't promise doing that each day). If there's anything urgent, we will send you an additional small alert before posting the main one.
=====
Latest Free Trading Alerts:
On Sunday, gold plunged about 4 percent in a matter of minutes in Asian trading. What did happen? Was it manipulation, a panic selling, or something else?
Gold Drops to Lowest Since 2010
=====
Hand-picked precious-metals-related links:
Two Minute Recap: Reactions to Gold Price Decline
=====
In other news:
Fed takes tough stance on bond liquidity, downplays market fears
Greece submits bill needed to start rescue talks
Buy Europe, dump US stocks: Goldman
=====
Thank you.
Sincerely,
Przemyslaw Radomski, CFA
Founder, Editor-in-chief
Gold & Silver Trading Alerts
Forex Trading Alerts
Oil Investment Updates
Oil Trading Alerts

