

Briefly: In our opinion, short (full) speculative positions in gold, silver and mining stocks are justified from the risk/reward point of view.
Yesterday was a critical day in practically all parts of the precious metals sector. Gold reached an important support level, silver closed at our “initial target level” (and that was the lowest daily close in 5 years) and gold stocks truly plunged closing at the lowest level in 13 years (breaking very visibly below the 2008 lows). The profits on our short positions soared. Since there was no breakdown in gold, silver reversed before the end of the session and miners invalidated the previous breakdown – is yesterday’s rally a major opportunity to close any remaining short positions and get back in the precious metals market, or is it a red-alert situation to get out of the precious metals market and increase the size of the short positions?
Even though it seems that we are in uncharted waters here, it’s not true. It’s not the first time that we are seeing this type of situation. If we see the repeat of what happened previously… Well, you definitely want to be prepared.
Let’s jump to the charts and see what happened (charts courtesy of http://stockcharts.com).
Yesterday we wrote the following:
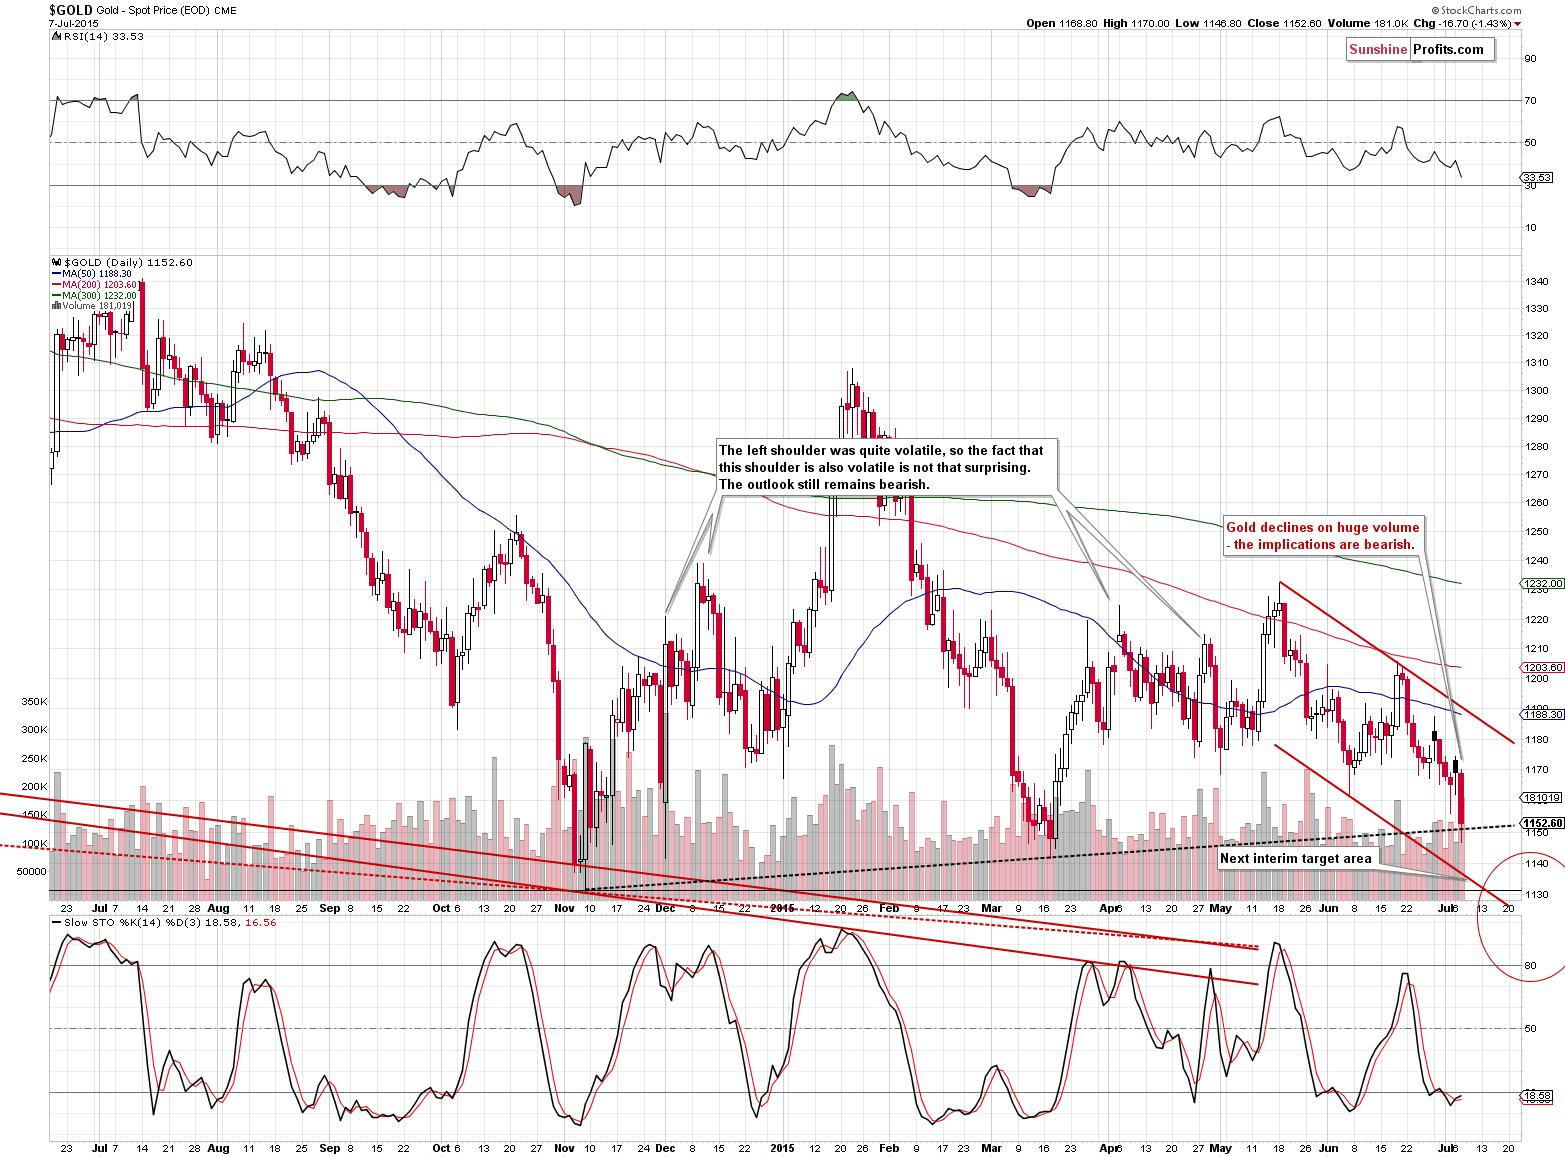
Gold moved a bit higher and that’s a bearish development, because there was a good fundamental reason for gold to rally – Greeks said “no” in the referendum and the Greek finance minister resigned, which means that the situation became even more tense and one would expect the safe-haven demand for gold to kick-in. Gold didn’t do much, though and the corresponding volume levels were rather small.
Gold indeed declined and the size of the move was not minor. The corresponding volume was not small either – the move alone is bearish, but the support line based on the major bottoms of 2014 an 2015 was just reached, which could keep the declines in check.
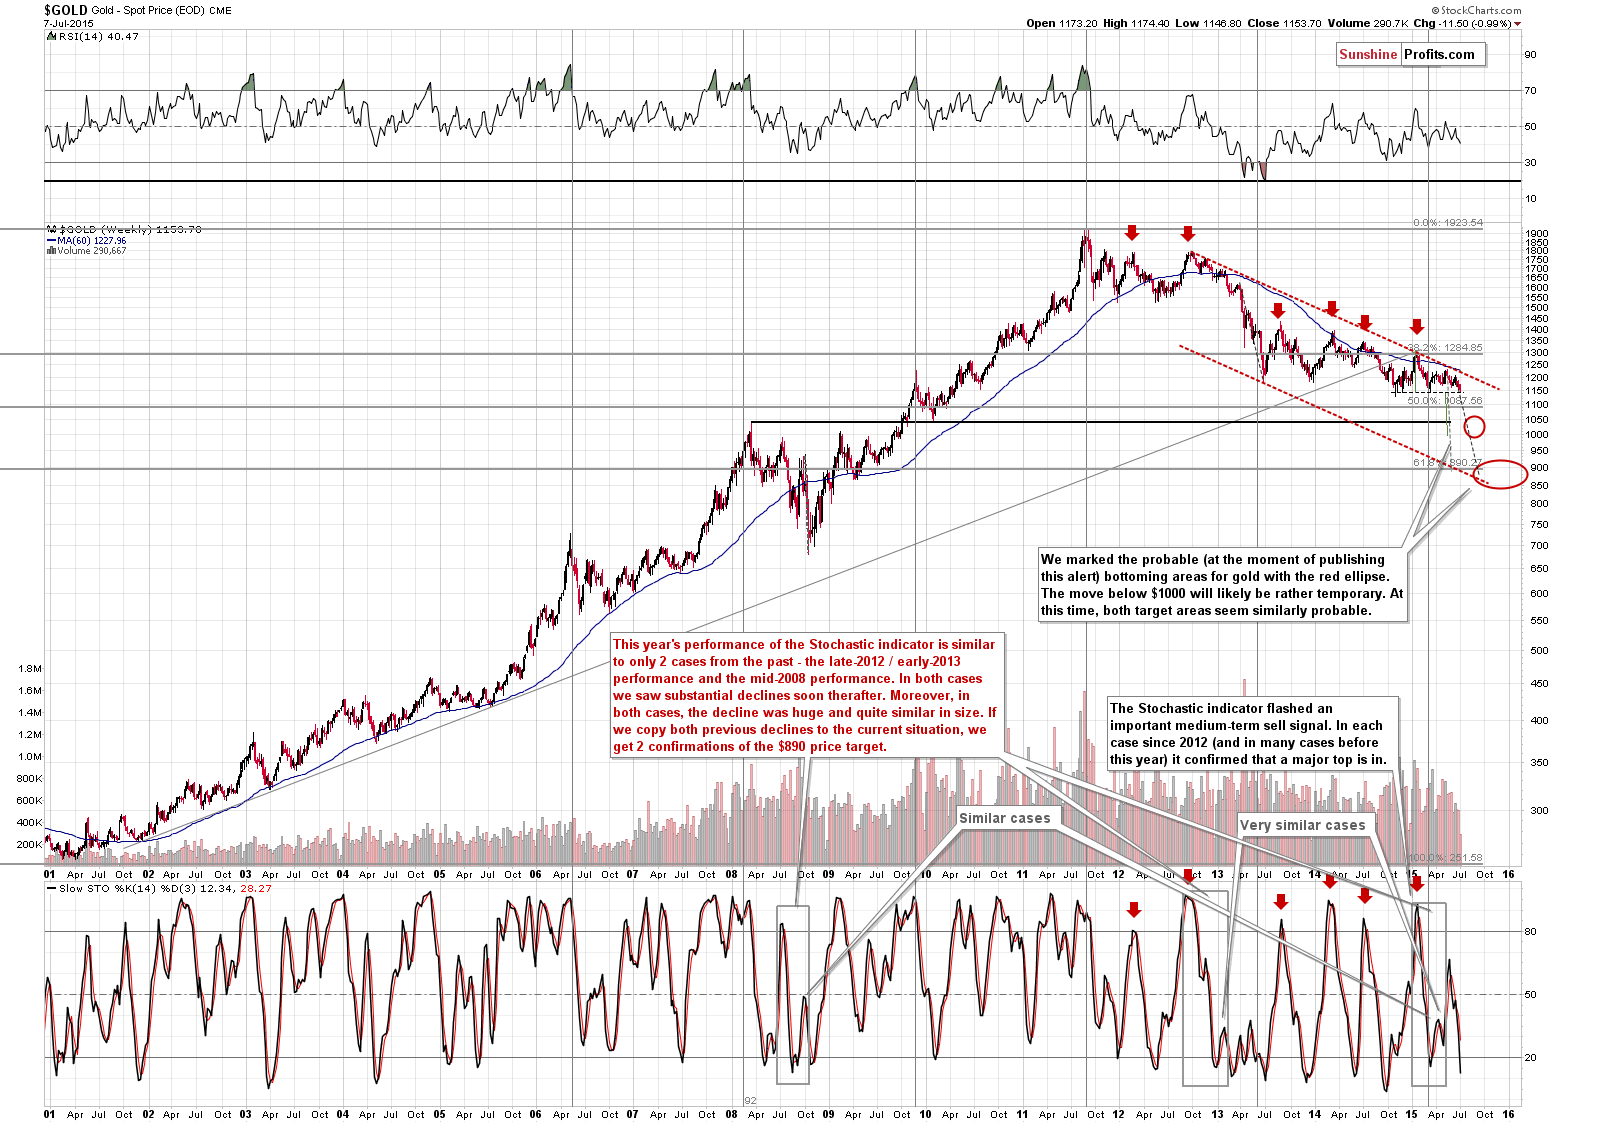
The long-term chart shows no breakdown and our target areas for the final bottom in gold are far away.
All in all, not much changed in gold – there was no major breakdown that would suggest much lower prices relatively soon. Gold could even bounce back based on the support line that’s visible on the short-term chart.
What about silver?
In yesterday’s alert we wrote the following:
The situation in the silver market didn’t change – it’s been bearish and it still is. Silver once again moved a bit (less than 1%) higher, but the move didn’t take it visibly above the declining resistance line. The tiny move above it was canceled and silver closed more or less at this line, thus nothing changed. The move higher was accompanied by low volume, which has bearish implications.
(…)
Silver’s important turning point is approaching. In all 4 previous cases these turning points were followed by declines, so the implications of silver reaching the turning point are bearish. In the previous cases, silver was after a sizable rally and at this time it is only a very short-term and small rally that it’s after, so the implications are not as clear and not as bearish as they were in the previous cases, but still, they are more bearish than not – especially for the following weeks (not necessarily days).
It turns out that we didn’t have to wait longer than an additional day for the market to confirm our outlook. Silver plunged.
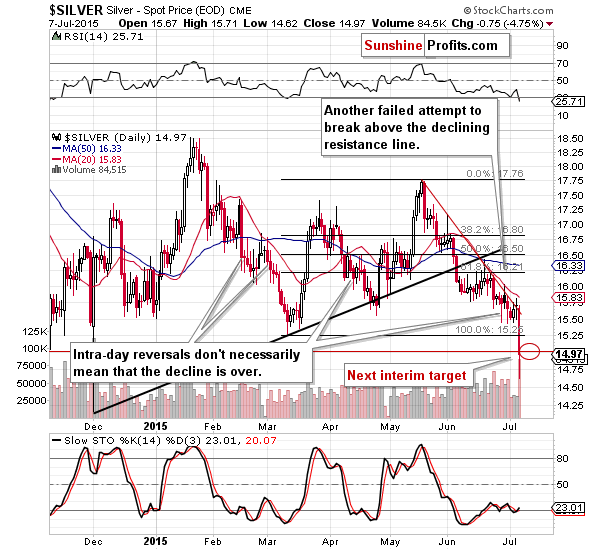
Silver moved below our initial target level for this decline and closed more or less at it. The profits on the short position increased greatly, but the question is if we should close this position. If we were to base our decisions on the above (and below) charts alone, we would do it – we would close the position and take profits off the table. We’ll continue this discussion in a few moments.
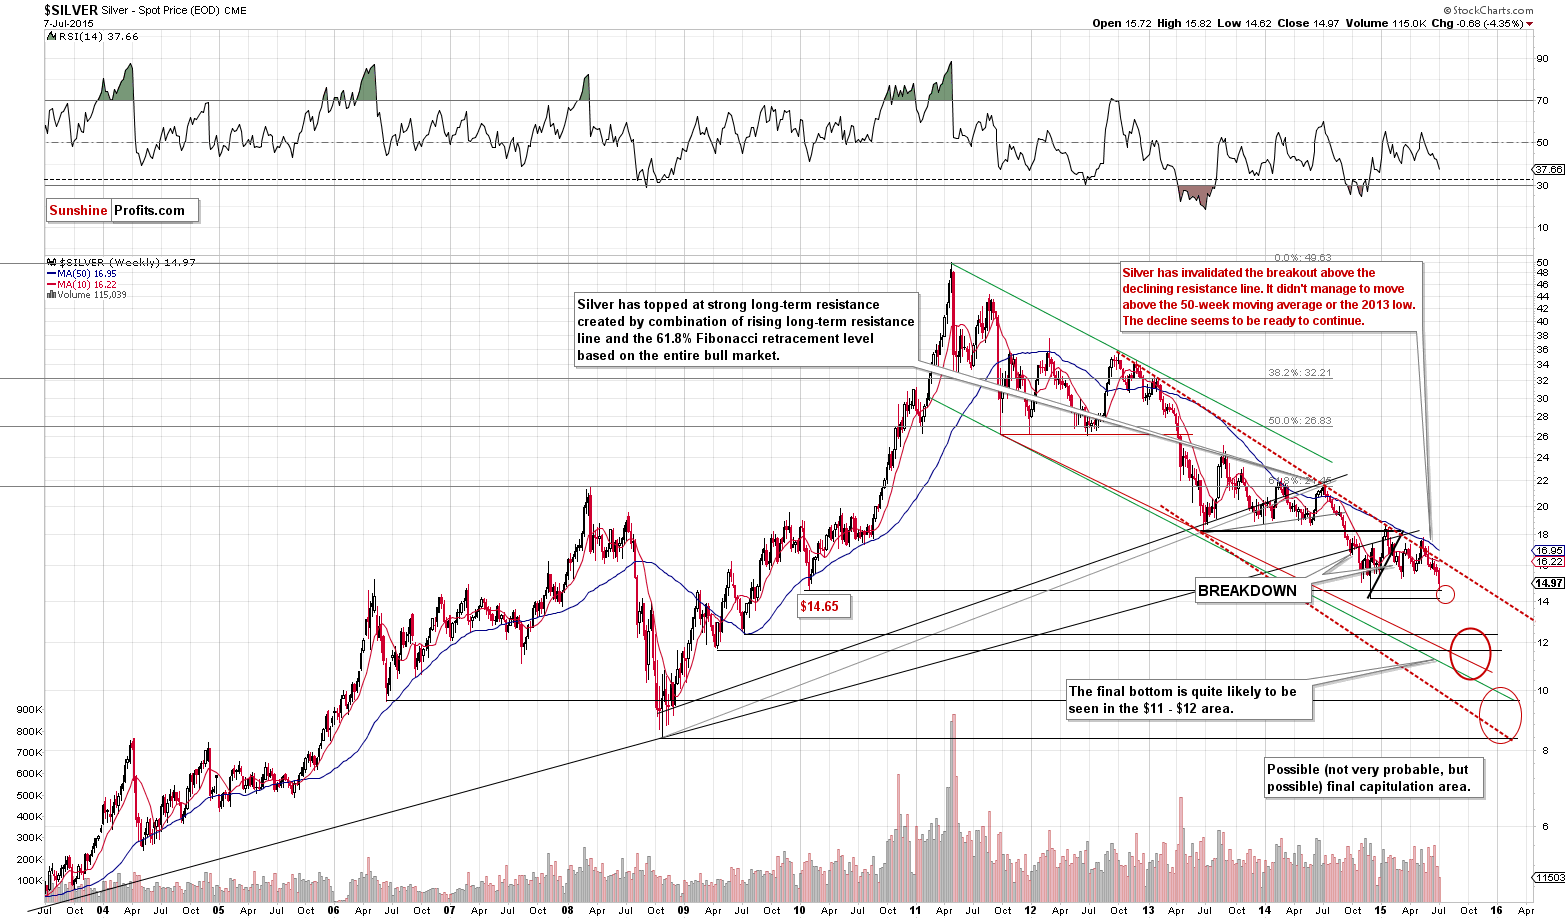
The long-term silver chart shows that it was the 2010 bottom that stopped silver’s decline yesterday. It was the lowest daily close since that time, though. In other words, we saw a breakdown in daily closing prices below the 2014 low.
The upper part of our target area that was reached – we could see a rebound from here, but we could also see a decline to $14 and still see silver in the target area. Will silver rally substantially from here? We doubt it. If silver is to move even lower in the coming months (and we think that this will be the case), then the decline is likely to be rather similar to the early 2013 and late 2014 declines. These declines didn’t take silver lower in a straight line, but the rebounds were very insignificant and not worth trading in our opinion – it was best to stay out of the market / short for the entire decline without aiming to catch each corrective upswing.
By the way, do you recall the time when silver rallied sharply (outperforming gold) and many analysts (almost everyone?) on the precious metals scene got excited about this extremely bullish sign that was supposed to take the entire precious metals higher shortly?
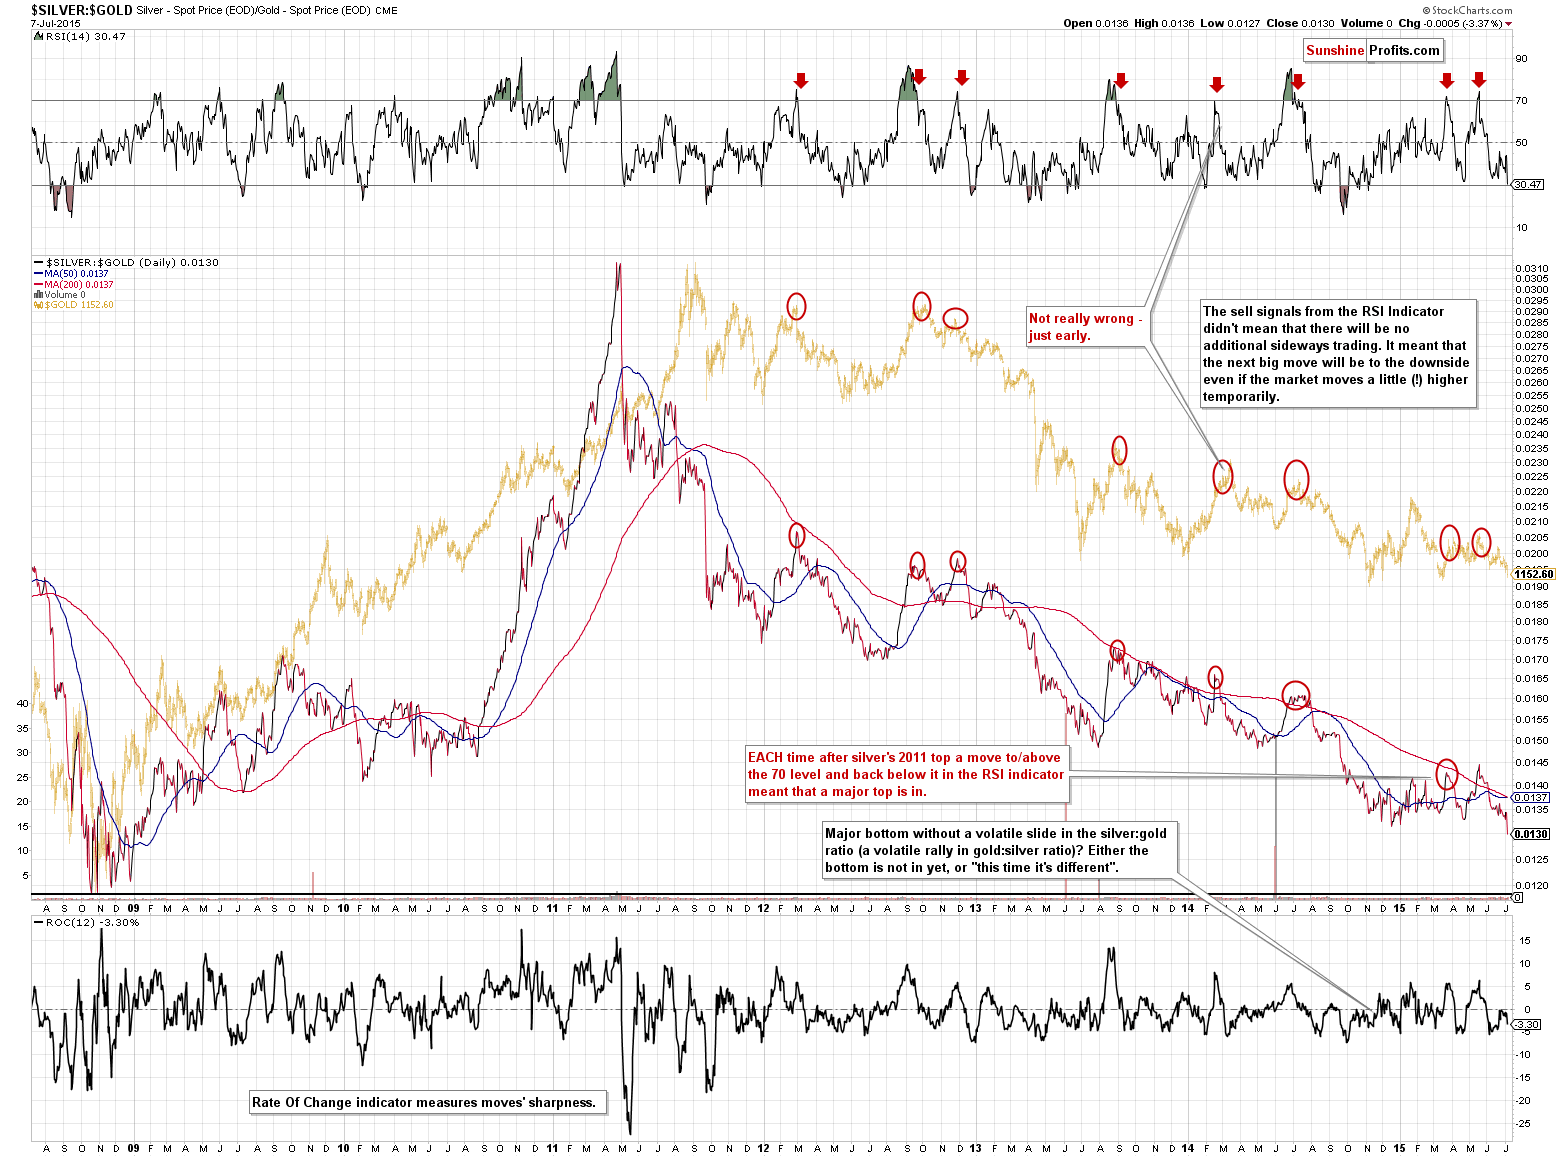
We had applied analysis instead of emotions and noted that in each (!) case since the 2011 top, when silver outperformed gold in a similar fashion, it meant that a local top was in. And… We saw another local top – history repeated itself once again, just like it was likely to. Keeping the above example in mind should prove useful next time things get hot on the downside (or during silver’s next “breakout”) – the analysis, not the emotions is what we will be following.
The above chart shows us one additional thing – that silver didn’t decline sharply enough (relative to gold) to indicate a major bottom. In the previous cases, major bottoms were confirmed by silver’s sharp plunge – yesterday’s decline was not sharp enough to visibly move the ROC indicator. Consequently, it seems that the precious metals sector needs to move even lower in the coming weeks / months.
Having said that, let’s move to the most important part of today’s analysis – the one dedicated to the mining stocks sector. The action in mining stocks is so important right now because they once again moved below their 2008 lows and this time, they did it in a clear, volatile, and very bearish form. Both the XAU and HUI indices closed well below their respective 2008 lows and because of this (and the previous confirmation of the breakdown by 3 consecutive closes below the 2008 low) we view the breakdown as clearly confirmed.
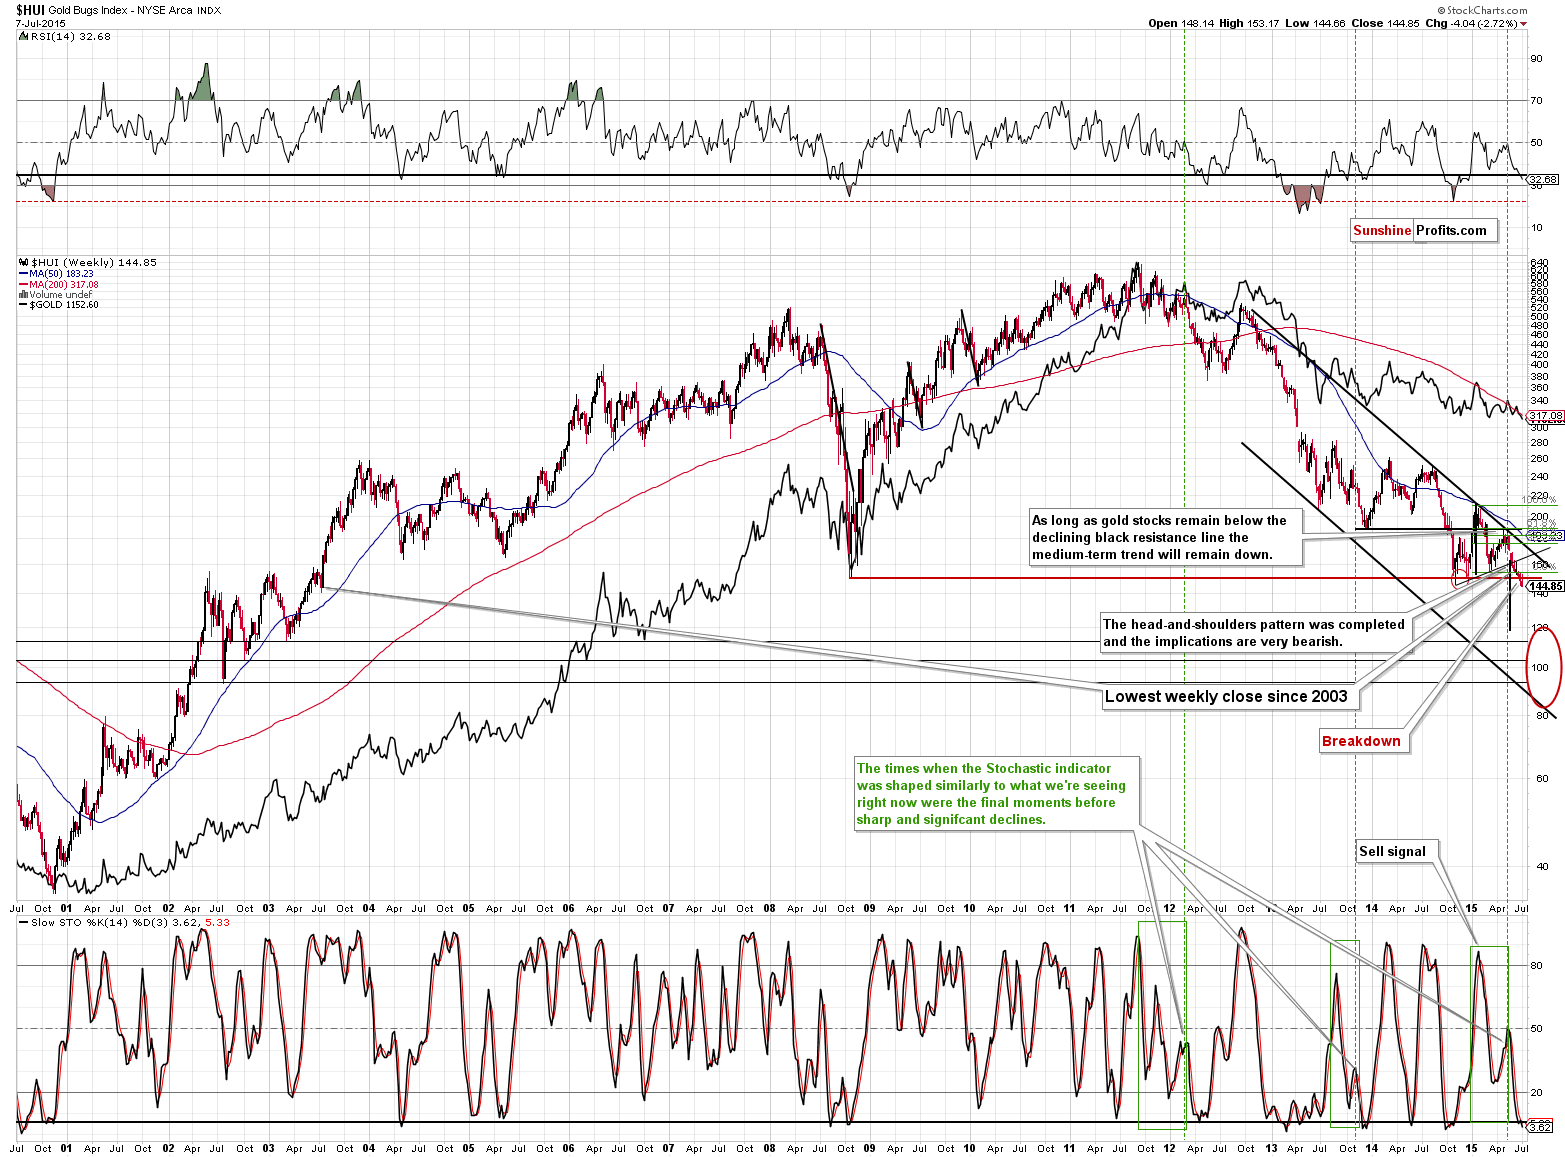
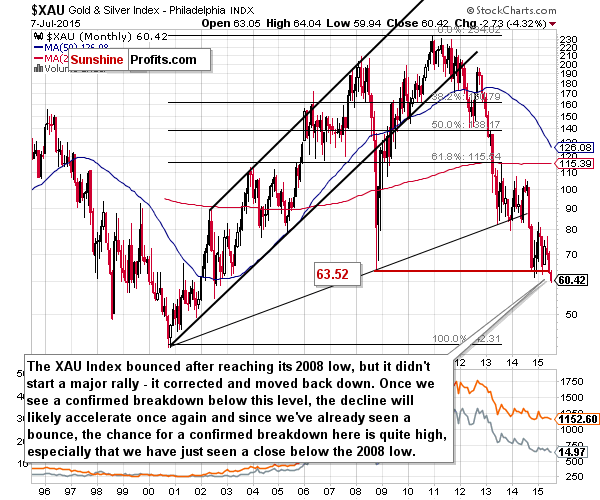
As you can see on the above charts, breakdowns are clearly visible – even on the XAU’s 20-year charts.
The “problem” (or opportunity, depending on how one looks at it) with the above indices is that in both cases there is no significant support close to the current price levels. This has profound implications – it means that mining stocks can – and are likely to – drop very far even given the fact that they are very oversold from the fundamental point of view.
How low can they go? We are not ruling out a move to 100 or so in the HUI Index and a move to 50 or even 42 in the XAU Index (the 2000 bottom). Yes, we know that these levels are very low, but didn’t the current values seem unrealistically low back in 2011?
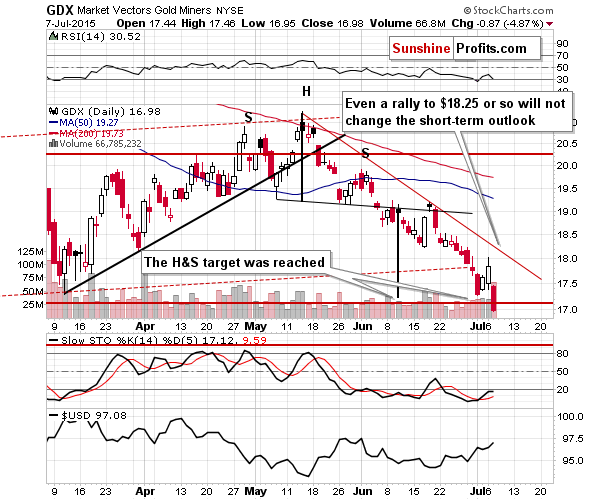
We wrote the following about the GDX chart yesterday:
The head-and-shoulder-based target that we described about a month ago was reached, but given the recent breakdowns in the HUI an XAU indices, it seems that staying on the short side of the market is a good idea, as the above-mentioned breakdowns suggest that the next major move is going to be down (and we don’t want to risk missing it).
It turns out that it was a good idea - we didn’t miss yesterday’s decline – we profited from it.
The previous mining stock’ outperformance of gold turned out to be just a blip on the radar screen, just like we had expected.
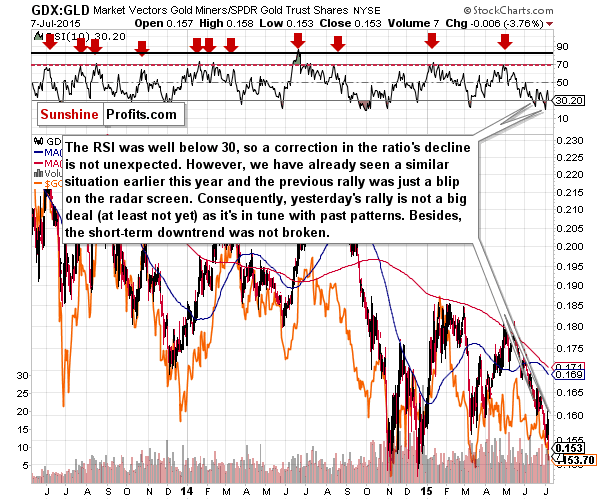
In yesterday’s alert we wrote about the above chart in the following way:
We have previously seen this kind of performance (a short-term rally with the RSI indicator moving back above the 30 level) this year and the precious metals sector didn’t rally shortly thereafter – it continued to decline after a quick bounce. The short-term downtrend was not broken, so even the short-term trend remains down.
The miners’ underperformance is also visible from the long-term perspective.
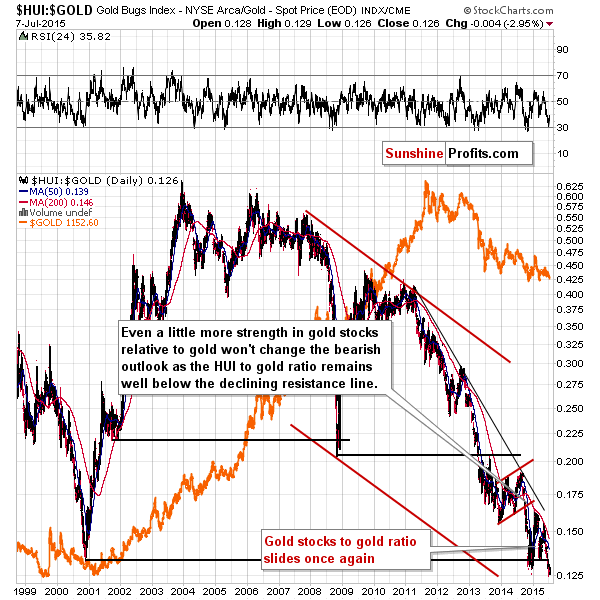
The gold stocks to gold ratio moved well below its 2000 low and stayed there long enough for the move to be clearly visible on the 16-year chart. The implications are clearly bearish.
Now, having discussed the situations in gold, silver and mining stocks separately, let’s look at them together and discuss when we saw something similar.
- Gold is not breaking below important medium-term lows (at least not yet), but is very close to them.
- Silver has been underperforming gold for some time, but it has not confirmed the breakdown (and we only saw a breakdown in terms of daily closing prices, not yet in terms of intra-day lows) below the important medium-term low.
- Mining stocks have been showing weakness and they have already broken below critical support levels (confirmed by both the HUI and XAU indices) and this move is clearly suggesting much lower prices for the miners.
Does the above ring any bells?
That’s exactly what we saw in April 2013 right before the major breakdown in gold and silver and the subsequent plunge in the entire precious metals sector.
Back then miners were the first to break below the key support levels, which served as a visible indication that the precious metals sector was about to move much lower.
As a reminder, here’s what happened back then:
On April 12 we sent / posted the alert at 11:22 AM (gold was at about $1,500) in which we suggested closing the remaining half of the long-term investments in mining stocks (we exited the first half on April 4 [HUI’s value was a bit more than twice the current value]) and closing / hedging half of the long-term investments in gold and silver. We wrote about exiting the remaining half position in gold and silver in the April 15 (6:33 AM) alert. At that time gold was at about $1,410-$1,415.
Our aim was to exit the long-term positions completely after a meaningful breakdown below the 2012 lows. On Apr 12, we wanted to take action tens of dollars above $1,500, but the move was very volatile and even though we wanted to distribute the information earlier, we couldn't do it as the message had to be written, checked and sent (including quick proofreading and sending a test e-mail message to make sure that it went through). There are some limits to the form of providing signals in a newsletter that we aim to minimize, but we are not able to completely erase in this form of providing our services.
We’re once again in the situation when gold and silver have not broken significantly yet, but miners have – this time, however, we are already out of the market with the long-term investment capital (which has been the case for quite a long time - which has saved a lot of capital, as buying back at lower prices will be much more profitable) and we are already shorting the precious metals market at this time.
The question remains if it’s justified to double the size of the short position based on the confirmed breakdown in miners and the similarity to April 2013. After all that’s just one previous case, which makes the analogy only moderately reliable – if we had multiple similar cases and all were followed by the same action (like the silver to gold ratio analysis) – then the situation would be much clearer. At this time, our reply is yes. We think that doubling the size of the short position is justified from the risk/reward point of view.
We usually suggest doubling the size of the short position when the risk associated with the position becomes lower. This time, the risk is lower for miners, but a bit higher for gold and silver as they moved closer to their support levels (there was no breakdown in gold and no breakdown in silver in terms of intra-day lows). However, based on the analogy to April 2013, and the previous declines in the case of silver, the projected size of the trade has just increased (to be precise, the target areas remain unchanged, what has increased are the odds for not seeing a bigger corrective upswing in the following weeks).
Summing up, the situation in the precious metals market deteriorated and we think the risk/reward ratio favors doubling the size of the profitable short positions. We are also moving our initial target levels and stop-loss levels lower, as the market moved in tune with our expectations.
We will keep you – our subscribers – updated.
To summarize:
Trading capital (our opinion): Short position (full) position in gold, silver and mining stocks is justified from the risk/reward perspective with the following stop-loss orders and initial (!) target prices:
- Gold: initial target price: $1,062; stop-loss: $1,208, initial target price for the DGLD ETN: $95.88; stop loss for the DGLD ETN $66.49
- Silver: initial target price: $12.72; stop-loss: $17.11, initial target price for the DSLV ETN: $102.21; stop loss for DSLV ETN $38.32
- Mining stocks (price levels for the GDX ETN): initial target price: $14.12; stop-loss: $18.73, initial target price for the DUST ETN: $30.68; stop loss for the DUST ETN $14.08
In case one wants to bet on lower junior mining stocks' prices (we do not suggest doing so – we think senior mining stocks are more predictable in case of short-term trades – we if one wants to do it anyway, we provide the details), here are the stop-loss details and initial target prices:
- GDXJ: initial target price: $18.12; stop-loss: $25.78
- JDST: initial target price: $16.26; stop-loss: $5.79
Long-term capital (our opinion): No positions
Insurance capital (our opinion): Full position
Please note that a full position doesn’t mean using all of the capital for a given trade. You will find details on our thoughts on gold portfolio structuring in the Key Insights section on our website.
As a reminder – “initial target price” means exactly that – an “initial” one, it’s not a price level at which we suggest closing positions. If this becomes the case (like it did in the previous trade) we will refer to these levels as levels of exit orders (exactly as we’ve done previously). Stop-loss levels, however, are naturally not “initial”, but something that, in our opinion, might be entered as an order.
Since it is impossible to synchronize target prices and stop-loss levels for all the ETFs and ETNs with the main markets that we provide these levels for (gold, silver and mining stocks – the GDX ETF), the stop-loss levels and target prices for other ETNs and ETF (among other: UGLD, DGLD, USLV, DSLV, NUGT, DUST, JNUG, JDST) are provided as supplementary, and not as “final”. This means that if a stop-loss or a target level is reached for any of the “additional instruments” (DGLD for instance), but not for the “main instrument” (gold in this case), we will view positions in both gold and DGLD as still open and the stop-loss for DGLD would have to be moved lower. On the other hand, if gold moves to a stop-loss level but DGLD doesn’t, then we will view both positions (in gold and DGLD) as closed. In other words, since it’s not possible to be 100% certain that each related instrument moves to a given level when the underlying instrument does, we can’t provide levels that would be binding. The levels that we do provide are our best estimate of the levels that will correspond to the levels in the underlying assets, but it will be the underlying assets that one will need to focus on regarding the sings pointing to closing a given position or keeping it open. We might adjust the levels in the “additional instruments” without adjusting the levels in the “main instruments”, which will simply mean that we have improved our estimation of these levels, not that we changed our outlook on the markets. We are already working on a tool that would update these levels on a daily basis for the most popular ETFs, ETNs and individual mining stocks.
Our preferred ways to invest in and to trade gold along with the reasoning can be found in the how to buy gold section. Additionally, our preferred ETFs and ETNs can be found in our Gold & Silver ETF Ranking.
As always, we'll keep you - our subscribers - updated should our views on the market change. We will continue to send out Gold & Silver Trading Alerts on each trading day and we will send additional Alerts whenever appropriate.
The trading position presented above is the netted version of positions based on subjective signals (opinion) from your Editor, and the Tools and Indicators.
As a reminder, Gold & Silver Trading Alerts are posted before or on each trading day (we usually post them before the opening bell, but we don't promise doing that each day). If there's anything urgent, we will send you an additional small alert before posting the main one.
=====
Latest Free Trading Alerts:
Three weeks ago, the Federal Reserve Board approved a final rule amending Regulation D (Reserve Requirements of Depository Institutions). What does it imply for the future Fed’s monetary policy and the gold market?
Is Fed Preparing to Raise Interest Rates?
Although the new next finance minister (Euclid Tsakalotos) will represent Greece in an emergency meeting of euro zone finance ministers in Brussels today, the uncertainty over economic stability in Europe continues to weight on investors’ sentiment. In this environment, EUR/USD declined once again, hitting a fresh monthly low. How low could the exchange rate go in the coming days?
Forex Trading Alert: New Low in EUR/USD
=====
Hand-picked precious-metals-related links:
China sees surge in precious metal trading
DEGUSSA : Increased gold sales in 2015 by 50%
=====
In other news:
China stock market freezing up as sell-off gathers pace
Greece Faces Euro Exit Unless Demands Accepted by Sunday
=====
Thank you.
Sincerely,
Przemyslaw Radomski, CFA
Founder, Editor-in-chief
Gold & Silver Trading Alerts
Forex Trading Alerts
Oil Investment Updates
Oil Trading Alerts

