

Briefly: In our opinion, a speculative short position (full) in gold, silver and mining stocks is justified from the risk/reward point of view.
In the previous weeks we saw relatively strong performance of mining stocks – they multiplied gold’s gains and held up well when gold declined. This action made many traders believe that the rally that we were seeing was a beginning of another strong upleg in the precious metals sector. However, it seems that the tables have turned – miners have just declined visibly even without gold’s decline and in spite of the USD’s decline. Is this just a pause or was the recent upswing just a short-term correction?
In short, we think that the latter is much more probable. The miner’s outperformance was in tune with the past patterns that we saw before previous local tops. It seems that we have just seen one as well. Before discussing miners, let’s take a look at the metals themselves, starting with gold (charts courtesy of http://stockcharts.com).
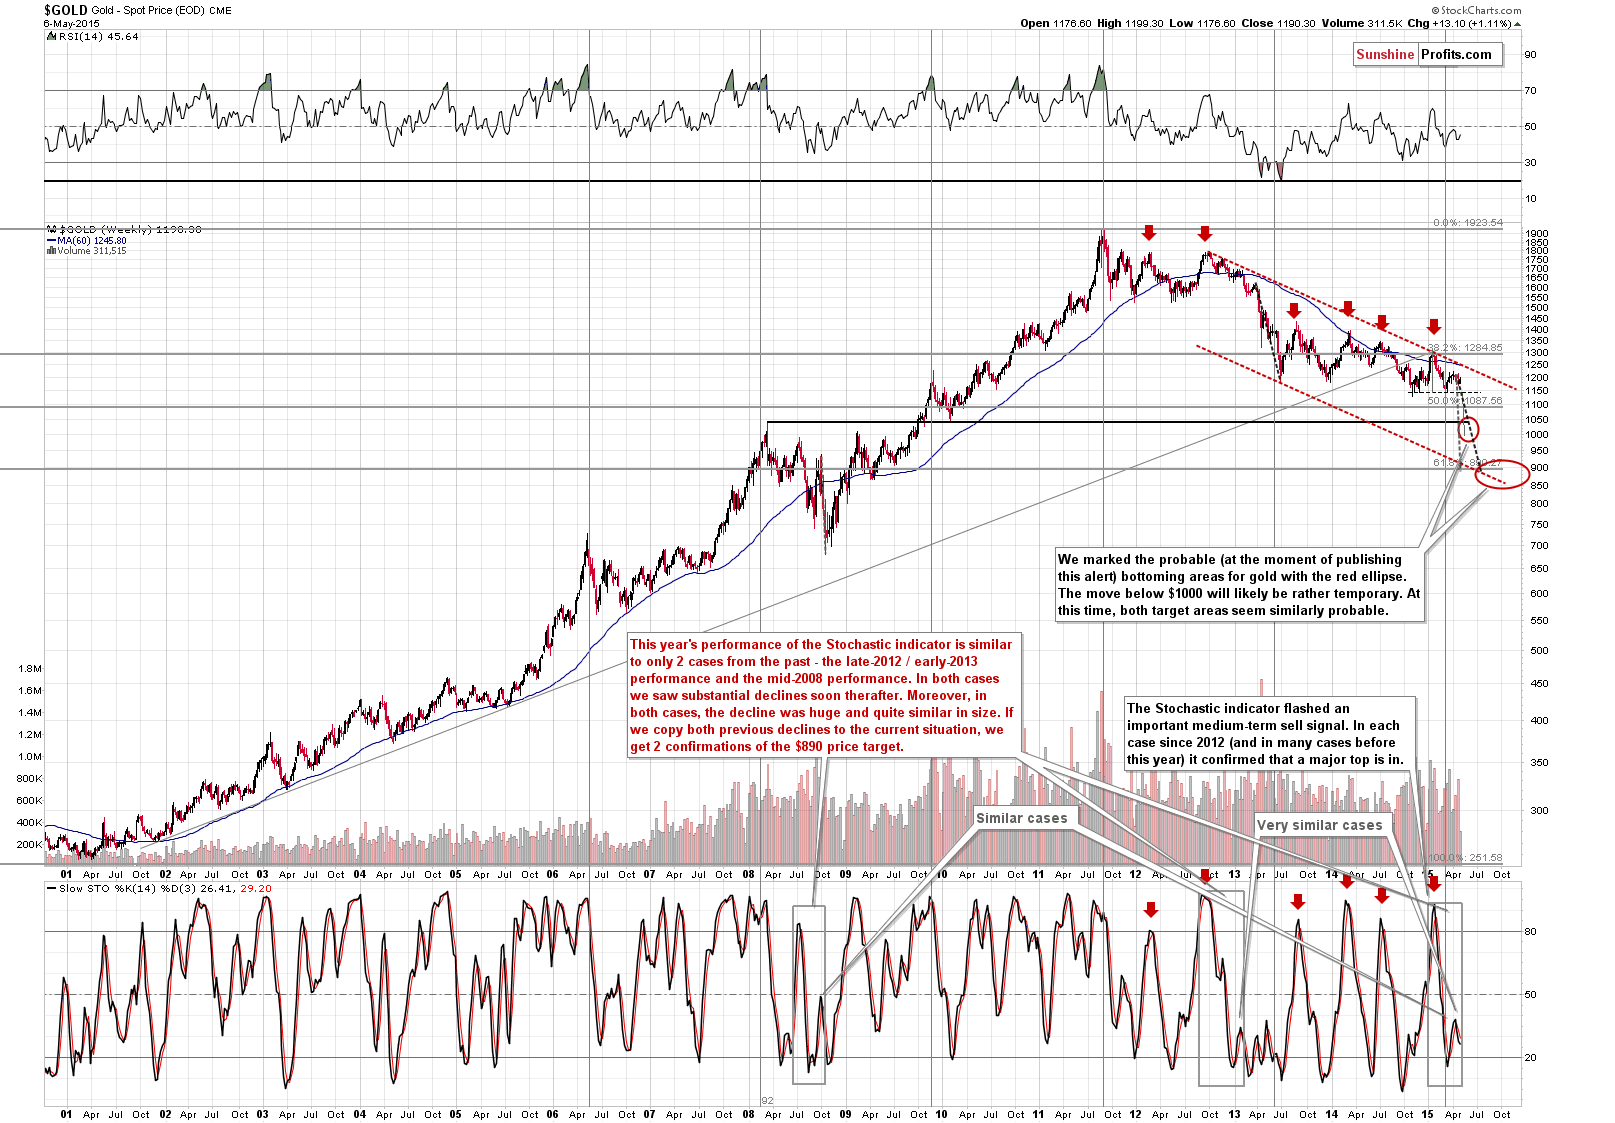
In short, there were no changes in the case of the long-term gold picture. The medium-term remains bearish and the Stochastic indicator still supports the scenario in which we are about to see a major decline.
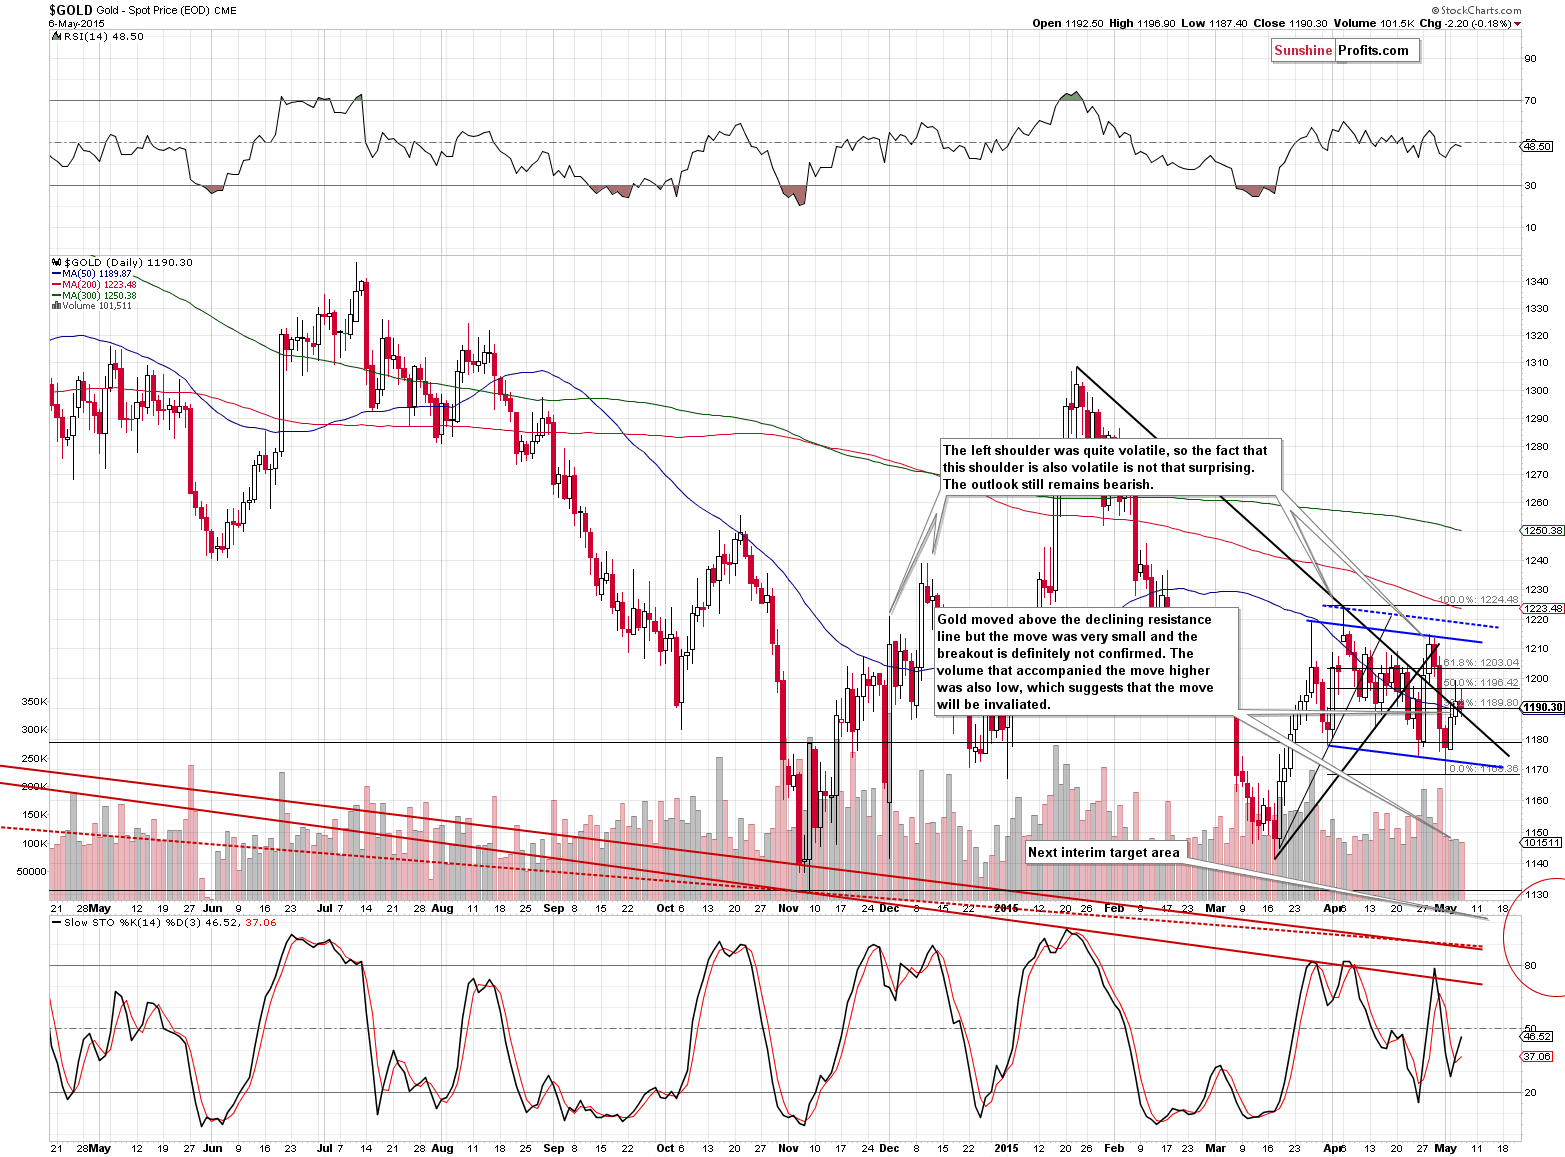
On a short-term basis, we see that gold declined, but is more or less where it was yesterday. Consequently, the situation is not really bearish, because the move above the declining resistance line is very small and the “breakout” was not accompanied by significant volume. The head-and-shoulders formation is still being formed and its implications will be very bearish (once it’s completed).
What about silver?
From the short-term perspective, once again nothing changed, so we have nothing new to comment on. However, we will quote our entire discussion of the price targets for silver, as we want to make sure that it reaches you:
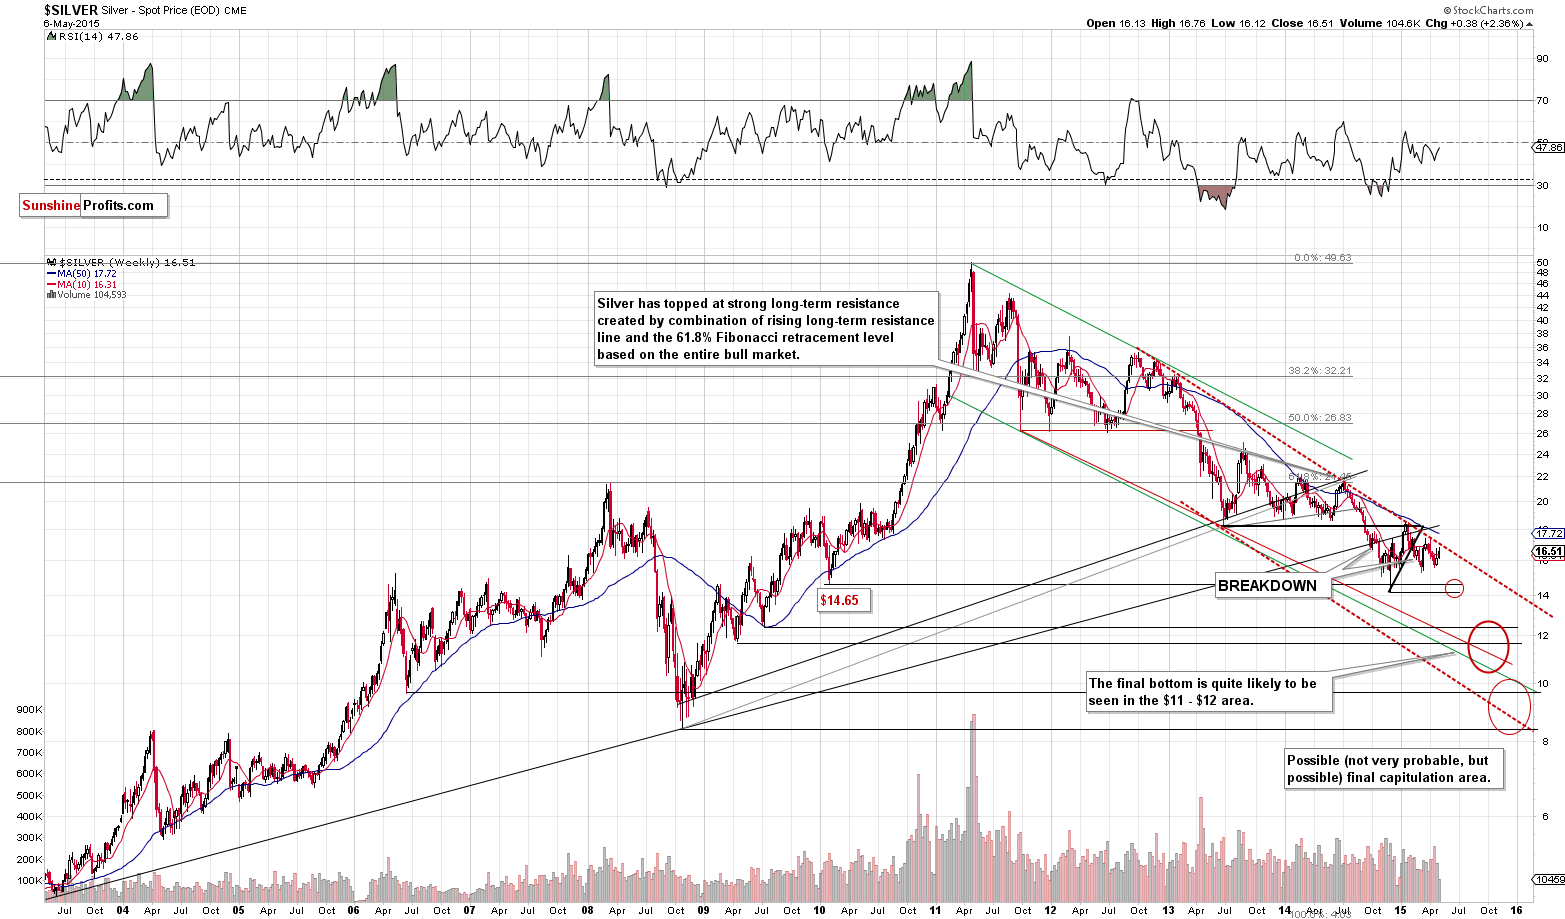
We have updated our target areas and we even added one more. Yes – it’s below $10, but before you close your browser window thinking that we lost our minds, please give us a few minutes to explain.
Why is silver likely to move lower in the coming months? Because we haven’t seen a lot of confirmations that the final bottom in the precious metal sector is in – there was no real panic that could end this decline. Why have we marked the areas that you can see on the above chart and not some other price ranges? Because that’s where the strong (!) support levels / lines are and / or where they intersect.
First of all, the initial target is at or slightly above the 2014 low. The 2010 and 2014 lows are both significant price levels and thus we think that they are likely to trigger a corrective upswing or a pause. Can silver form the final bottom at that price level? Yes, but we doubt it. Nevertheless, we will monitor the markets for signs of confirmation when silver is close to these levels.
We put the second target area in bold because we think it’s the most likely area for the final bottom to form. The area is quite wide because there are quite a few support levels / lines that need to be taken into account: 2 local bottoms of 2009 and – more importantly – the lower border of the declining trend channel (green) and the line based on the mid-2011 and 2013 lows. It seems that the place where the red line intersects with the lower of the 2009 lows is the most likely target – just below $12.
Our lowest target area is not much of a target area itself – it’s more of a “worst case” or “best case” scenario (depending on one’s approach and whether one will already be holding silver at these levels or is planning to buy at them). The area below the $10 level is the place where silver can go very temporarily. Please recall silver’s sharp and very temporary bottoms in early 2006, in mid-2007, and in early 2010 – we can see something like that but to a greater extent. It would not surprise us (and we mean exactly that – it’s not our prediction) to see silver “bottom” at $11-something, and then move below $10 for just a few hours and end the session back above $11. Silver could even end the week in which the above has taken place above $12 or $13. Silver is very volatile at the final bottoms and that’s going to be THE bottom. We can expect to see the level of volatility that we have never seen before and that’s why we don’t rule out such a significant and temporary decline.
Having said that, let’s move on to probabilities. Here’s how we view the outlook for silver and its final bottom:
- 10% probability that the final bottom in precious metals is already behind us
- 20% probability that we’ll see the final bottom with silver at $14 - $14.70
- 50% probability that we’ll see the final bottom with silver at $11 - $12.50
- 15% probability that we’ll see the final bottom with silver at $8 - $10
- 5% probability that we’ll see the final bottom with silver below $8.
Just like we described it earlier – the key thing to watch out for are not the price levels themselves, but rather the confirmations that we’ll see (or not) when the above levels are reached. If we see many confirmations with silver above $14, then it will be likely that this is the final bottom. However, if we don’t see them with silver at $12 or so, the odds would be that we would need to see a move below $10 for investors to panic and for the final bottom to form.
Having said that, let’s take a look at the gold stocks.
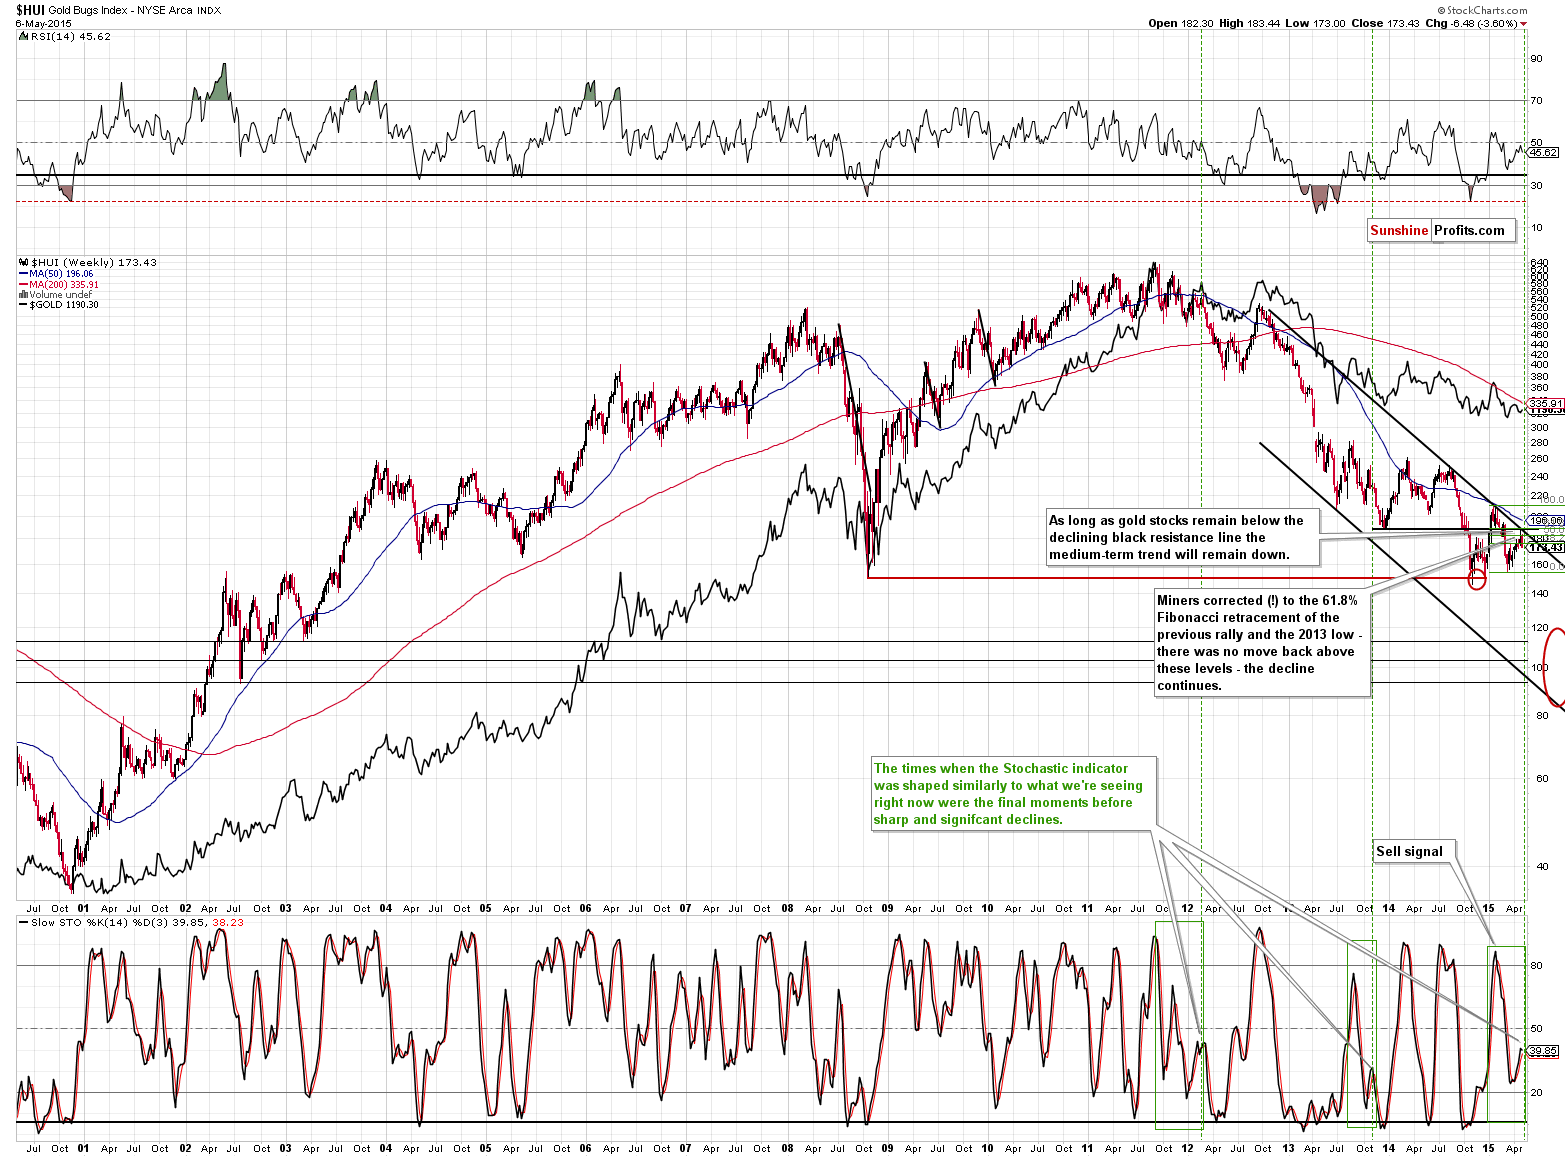
The HUI Index seems to be continuing its decline after once again moving close to the upper border of the declining trend channel. The recent rally was actually a correction of the 2015 decline – it corrected 61.8% thereof. At the same time, the index moved back to the 2013 low and then declined once again.
The new bearish factor on the above chart is the same thing that we can see on the long-term gold chart – the shape of the Stochastic indicator (in the lower part of the above chart). The significant slide, correction and then another sell signal (it seems that we are about to see one) is something that we saw only 2 times in the previous several years and in both cases it was just before a significant decline. Consequently, the implications are bearish.
What about the short-term perspective?
Yesterday, we wrote the following about mining stocks:
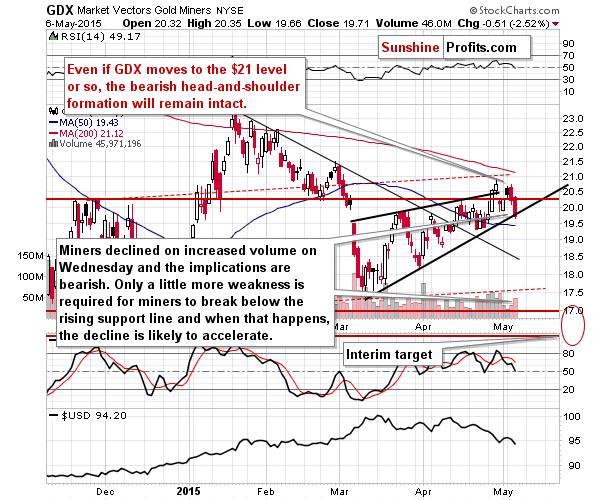
Not only is the size of yesterday’s upswing in miners a bearish sign, but we can say the same about the volume that accompanied this “rally”. The upswing took place on tiny volume that suggests that the buying power is either drying up or has already dried up.
We have received a few more questions about the miners’ outperformance last week and its implications, so we would once again like to emphasize that we don’t think that it has bullish implications at this time. We covered the reasons in greater detail in Friday’s Alert, but in short, the miners to gold ratio moved to an extreme level which signaled a local top in the past and was a quite reliable factor. Consequently, the implications are bearish also this time.
During yesterday’s and Tuesday’s sessions, the action in mining stocks was even more bearish – miners not only didn’t move higher in light of higher gold prices (on Tuesday), but they actually managed to decline (and decline significantly in the case of Wednesday’s session). Yesterday’s decline was particularly bearish as it was accompanied by a declining USD Index. In the previous weeks the USD’s decline triggered rallies in miners and we have just seen a sign that this is no longer to be expected.
Why is this so significant? Because it seems that the USD Index can move even lower temporarily.
Before looking at the USD Index, let’s take one more look at the mining stocks to gold ratio.
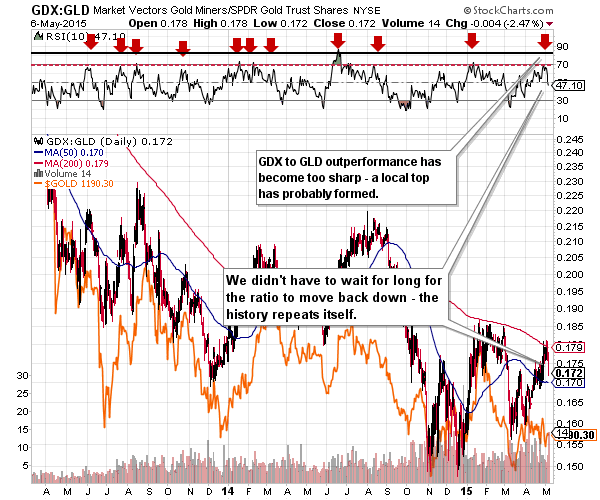
The miners to gold ratio moved quite high recently and the RSI indicator based on the ratio moved higher as well. However, it moved to the 70 level, which indicated that the local top was quite likely in, as that was the case multiple times in the past. We have just seen a slide in the miners, in the ratio, and in the RSI indicator – it seems that the history simply repeated itself once again.
In the previous weeks, the declining USD Index contributed to rising precious metals and mining stock prices, but it doesn’t seem that’s the case any longer (at least for now) as the USD declined this week and miners declined as well. Consequently, an additional move lower in the USD Index doesn’t have to hurt the miners’ and metals’ decline (it doesn’t have to trigger a rally).
Why is a move lower in the USD possible? On the short-term basis, the situation looked favorable but it changed based on yesterday’s move lower below the rising support line (the breakdown was confirmed) and it now seems that we will see even lower USD values before it rallies again.
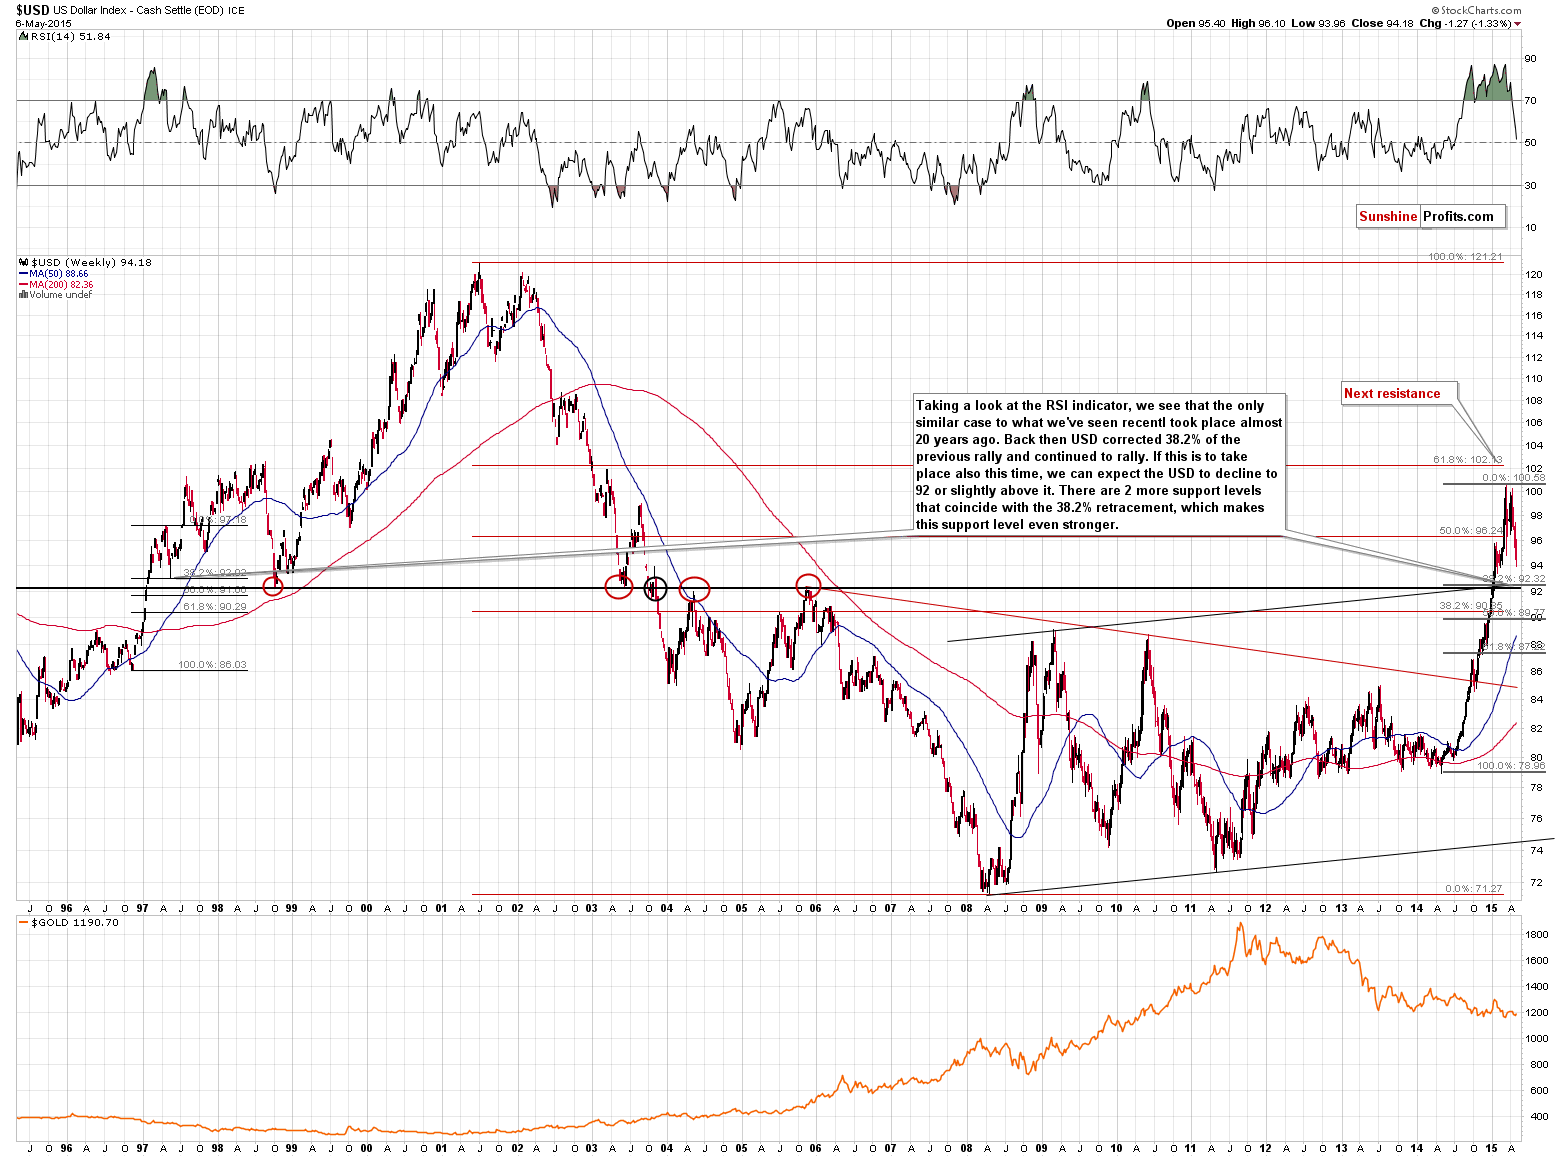
On the above chart, we see that the quite probable target for this short-term decline is at or slightly above the 92 level. Once the USD declines to this level and – probably – moves back up again, we might see an increase in the pace of the decline in the precious metals market.
Why 92? Because that level proved to be support/resistance many times in the past, because it’s the upper border of the previous rising trend channel and because that’s the 38.2% Fibonacci retracement level based on the 2014 – 2015 rally. The thing that makes this retracement particularly likely to stop the decline is the analogy to the previous similar post-rally decline. Based on the way the RSI indicator was overbought, there was only one similar case in the past 20 years to what we’re seeing now – the decline after a rally in 1997. Back then the USD corrected 38.2% of the previous upswing and rallied above the previous highs. This kind of rally is what could trigger the next major slide in precious metals and mining stocks.
Overall, since the situation didn’t really change yesterday, we can summarize today’s alert in a similar way to what we wrote previously:
Summing up, the medium-term decline is not threatened by last week’s or Monday’s temporary upswing – it seems it was simply delayed (and it seems that we may not need to wait for much longer). The outlook hasn’t changed, so the odds are that the profits that we have on the short position in the precious metals sector will become even bigger in the following weeks.
We will keep you – our subscribers – updated.
To summarize:
Trading capital (our opinion): Short (full position) position in gold, silver and mining stocks is justified from the risk/reward perspective with the following stop-loss orders and initial (!) target prices:
- Gold: initial target price: $1,115; stop-loss: $1,253, initial target price for the DGLD ETN: $87.00; stop loss for the DGLD ETN $63.78
- Silver: initial target price: $15.10; stop-loss: $17.63, initial target price for the DSLV ETN: $67.81; stop loss for DSLV ETN $44.97
- Mining stocks (price levels for the GDX ETN): initial target price: $16.63; stop-loss: $21.83, initial target price for the DUST ETN: $23.59; stop loss for the DUST ETN $10.37
In case one wants to bet on lower junior mining stocks' prices, here are the stop-loss details and initial target prices:
- GDXJ: initial target price: $21.17; stop-loss: $27.31
- JDST: initial target price: $14.35; stop-loss: $6.18
Long-term capital (our opinion): No positions
Insurance capital (our opinion): Full position
Please note that a full position doesn’t mean using all of the capital for a given trade. You will find details on our thoughts on gold portfolio structuring in the Key Insights section on our website.
As a reminder – “initial target price” means exactly that – an “initial” one, it’s not a price level at which we suggest closing positions. If this becomes the case (like it did in the previous trade) we will refer to these levels as levels of exit orders (exactly as we’ve done previously). Stop-loss levels, however, are naturally not “initial”, but something that, in our opinion, might be entered as an order.
Since it is impossible to synchronize target prices and stop-loss levels for all the ETFs and ETNs with the main markets that we provide these levels for (gold, silver and mining stocks – the GDX ETF), the stop-loss levels and target prices for other ETNs and ETF (among other: UGLD, DGLD, USLV, DSLV, NUGT, DUST, JNUG, JDST) are provided as supplementary, and not as “final”. This means that if a stop-loss or a target level is reached for any of the “additional instruments” (DGLD for instance), but not for the “main instrument” (gold in this case), we will view positions in both gold and DGLD as still open and the stop-loss for DGLD would have to be moved lower. On the other hand, if gold moves to a stop-loss level but DGLD doesn’t, then we will view both positions (in gold and DGLD) as closed. In other words, since it’s not possible to be 100% certain that each related instrument moves to a given level when the underlying instrument does, we can’t provide levels that would be binding. The levels that we do provide are our best estimate of the levels that will correspond to the levels in the underlying assets, but it will be the underlying assets that one will need to focus on regarding the sings pointing to closing a given position or keeping it open. We might adjust the levels in the “additional instruments” without adjusting the levels in the “main instruments”, which will simply mean that we have improved our estimation of these levels, not that we changed our outlook on the markets. We are already working on a tool that would update these levels on a daily basis for the most popular ETFs, ETNs and individual mining stocks.
Our preferred ways to invest in and to trade gold along with the reasoning can be found in the how to buy gold section. Additionally, our preferred ETFs and ETNs can be found in our Gold & Silver ETF Ranking.
As always, we'll keep you - our subscribers - updated should our views on the market change. We will continue to send out Gold & Silver Trading Alerts on each trading day and we will send additional Alerts whenever appropriate.
The trading position presented above is the netted version of positions based on subjective signals (opinion) from your Editor, and the Tools and Indicators.
As a reminder, Gold & Silver Trading Alerts are posted before or on each trading day (we usually post them before the opening bell, but we don't promise doing that each day). If there's anything urgent, we will send you an additional small alert before posting the main one.
=====
Latest Free Trading Alerts:
The U.S. trade deficit exploded to $51.4 billion in March. What does it mean for the economy and the gold market?
Gold News Monitor: U.S. Trade Deficit Jumps in March
=====
Hand-picked precious-metals-related links:
China One Step Closer to Becoming World’s Gold Hub
Spot gold trading shrinks as interbank deals dry up
Global silver output running low — report
Peru silver production up almost 9% this year
=====
In other news:
Wary of bond 'cliff,' Fed plans cautious cuts to portfolio
U.K. Votes in Unprecedented Election With Outcome Elusive
Greece Faces Pending Deadline as ECB Eyes Haircut Option
=====
Thank you.
Sincerely,
Przemyslaw Radomski, CFA
Founder, Editor-in-chief
Gold & Silver Trading Alerts
Forex Trading Alerts
Oil Investment Updates
Oil Trading Alerts

