

Briefly: In our opinion, a speculative short position (full) in gold, silver and mining stocks is justified from the risk/reward point of view.
Gold, silver and mining stocks plunged yesterday and this move caught many by surprise. No wonder – most analysts heralded the beginning of another big rally this week. We didn’t – we viewed this week’s rally as a temporary and rather implication-less event. We didn’t have to wait for long for the market to agree with us. What does it tell us now, after a sharp decline?
In our opinion, it tells us that the decline is not over and that quite likely its just starting. Let’s take a look at the charts, starting with gold (charts courtesy of http://stockcharts.com).
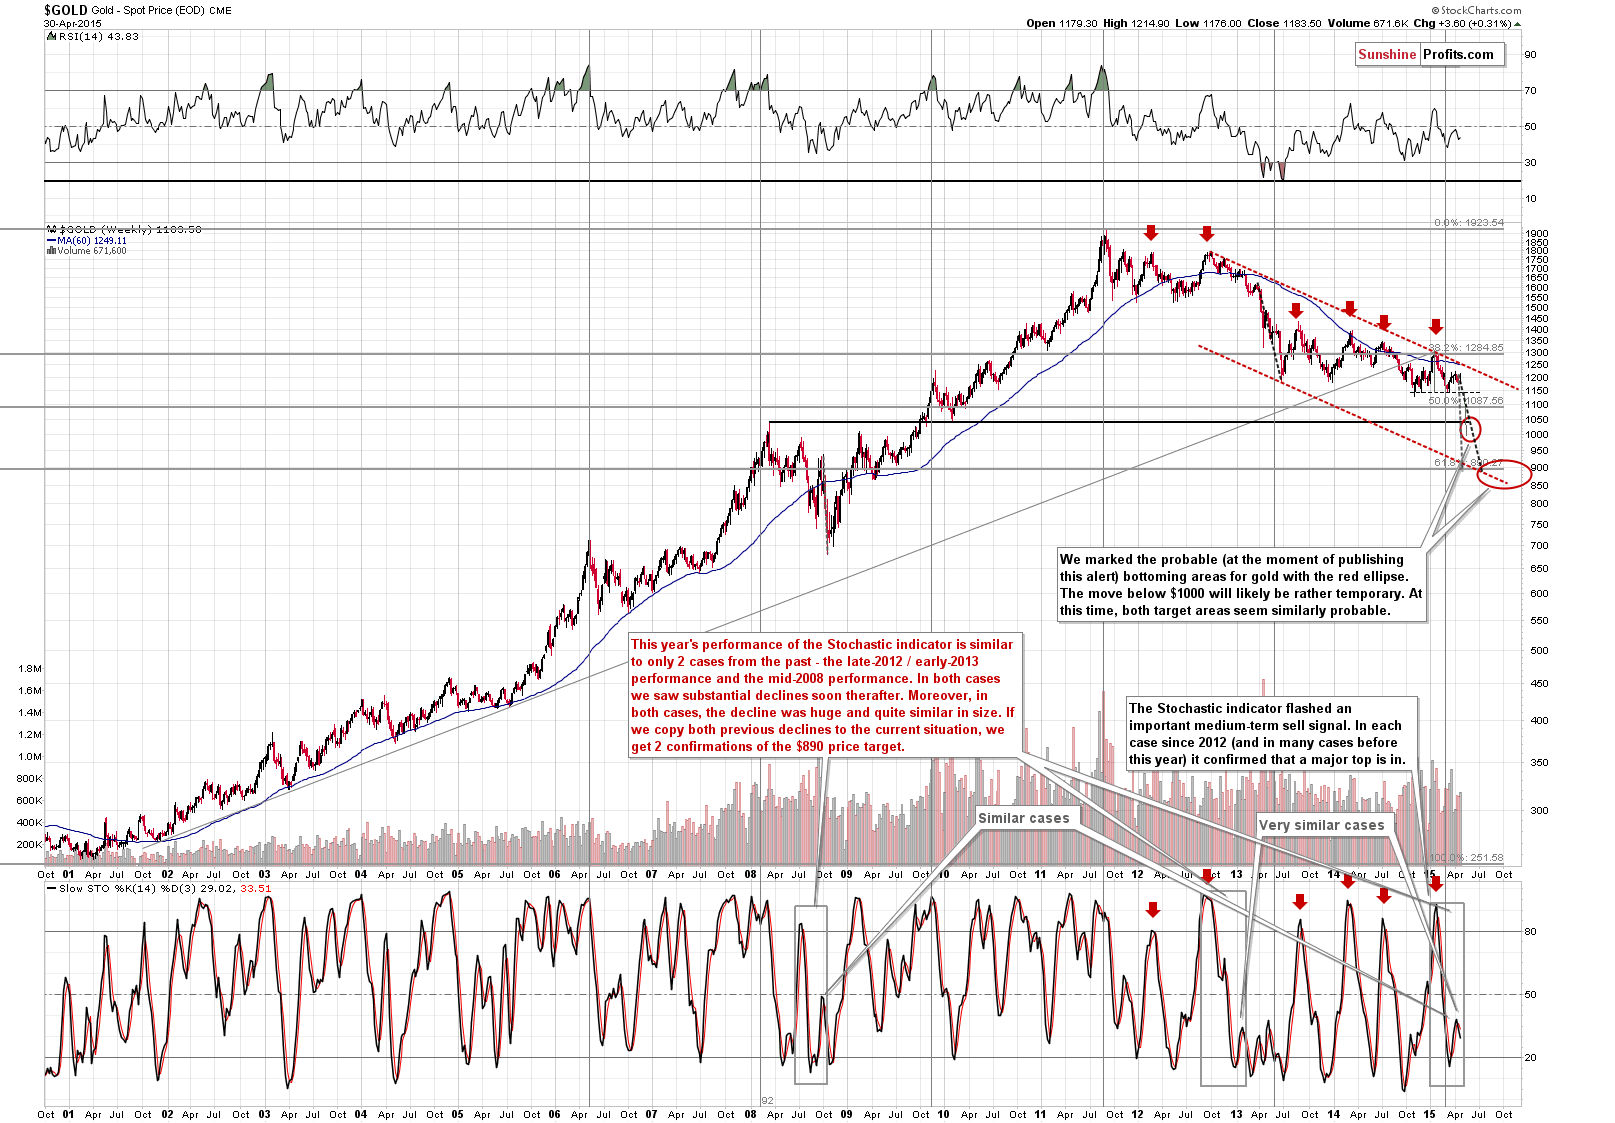
Once again, the long-term chart doesn’t show any changes, but we think it’s worth keeping in mind as it emphasizes that the medium-term trend is down.
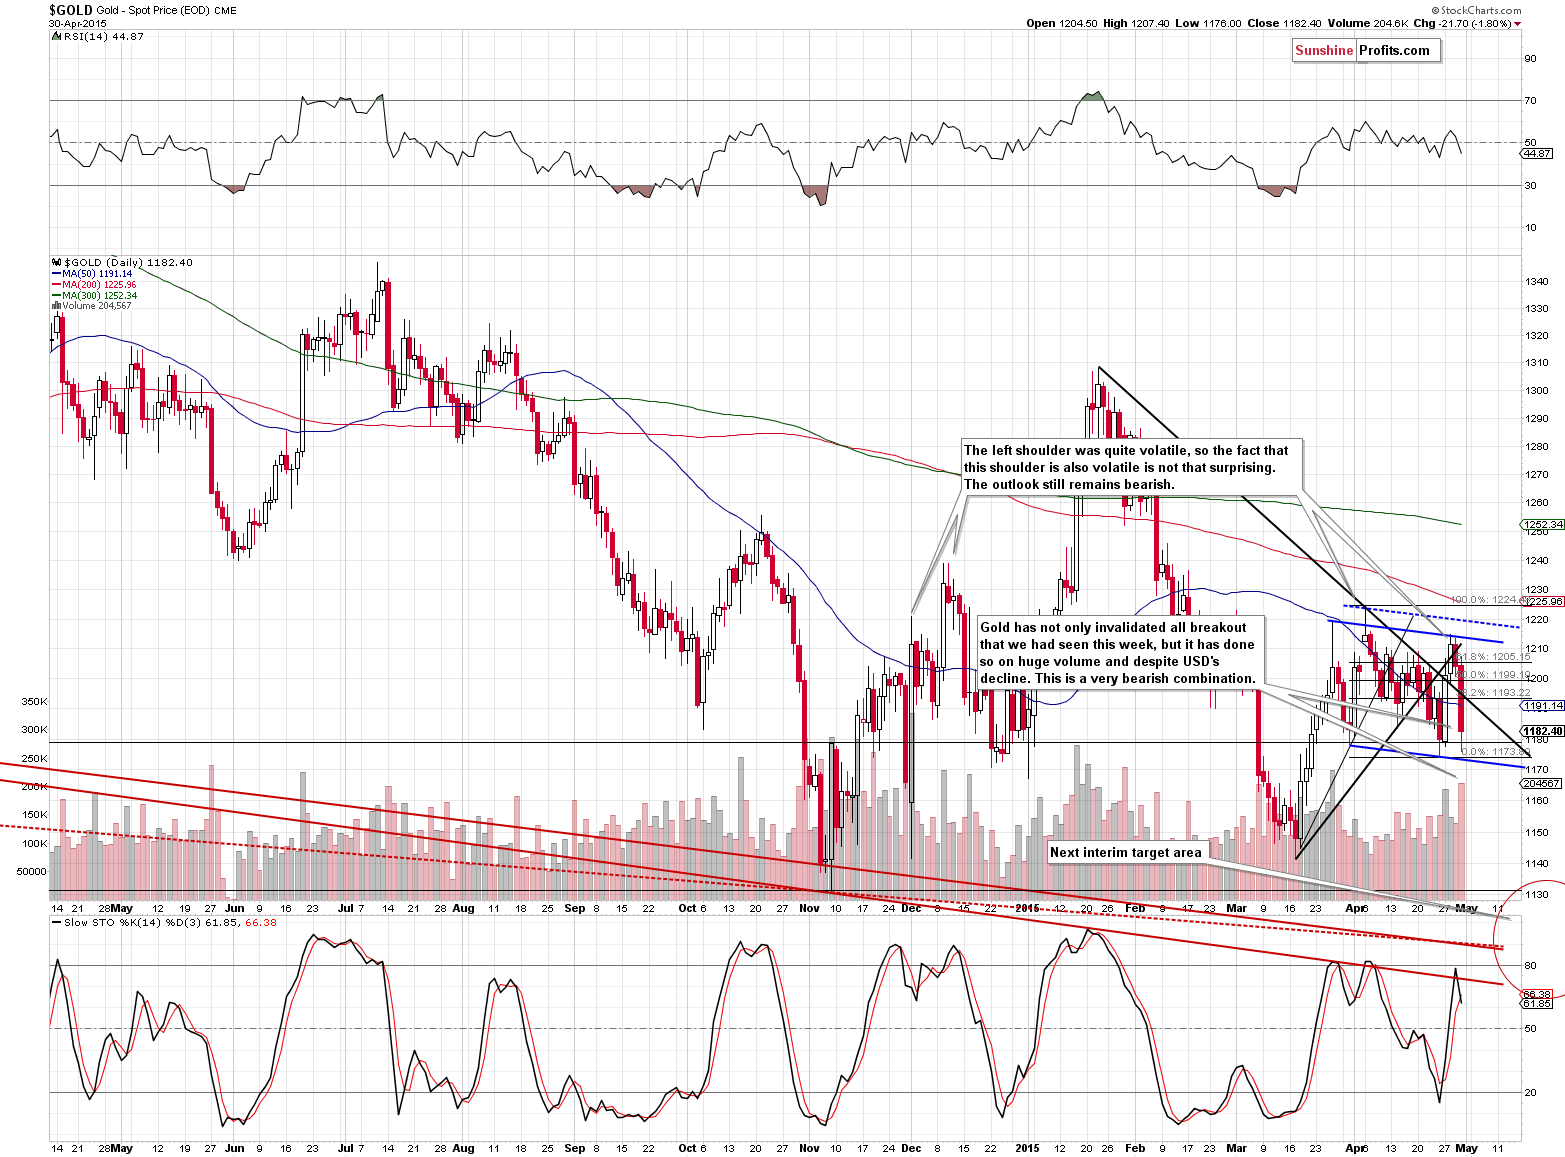
On the short-term chart we see the bearish developments as gold declined significantly on strong volume and in spite of dollar’s move higher. The combination of bearish factors is quite striking and the outlook is very bearish.
Our previous comments remain up-to-date:
The small head-and-shoulders pattern is still being formed (the right shoulder of the big head-and-shoulders pattern is a head-and-shoulders pattern on its own as well) – if this continues, we will see gold moving much lower relatively soon.
The smaller head-and-shoulders pattern is about to be completed and once it does, we are likely to see much lower prices – and then even lower prices based on the bigger head-and-shoulders pattern.
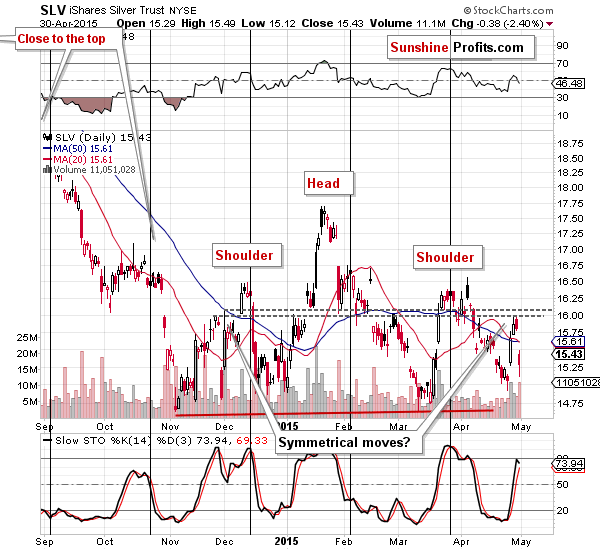
In case of silver, everything is going in tune with our expectations as well. We have been expecting the right shoulder of the pattern to be similar to the left one and this is what we are seeing right now. The implications are bearish.
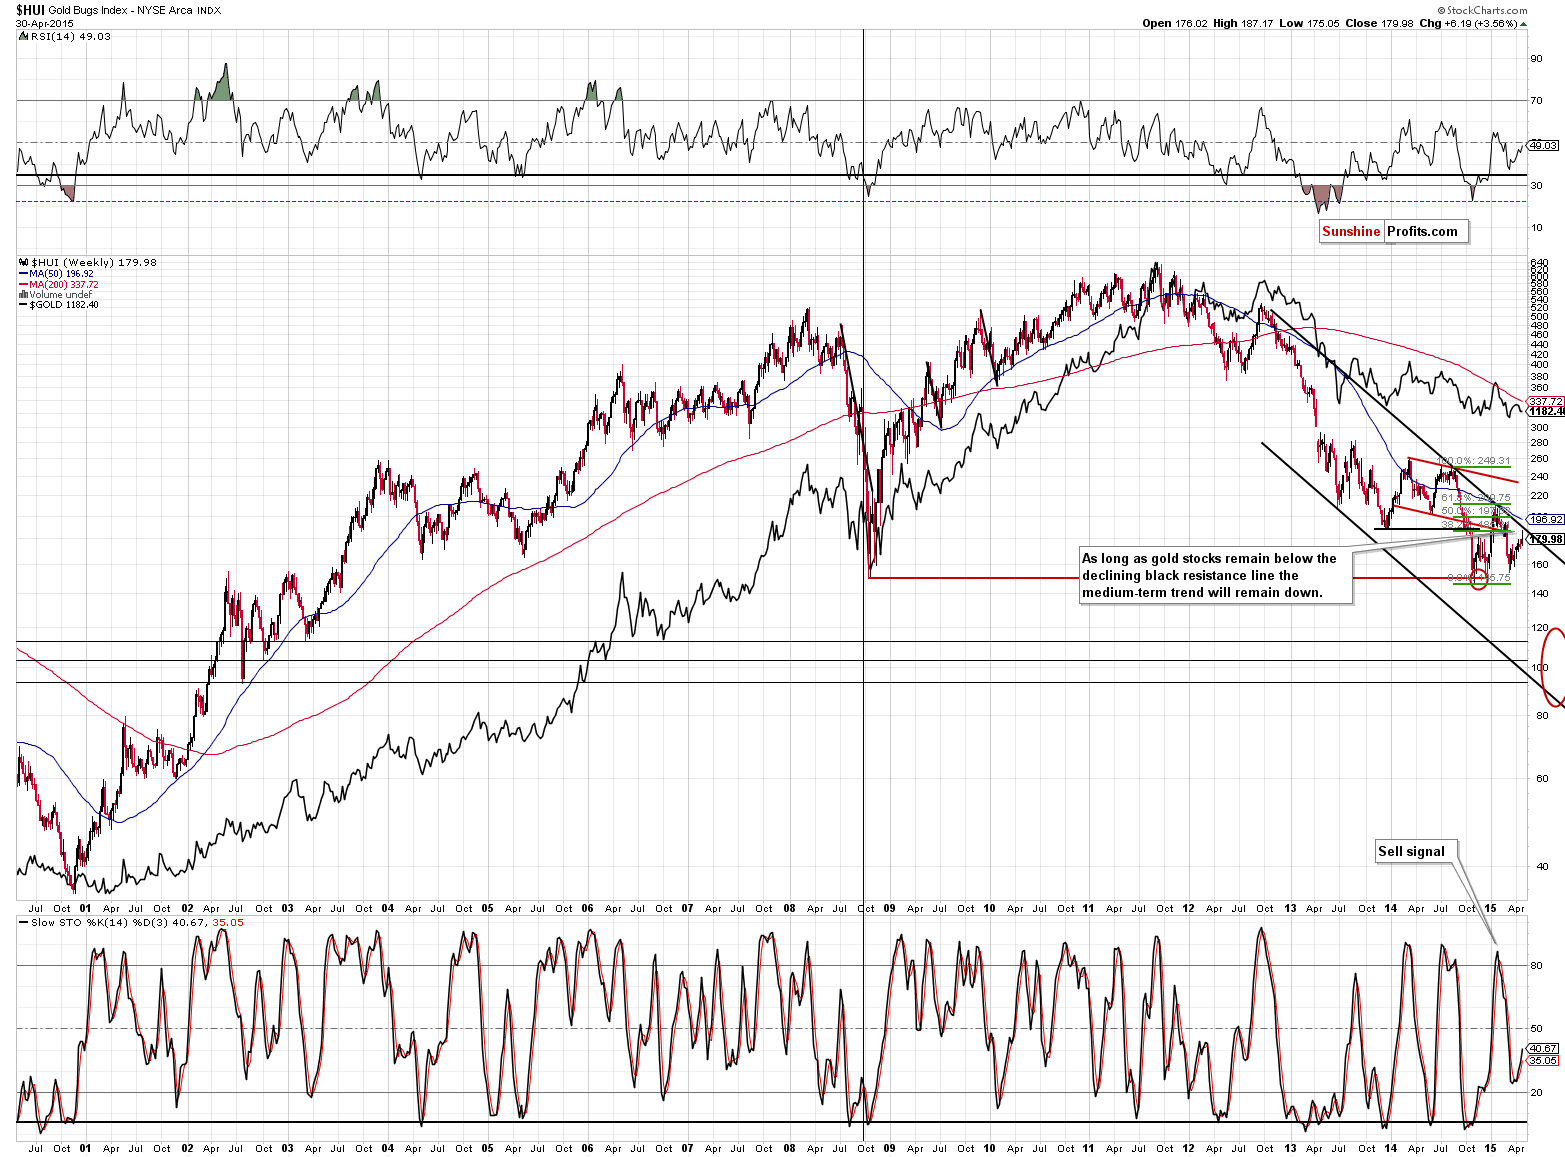
The long-term picture featuring the HUI Index didn’t change much and it remains bearish as well:
Gold stocks have a major resistance line just ahead so they are not likely to move significantly either, if at all. The declining long-term resistance line is currently at about 190, so if the rally continues, it’s not likely to move above this level. The medium-term trend remains down.
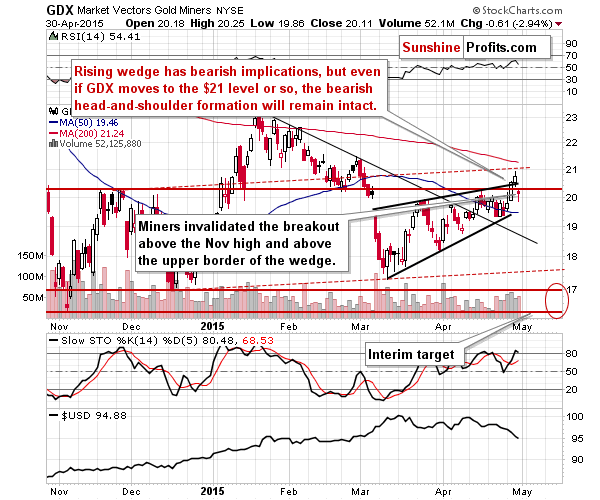
On a short-term basis, miners invalidated the move above the Nov 2014 high and above the upper border of the rising wedge. The accompanying volume was higher than what we’ve see on the previous day, so the outlook is clearly bearish.
In the previous alerts we showed you the relationship between gold stocks and other stocks continues to support the bearish outlook and it still does, but today we would like to focus on the XAU (gold and silver stocks) to gold ratio.
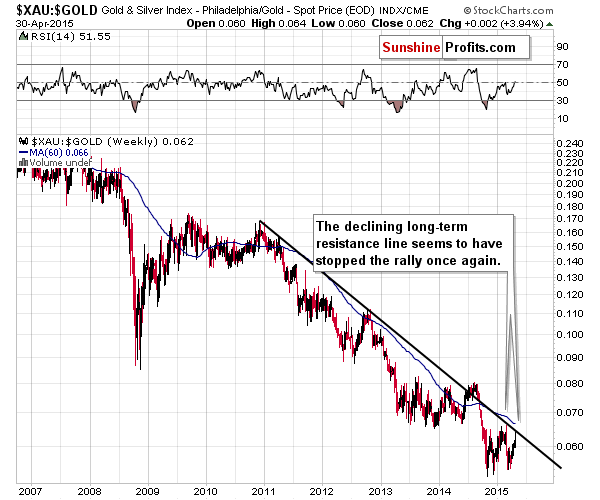
The above ratio also supports the lower values of mining stocks and gold. The ratio has just reached its declining resistance line, which suggests that miners’ outperformance is over.
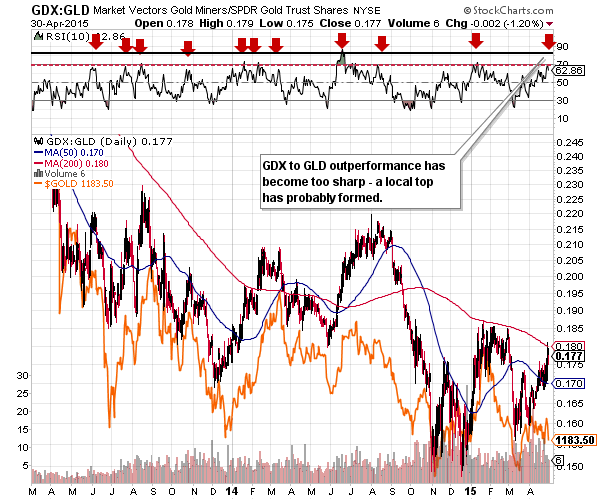
If we focus on the medium-term picture, we get the same results. In case of the GDX to GLD ratio, we can use the RSI indicator, which was very useful in timing the previous tops. It seems that the only thing that the strength in the mining stocks does is that it suggests another downswing.
In the recent alerts, we emphasized that the decline in the USD Index could be the reason (either direct or indirect as the initial cause would be bullish expectations based on the recent weak economic data) behind the strength of PMs. These comments remain up-to-date:
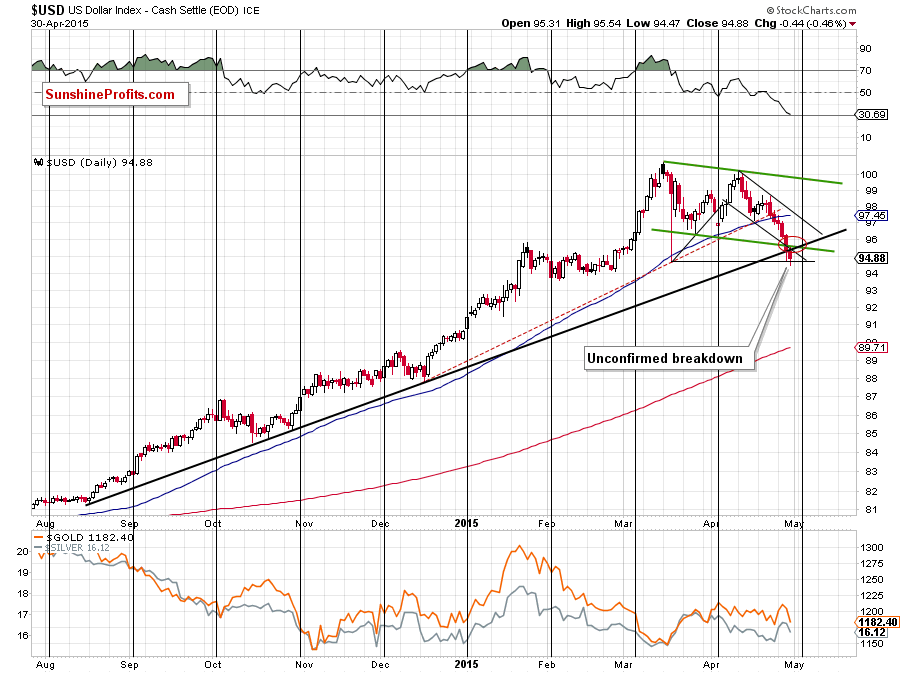
If this was the case, then we have another reason to believe that the days of this rally in PMs are numbered. The USD Index is about to reach the downside target area that is created by 3 support lines: lower borders of 2 declining trend channels and the medium-term support line. Additionally, the cyclical turning point is just around the corner, which makes a turnaround even more likely.
We even saw a move below our target area, but the breakdown is not confirmed at the moment. Consequently, the outlook for the USD Index didn’t really deteriorate for the following weeks and it improved for the short term.
Overall, since the situation is developing according to our expectations, we can summarize today’s alert in a similar way to what we wrote yesterday:
Summing up, the medium-term decline is not threatened by this week’s upswing – it seems it was simply delayed (and the USD’s reversal along with gold and silver’s decline suggests that we may not need to wait for much longer). Furthermore, please note that the precious metals sector could decline right away or move a bit higher (we have resistance levels a bit above the current prices of gold, silver and mining stocks) before the decline resumes. Because of the former scenario, we think that it’s justified from the risk/reward point of view to keep the short positions intact. We realize that temporary decreases in profits are not a pleasant thing to watch, but let’s not forget that this trade is not over and that the medium-term outlook hasn’t changed, so the odds are that the profits will become much bigger (in fact, they just became much bigger yesterday).
We will keep you – our subscribers – updated.
To summarize:
Trading capital (our opinion): Short (full position) position in gold, silver and mining stocks is justified from the risk/reward perspective with the following stop-loss orders and initial (!) target prices:
- Gold: initial target price: $1,115; stop-loss: $1,253, initial target price for the DGLD ETN: $87.00; stop loss for the DGLD ETN $63.78
- Silver: initial target price: $15.10; stop-loss: $17.63, initial target price for the DSLV ETN: $67.81; stop loss for DSLV ETN $44.97
- Mining stocks (price levels for the GDX ETN): initial target price: $16.63; stop-loss: $21.83, initial target price for the DUST ETN: $23.59; stop loss for the DUST ETN $10.37
In case one wants to bet on lower junior mining stocks' prices, here are the stop-loss details and initial target prices:
- GDXJ: initial target price: $21.17; stop-loss: $27.31
- JDST: initial target price: $14.35; stop-loss: $6.18
Long-term capital (our opinion): No positions
Insurance capital (our opinion): Full position
Please note that a full position doesn’t mean using all of the capital for a given trade. You will find details on our thoughts on gold portfolio structuring in the Key Insights section on our website.
As a reminder – “initial target price” means exactly that – an “initial” one, it’s not a price level at which we suggest closing positions. If this becomes the case (like it did in the previous trade) we will refer to these levels as levels of exit orders (exactly as we’ve done previously). Stop-loss levels, however, are naturally not “initial”, but something that, in our opinion, might be entered as an order.
Since it is impossible to synchronize target prices and stop-loss levels for all the ETFs and ETNs with the main markets that we provide these levels for (gold, silver and mining stocks – the GDX ETF), the stop-loss levels and target prices for other ETNs and ETF (among other: UGLD, DGLD, USLV, DSLV, NUGT, DUST, JNUG, JDST) are provided as supplementary, and not as “final”. This means that if a stop-loss or a target level is reached for any of the “additional instruments” (DGLD for instance), but not for the “main instrument” (gold in this case), we will view positions in both gold and DGLD as still open and the stop-loss for DGLD would have to be moved lower. On the other hand, if gold moves to a stop-loss level but DGLD doesn’t, then we will view both positions (in gold and DGLD) as closed. In other words, since it’s not possible to be 100% certain that each related instrument moves to a given level when the underlying instrument does, we can’t provide levels that would be binding. The levels that we do provide are our best estimate of the levels that will correspond to the levels in the underlying assets, but it will be the underlying assets that one will need to focus on regarding the sings pointing to closing a given position or keeping it open. We might adjust the levels in the “additional instruments” without adjusting the levels in the “main instruments”, which will simply mean that we have improved our estimation of these levels, not that we changed our outlook on the markets. We are already working on a tool that would update these levels on a daily basis for the most popular ETFs, ETNs and individual mining stocks.
Our preferred ways to invest in and to trade gold along with the reasoning can be found in the how to buy gold section. Additionally, our preferred ETFs and ETNs can be found in our Gold & Silver ETF Ranking.
As always, we'll keep you - our subscribers - updated should our views on the market change. We will continue to send out Gold & Silver Trading Alerts on each trading day and we will send additional Alerts whenever appropriate.
The trading position presented above is the netted version of positions based on subjective signals (opinion) from your Editor, and the Tools and Indicators.
As a reminder, Gold & Silver Trading Alerts are posted before or on each trading day (we usually post them before the opening bell, but we don't promise doing that each day). If there's anything urgent, we will send you an additional small alert before posting the main one.
=====
Latest Free Trading Alerts:
S&P 500 index extends its fluctuations along the level of 2,100. Is this a topping consolidation or just a flat correction within an uptrend?
Stock Trading Alert: Stocks Extended Their Fluctuations - Correction Ahead?
The relatively hawkish stance of the Fed’s monetary policy (compared to other major central banks) may cause the U.S. dollar to rally. What are the consequences of the possible next bull in the greenback for the global economy and the gold market?
What Does The Strong U.S. Dollar Mean For The Economy?
=====
Hand-picked precious-metals-related links:
U.S. Mint Eagle gold coin sales slide 37 pct in April
Here is why Venezuela traded 1.4 million ounces of its gold reserves to Citi
CME Group suspends two gold futures traders for allegedly spoofing
Silver set for longest slump in 24 years – CPM
=====
In other news:
Europe’s Debt Erases $160 Billion on Path to Record Weekly Loss
Does Draghi have a case for pursuing further QE?
UK election: Why the world is watching
China April official PMI shows factories struggling to grow
Greek Default for Dummies: Your Questions Answered on Creditors
=====
Thank you.
Sincerely,
Przemyslaw Radomski, CFA
Founder, Editor-in-chief
Gold & Silver Trading Alerts
Forex Trading Alerts
Oil Investment Updates
Oil Trading Alerts

