

Briefly: In our opinion speculative short positions (full) in gold, silver and mining stocks are justified from the risk/reward perspective. We are adjusting the stop-loss levels, though, so in a way we are locking-in part of the profits from the current position and, at the same time, keeping a chance of increasing them.
Gold was likely to decline based, i.a., on the major sell signals from the Stochastic indicator and it did. The size of the slide (gold declined $50 last week) and the corresponding volume were significant and the question is if this kind of decline confirms the bearish outlook and suggests further declines, or is the move over.
In short, our Friday’s second alert remains up-to-date. It was not long, so we think it’s worth to quote it before we proceed with the analysis of charts.
Gold plunged today and since it’s already about $70 lower than when we opened short positions (based on the Jan 22 closing prices), you might be wondering if it’s a good idea to close the short position and take profits off the table.
We agree that it is tempting, but - as always - it’s the outlook that determines whether a certain position is justified or not and not the status of the current position. The fact that at this time we have significant profits on the short position doesn’t mean that they can’t get any bigger - and at this time this seems to be the situation.
The trading week will be over in just a few hours and it is highly unlikely that we’ll see significant strength in the precious metals sector. This means that the major sell signals from the Stochastic indicator in gold and the HUI Index based on the weekly prices will be confirmed. This is something that will make the outlook more bearish - not less. Some traders will likely open short positions now - based on the above-mentioned signals - and help to push the prices even lower. We will update our initial target levels in Monday’s alert.
You might also be wondering what are our thoughts on the long-term investment capital. We think that it’s best to have the weekly closing prices and weekly volume levels before we can really tell if anything changed. Consequently, we think that it will be best to analyze the situation over the weekend and provide you with the outcome of the analysis in Monday’s alert. For now, we don’t think that any adjustments need to be made.
Summing up, it seems that from the risk/reward perspective it’s best to let the profits grow even more and keep the short positions intact.
So, the questions that we will answer today are if the short-term outlook changed and if the medium-term outlook changed significantly (only a particularly bearish situation means that being completely out of the precious metals market with the long-term investment capital is justified – you will find a justification of this approach in our gold portfolio report and the report on position sizing – we encourage you to read both of them if you haven’t had the chance to read them before).
Let’s take a look at the charts (charts courtesy of http://stockcharts.com).
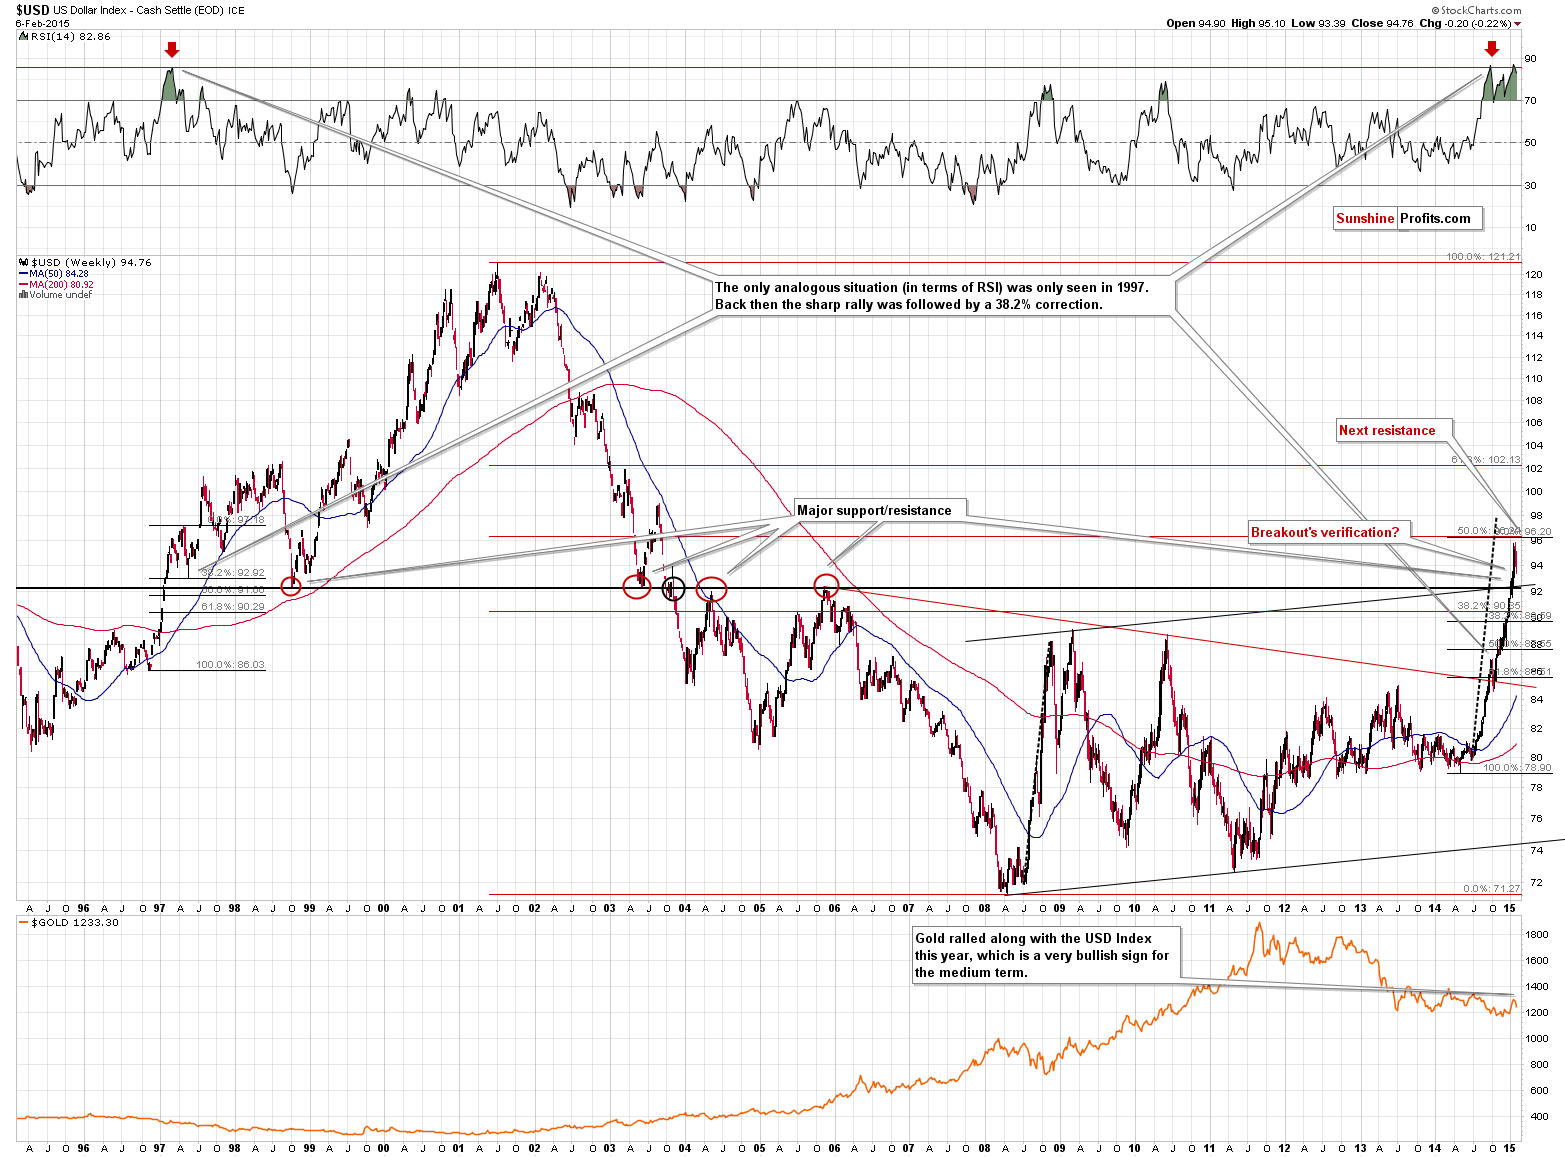
The USD Index moved back up on Friday, but it’s not certain if the decline is already over. In fact, since the major support level was not reached, the odds are the USD Index moves lower once again in the coming days. Friday’s upswing was strong, but it was an employment-numbers-based move up, not necessarily one that was caused by a change in the attitude of market participants. Consequently, it seems that this was a one-time event within a short-term decline. The situation here is a bit unclear, though.
The “best” (in terms of making the situation clearer for the precious metals sector) thing here is that gold declined significantly along with a move higher in the USD Index. Gold had previously moved in tune with the U.S. dollar, as it was driven by the weakness in the euro. It seems that all the strength that gold got previously was because of the declining value of the euro. The situation is now unwinding – the euro moved higher and gold declined. That’s the short-term trend at this time. However, Friday’s action showed that gold can once again slide on higher values of the USD.
Consequently, whether the USD Index declines in the coming days or not, we could still see gold lower.
If the decline in gold was only euro-driven, we could think that a bottom in the USD Index at the strong, long-term support (92.3 or so) would also mean a bottom in gold, but based on Friday’s action, we see that gold could decline regardless of the USD’s bottom. This is a bearish factor for the coming weeks.
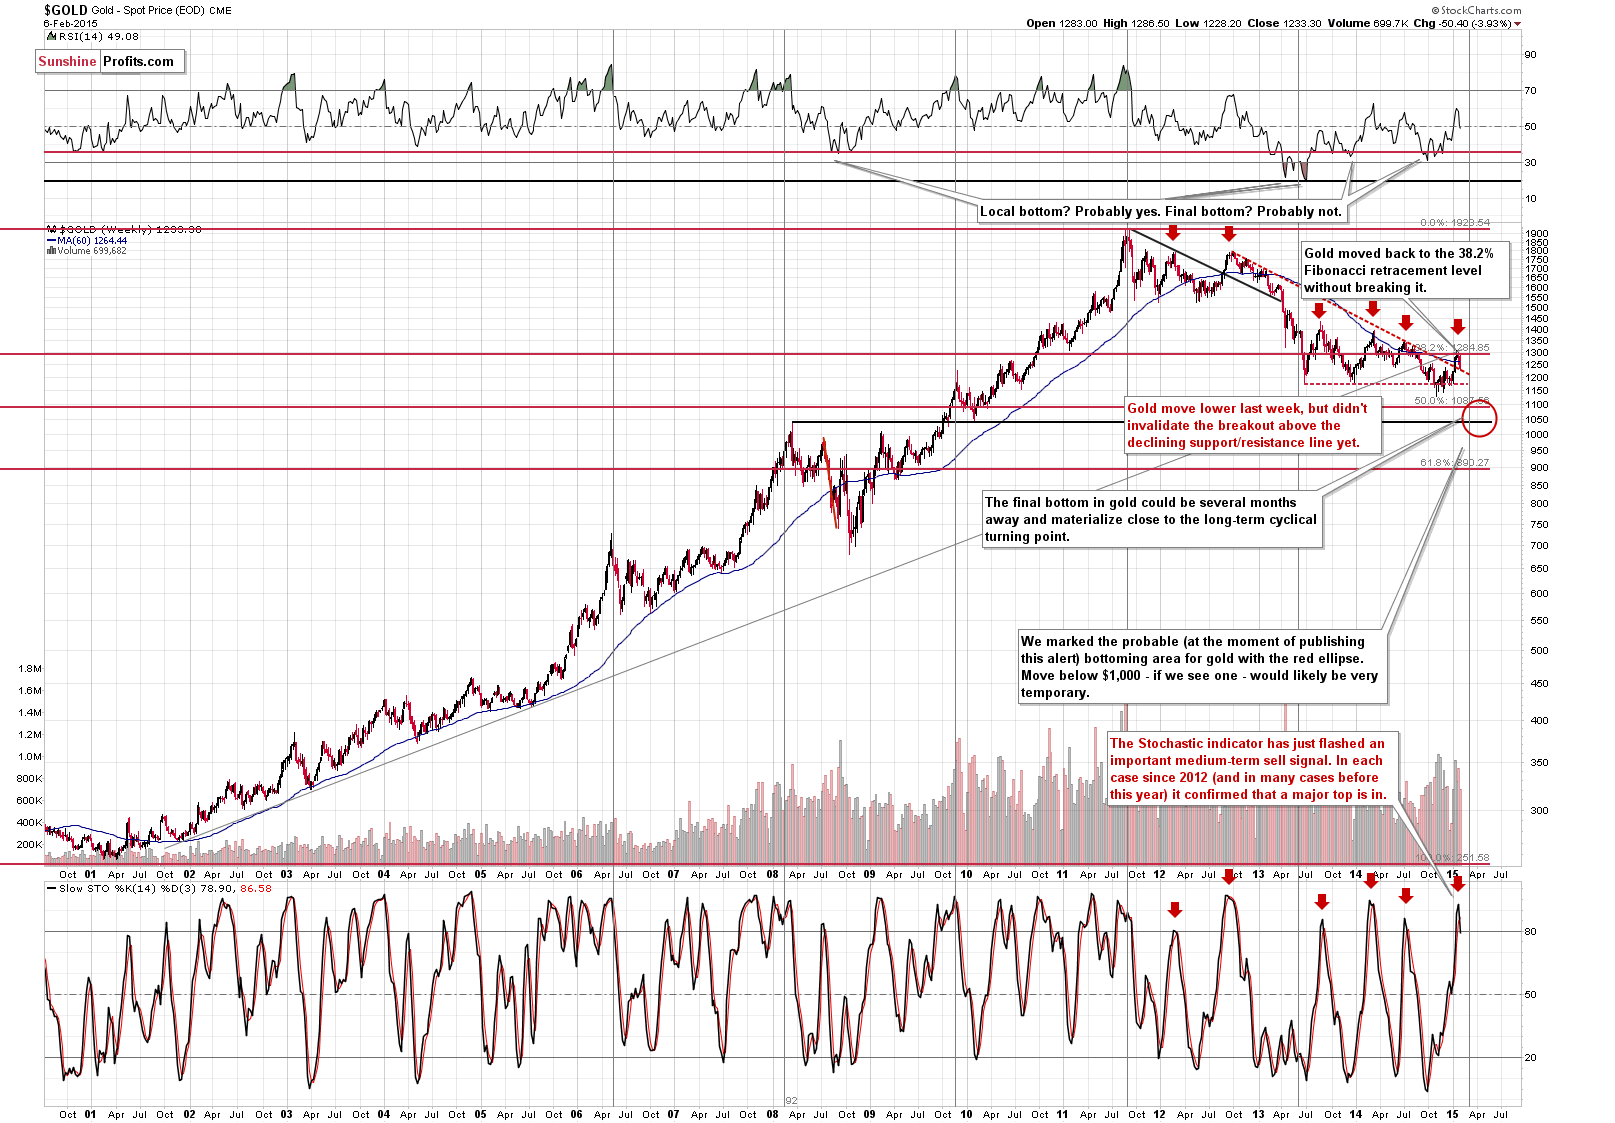
The long-term gold chart shows several interesting things. One of them is that there was a clear sell signal from the Stochastic indicator. We entitled Tuesday’s alert “Major Signal”, and we referred to this particular signal. We wrote the following:
The Stochastic indicator just flashed a sell signal. That doesn’t seem to be a big deal until you consider what has happened each time since 2012 when we saw this signal. We saw major tops. All of them, actually. So, has gold formed a top recently? As always, there are no sure bets in any market, but “this time is different” is often a quite costly phrase, especially given a high efficiency of a given technique (like in this case). The indicator is based on weekly closing prices, so the signal will be fully confirmed after Friday’s close, but gold would have to move much higher in order for the Stochastic indicator not to flash the sell signal and the resistance is very close.
Moreover, please note that the last 2 major tops were formed after gold moved a bit above the 60-week moving average. This is exactly what happened recently – gold moved above this level.
Gold moved below the 60-week moving average, which serves as a bearish confirmation here.
However, there is also one bullish factor and one that is rather neutral. Beginning with the latter, there is no confirmation from the volume. Gold declined significantly last week, but the volume was not bigger than what we had seen in the previous weeks. The (somewhat) bullish factor is that gold stopped its decline at the previously broken declining resistance/support line (red, dashed line). Consequently:
- We could see a corrective upswing from here, even though it seems that the next big move will be to the downside.
- The medium-term outlook didn’t deteriorate very significantly.
While the first point seems rather inconsequential (the corrective upswing can be very small or nonexistent), the second point is important for the long-term investment capital. Without a visible move back below the above-mentioned line the situation will not become extremely bearish again. At this time it could (it’s not likely, but still) be the case that the decline that we saw is a post-breakout verification. Once the breakout is invalidated, the above possibility will become very unlikely. Consequently, we may (after considering other factors as well) suggest exiting the precious metals market with the long-term capital at that time, but it’s too early for just now.
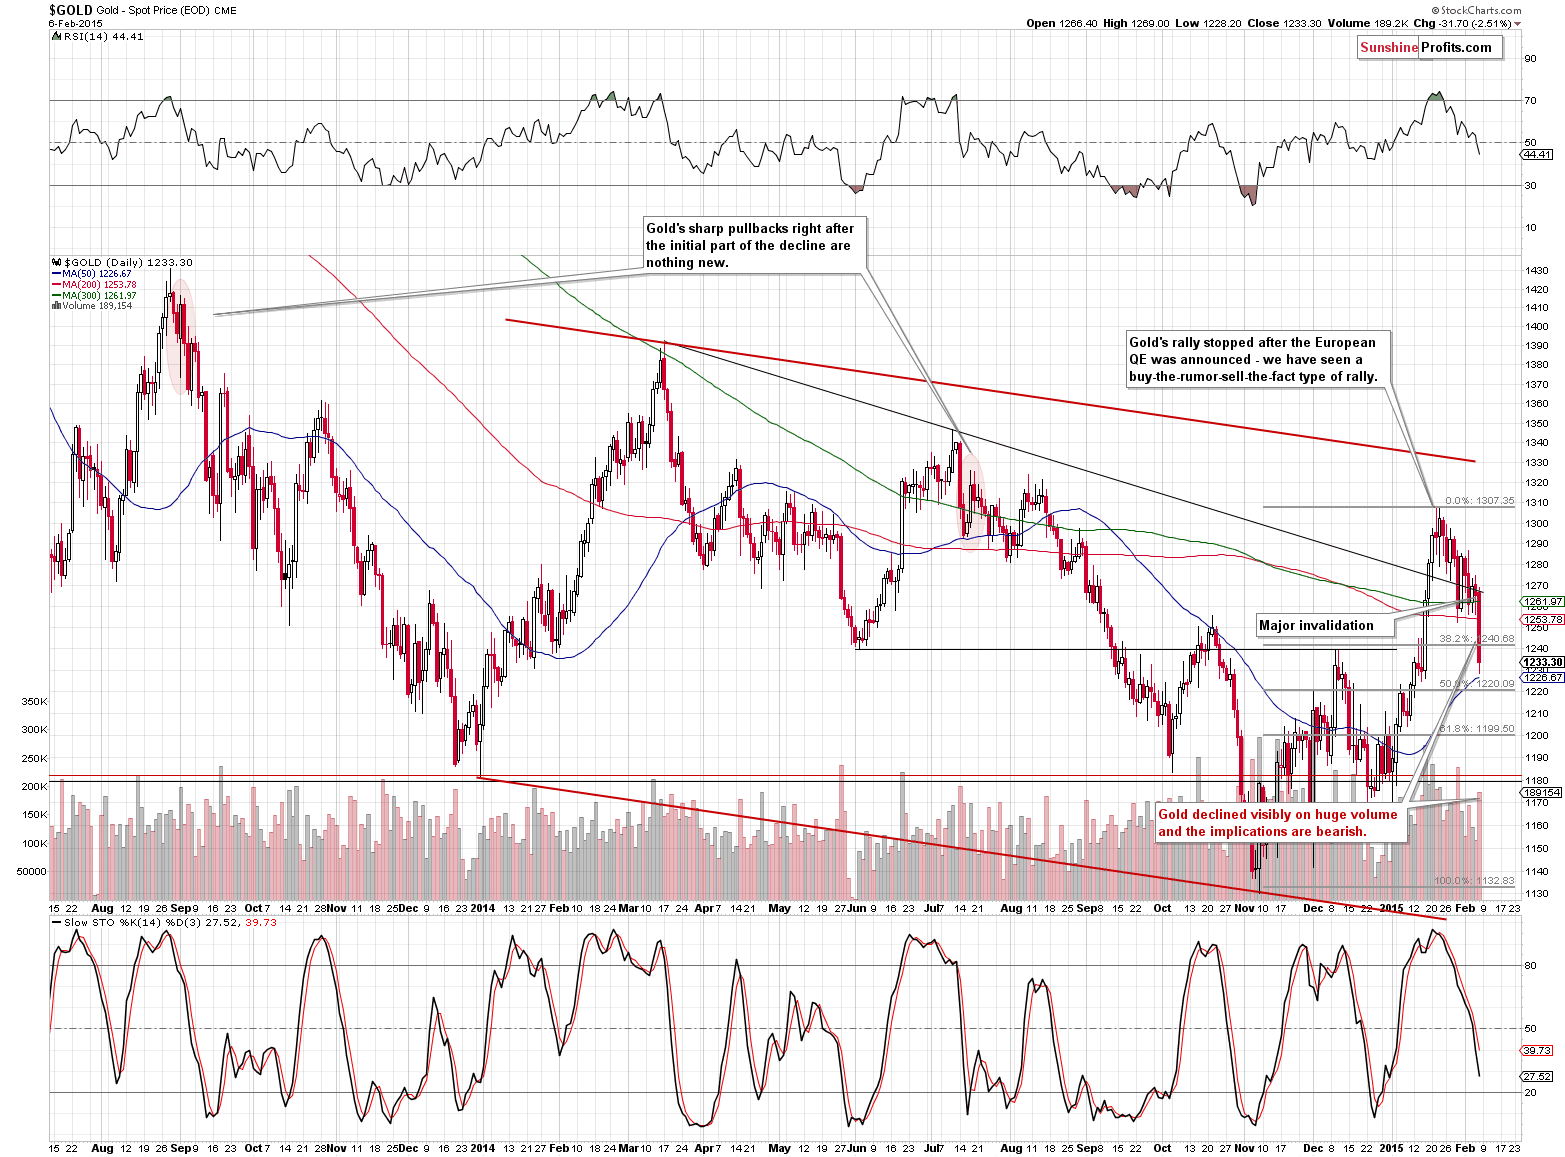
From the short-term point of view, we see that gold invalidated the previous breakout above the medium-term declining resistance line. This is a bearish sign. Still, please note that gold erased less than half of the previous rally – we would like to see a move below the 61.8% retracement before saying that further declines have become extremely likely. For now they are very likely anyway, especially that Friday’s decline materialized on high volume.
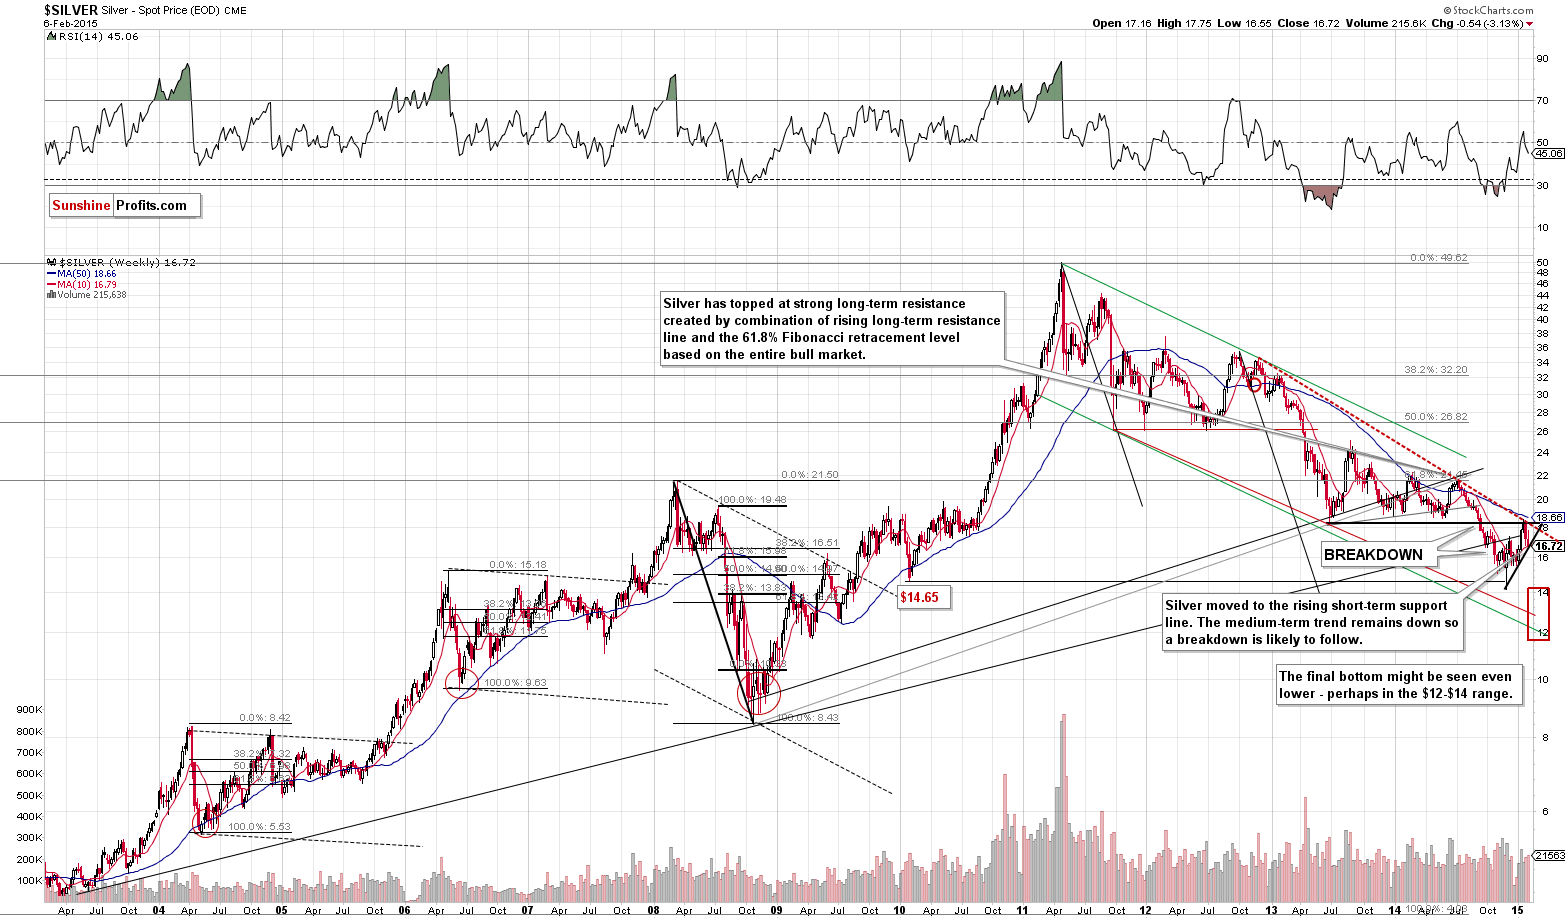
The long-term silver chart provides us with implications that are similar to those provided by the long-term chart of gold. Silver remains in a downtrend but encountered a support. In the case of the white metal, the support line is of short-term nature, which makes it less significant. Still, we could see a short-term bounce before the slide continues.
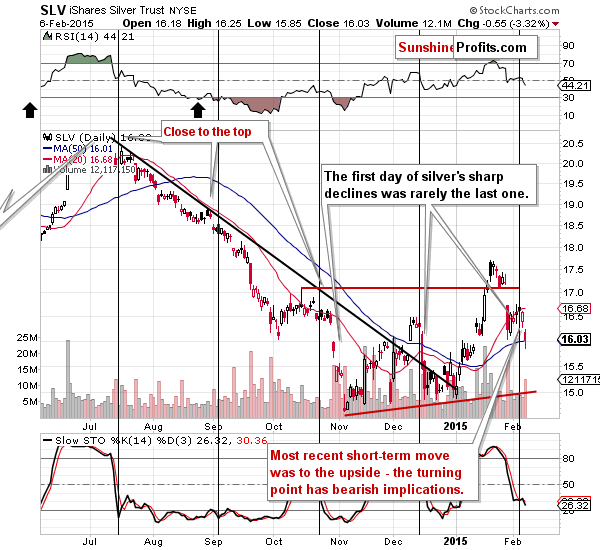
On the short-term chart, we see that silver declined right after the turning point – just like it did in all cases that you can see on the above chart. Right after silver’s daily slide on Jan. 29, we wrote the following:
(…) Please note that in the past, when silver started to suddenly plunge (the pace of the decline increased dramatically) it was usually not a single-day decline. In the recent past we had 2 similar cases. In the first one (late October 2014) after the first day silver still had most of the decline ahead of it, and in the second case (mid-December 2014), silver declined more or less half in the first day.
Silver is still likely to decline more, especially that it moved below the previous local low.
In Friday’s first alert we wrote the following:
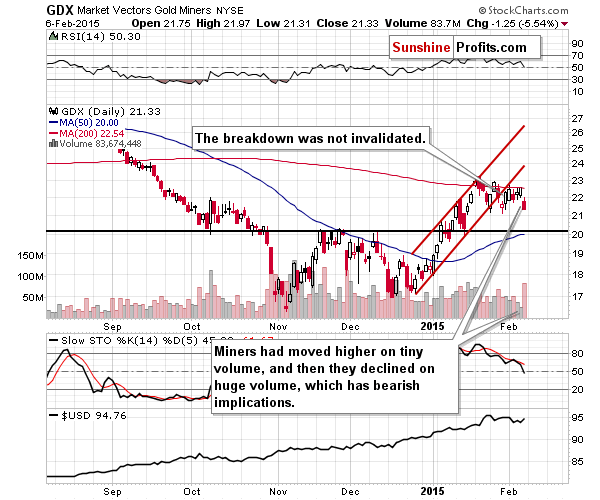
This bearish price/volume pattern continues – on Thursday we saw miners move higher (1.39%), but once again the volume was lower – to say the least. It was very small and this suggests that this was not the true move – the direction in which the market moved was not the true one. Even though miners moved higher, it seems that we can view yesterday’s session as a bearish confirmation.
Miners declined on huge volume on Friday, which is another confirmation that mining stocks are now declining and daily upswings are simply corrections. Miners haven’t declined as much as gold has yet, but it seems there is a good reason for it – strength in main stock indices. Miners were likely impacted positively, but are likely to catch up with gold if the latter continues to decline in the following days / weeks and since this is the likely outcome, the outlook for mining stocks is bearish as well.
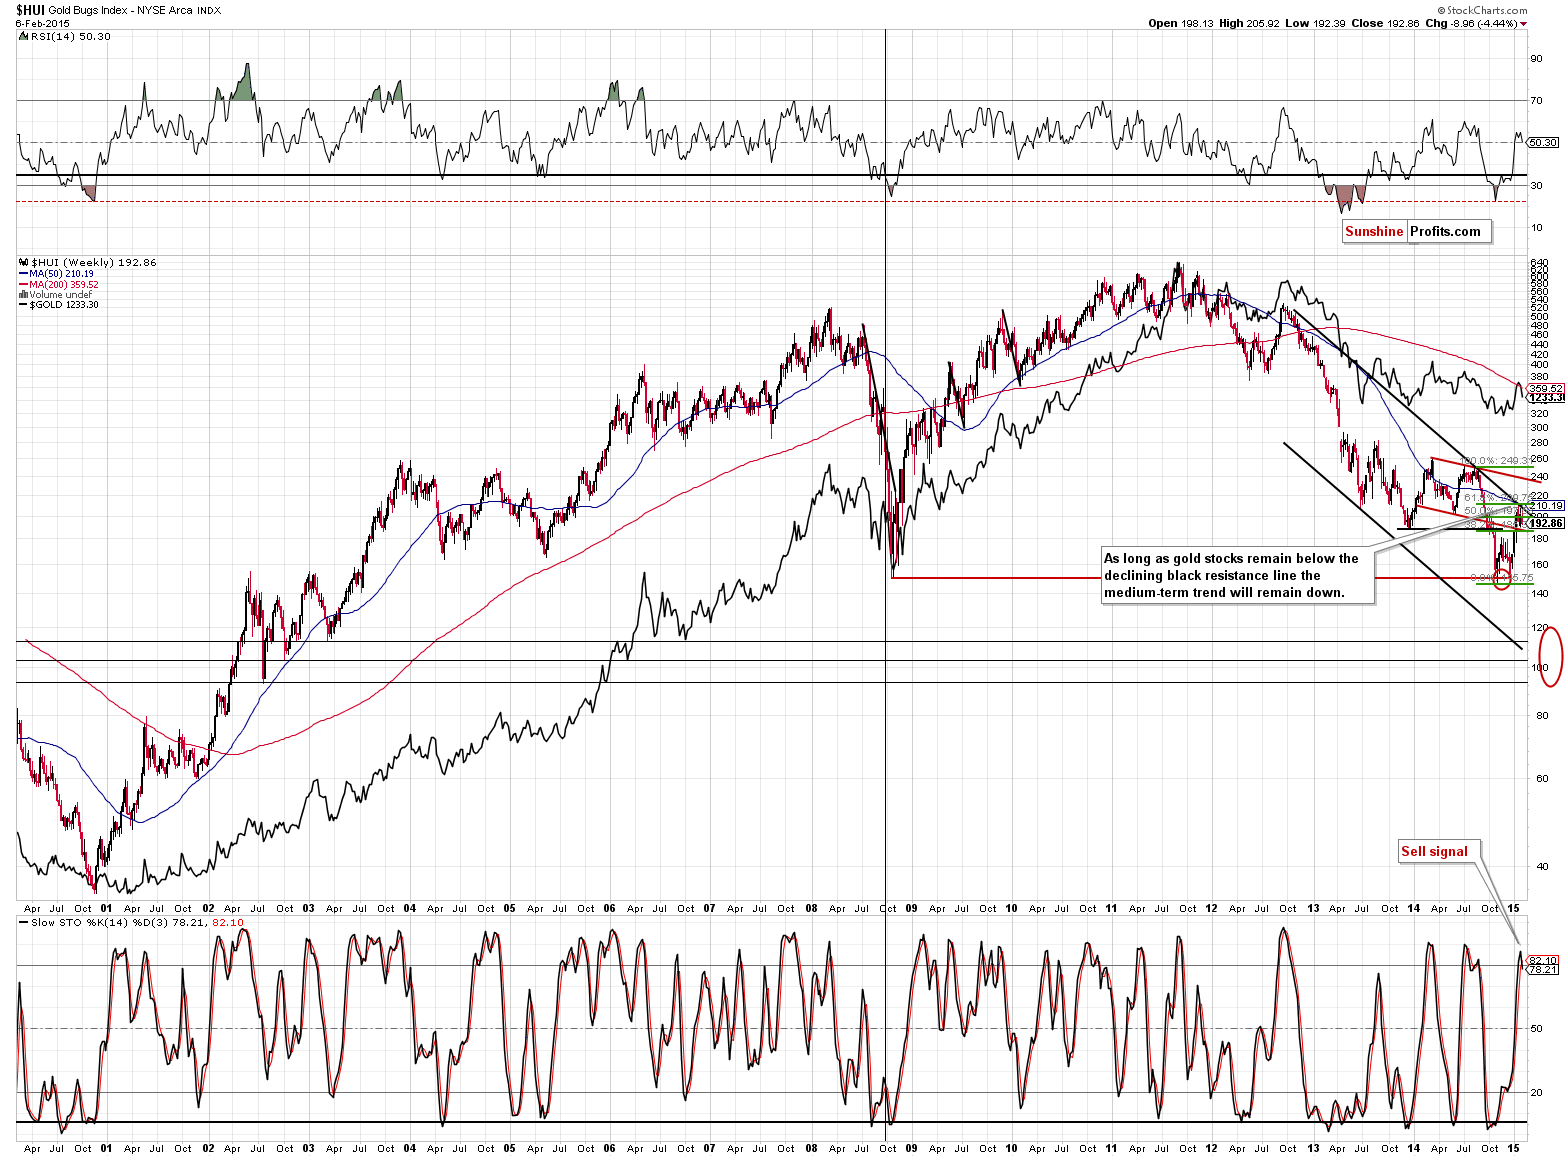
The sell signal from the Stochastic indicator in the HUI Index confirms the bearish outlook. On Feb 4th, in the alert entitled “Major Signal’s Confirmation” we wrote the following about the above signal:
Yesterday, we wrote that the HUI Index was practically at the declining resistance line, which means that it was quite likely to decline from there. It has – the decline is not huge yet, but it’s once again a few index points below the declining resistance line. The important thing is that we have just seen a sell signal from the Stochastic indicator, which serves as a bearish confirmation of the same signal that we have recently seen in gold.
The signal itself was confirmed when we got the weekly closing prices – the sell signal was even stronger. The implications are bearish.
Summing up, quite a lot happened on Friday, but not that much changed as far as the outlook is concerned. The medium-term trend most likely remains down, but there is still a possibility that the recent $70 (or so) decline in gold is a verification of the previous breakout. Consequently, we are not adjusting the long-term investment capital – we are keeping half (and only half) of it in the precious metals sector. In speculative terms, it seems that the profits on the current short positions will become even bigger, so we’re keeping them intact.
We are adjusting the stop-loss levels, though, so in a way we are locking-in part of the profits from the current position and, at the same time, keeping a chance of increasing them.
As always, we’ll keep you – our subscribers – informed.
To summarize:
Trading capital (our opinion): Short positions (full) in gold, silver and mining stocks with the following stop-loss orders and initial (!) target prices:
- Gold: initial target level: $1,180; stop-loss: $1,283, initial target level for the DGLD ETN: $75.23; stop loss for the DGLD ETN $58.55
- Silver: initial target level: $15.70 ; stop-loss: $17.93, initial target level for the DSLV ETN: $66.25 ; stop loss for DSLV ETN $43.84
- Mining stocks (price levels for the GDX ETN): initial target level: $18.40 ; stop-loss: $23.57, initial target level for the DUST ETN: $18.99 ; stop loss for the DUST ETN $9.21
In case one wants to bet on lower junior mining stocks' prices, here are the stop-loss details and initial target prices:
- GDXJ: initial target level: $23.37; stop-loss: $28.87
- JDST: initial target level: $12.30 ; stop-loss: $6.73
Long-term capital (our opinion): Half positions in gold, half positions in silver, half position in platinum and half position in mining stocks.
Insurance capital (our opinion): Full position
Please note that a full position doesn’t mean using all of the capital for a given trade. You will find details on our thoughts on gold portfolio structuring in the Key Insights section on our website.
As a reminder – “initial target price” means exactly that – an “initial” one, it’s not a price level at which we suggest closing positions. If this becomes the case (like it did in the previous trade) we will refer to these levels as levels of exit orders (exactly as we’ve done previously). Stop-loss levels, however, are naturally not “initial”, but something that, in our opinion, might be entered as an order.
Since it is impossible to synchronize target prices and stop-loss levels for all the ETFs and ETNs with the main markets that we provide these levels for (gold, silver and mining stocks – the GDX ETF), the stop-loss levels and target prices for other ETNs and ETF (among other: UGLD, DGLD, USLV, DSLV, NUGT, DUST, JNUG, JDST) are provided as supplementary, and not as “final”. This means that if a stop-loss or a target level is reached for any of the “additional instruments” (DGLD for instance), but not for the “main instrument” (gold in this case), we will view positions in both gold and DGLD as still open and the stop-loss for DGLD would have to be moved lower. On the other hand, if gold moves to a stop-loss level but DGLD doesn’t, then we will view both positions (in gold and DGLD) as closed. In other words, since it’s not possible to be 100% certain that each related instrument moves to a given level when the underlying instrument does, we can’t provide levels that would be binding. The levels that we do provide are our best estimate of the levels that will correspond to the levels in the underlying assets, but it will be the underlying assets that one will need to focus on regarding the sings pointing to closing a given position or keeping it open. We might adjust the levels in the “additional instruments” without adjusting the levels in the “main instruments”, which will simply mean that we have improved our estimation of these levels, not that we changed our outlook on the markets. We are already working on a tool that would update these levels on a daily basis for the most popular ETFs, ETNs and individual mining stocks.
Our preferred ways to invest in and to trade gold along with the reasoning can be found in the how to buy gold section. Additionally, our preferred ETFs and ETNs can be found in our Gold & Silver ETF Ranking.
As always, we'll keep you - our subscribers - updated should our views on the market change. We will continue to send out Gold & Silver Trading Alerts on each trading day and we will send additional Alerts whenever appropriate.
The trading position presented above is the netted version of positions based on subjective signals (opinion) from your Editor, and the automated tools (SP Indicators and the upcoming self-similarity-based tool).
As a reminder, Gold & Silver Trading Alerts are posted before or on each trading day (we usually post them before the opening bell, but we don't promise doing that each day). If there's anything urgent, we will send you an additional small alert before posting the main one.
=====
Latest Free Trading Alerts:
S&P 500 index got closer to last year's highs, before closing slightly lower on Friday. Will uptrend continue?
Stock Trading Alert: Stocks Extend Their Medium-Term Fluctuations, No Clear Direction Yet
We saw a little bit more depreciation yesterday but the move in and of itself is not a signal that a new decline has started. At least not yet. Was there any change in the short-term outlook?
Bitcoin Trading Alert: Bitcoin Edging Closer to $200
=====
Hand-picked precious-metals-related links:
China’s SGE January gold withdrawals record 255 tonnes
36% of Swiss gold exports to China went direct to mainland
How Much Gold Is China Hoarding?
Gold price slump hits Randgold profit
Sibanye Gold FY earnings to drop on writedowns
Harmony Gold posts loss as biggest mine drags down production
Amplats sees platinum deficit boosting prices
Dubai gold-jewelry demand picking up after slow start
=====
In other news:
Defiant Greek PM sets up EU clash with bailout rejection, austerity rollback
Italy Lenders Seen Cleansing Books Amid Bad-Bank Plans
=====
Thank you.
Sincerely,
Przemyslaw Radomski, CFA
Founder, Editor-in-chief
Gold & Silver Trading Alerts
Forex Trading Alerts
Oil Investment Updates
Oil Trading Alerts

