

Briefly: In our opinion speculative short positions (half) are currently justified from the risk/reward perspective.
And so it happened. Finally, the European version of the Quantitative Easing program is here. What happened to gold? It moved higher. Sounds normal, until you consider the size of the move. The size of the QE will be at least 1,140 billion euros and gold moved higher by… 0.7%. Is it really a strong bullish reaction?
It isn’t. The reaction was strong in the currency market, but not in gold and definitely not in the case of mining stocks. Let’s take a look at the USD Index (charts courtesy of http://stockcharts.com).
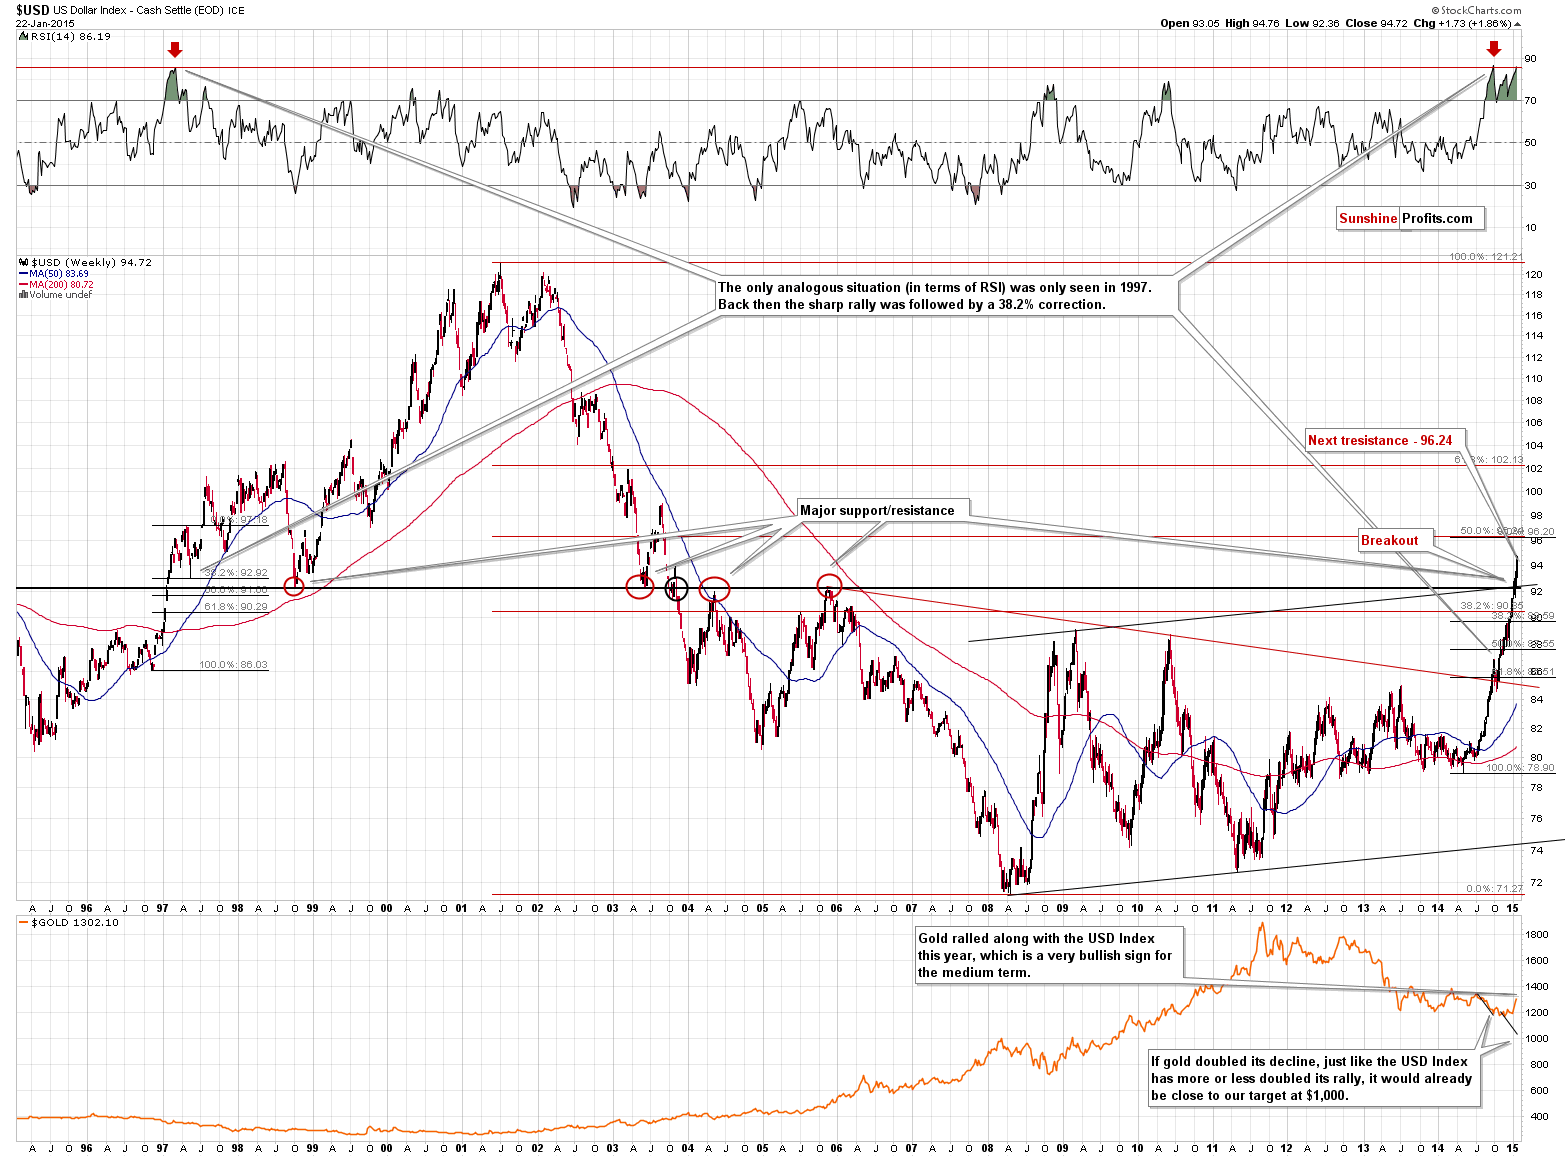
The USD Index rallied just like we’d been expecting it to. The breakout above the 2005 high was confirmed so the next move was likely to be to the upside and we didn’t need to wait long to see one. The USD Index soared as the euro declined on the QE news. The interesting thing about this rally is that it’s likely not over, as no resistance level was reached yesterday and the next significant resistance is above 96. That’s where we expect the USD Index to stop for longer or perhaps where this rally would end. The former seems more likely at this time.
Why didn’t gold decline despite a move higher in the USD Index? Because it was not the inherent strength of the U.S. dollar that caused the move – it was the weakness of the euro (let’s keep in mind that the USD Index is a weighted average of various USD-linked currency rates and the EURUSD pair has the weight of over 50%). Investors were getting out of the euro and some of them were buying U.S. dollars and some of them were buying gold – hence both assets went up.
Now, the USD Index moved much higher yesterday, but gold didn’t move much, which could mean that gold actually did not show strength by holding up well in spite of the USD’s rally, but that it showed weakness by not rallying more given the declining value of the euro.
Overall, we think the implications for gold are bearish at this time for the short term. Naturally, the European QE is a bullish piece of news for gold in the medium- and long term.
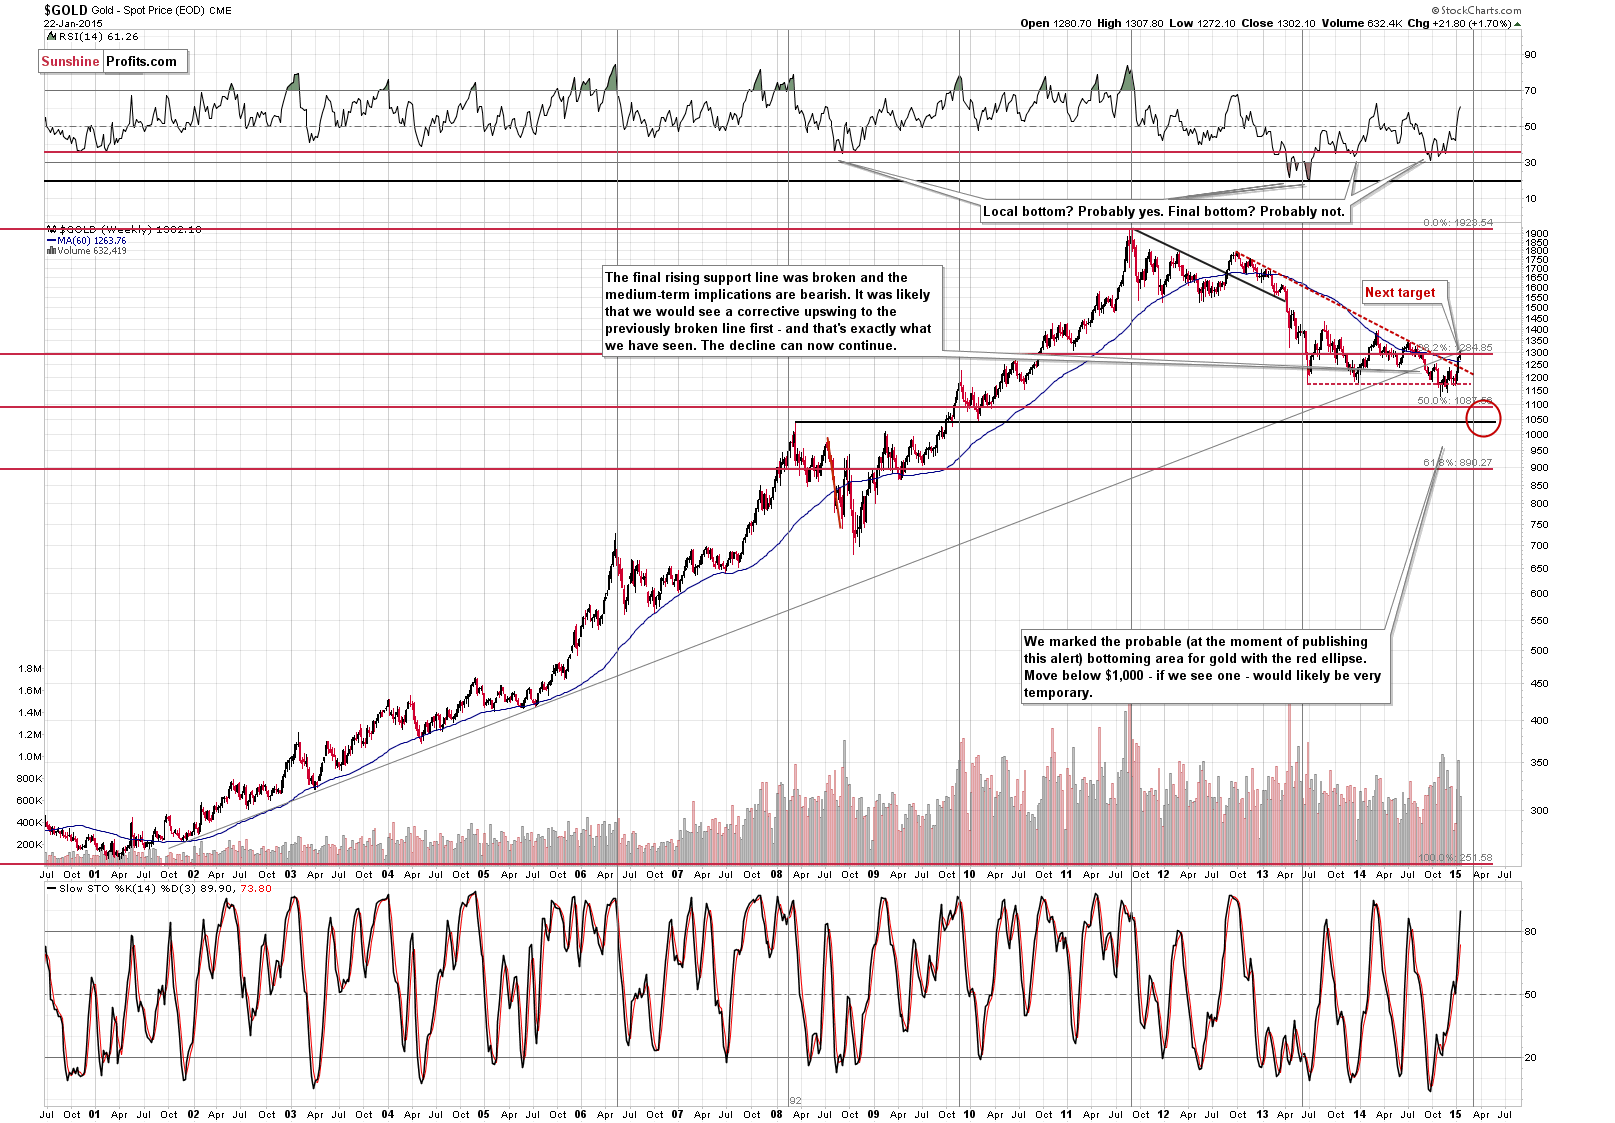
On the long-term chart we can see what we’ve already written above – that gold moved just a little higher. Gold just got an excellent trigger to move higher – above the long-term resistance line – and it didn’t work. Gold didn’t break out. We view it as a bearish sign.
Yesterday’s comments remain mostly up-to-date:
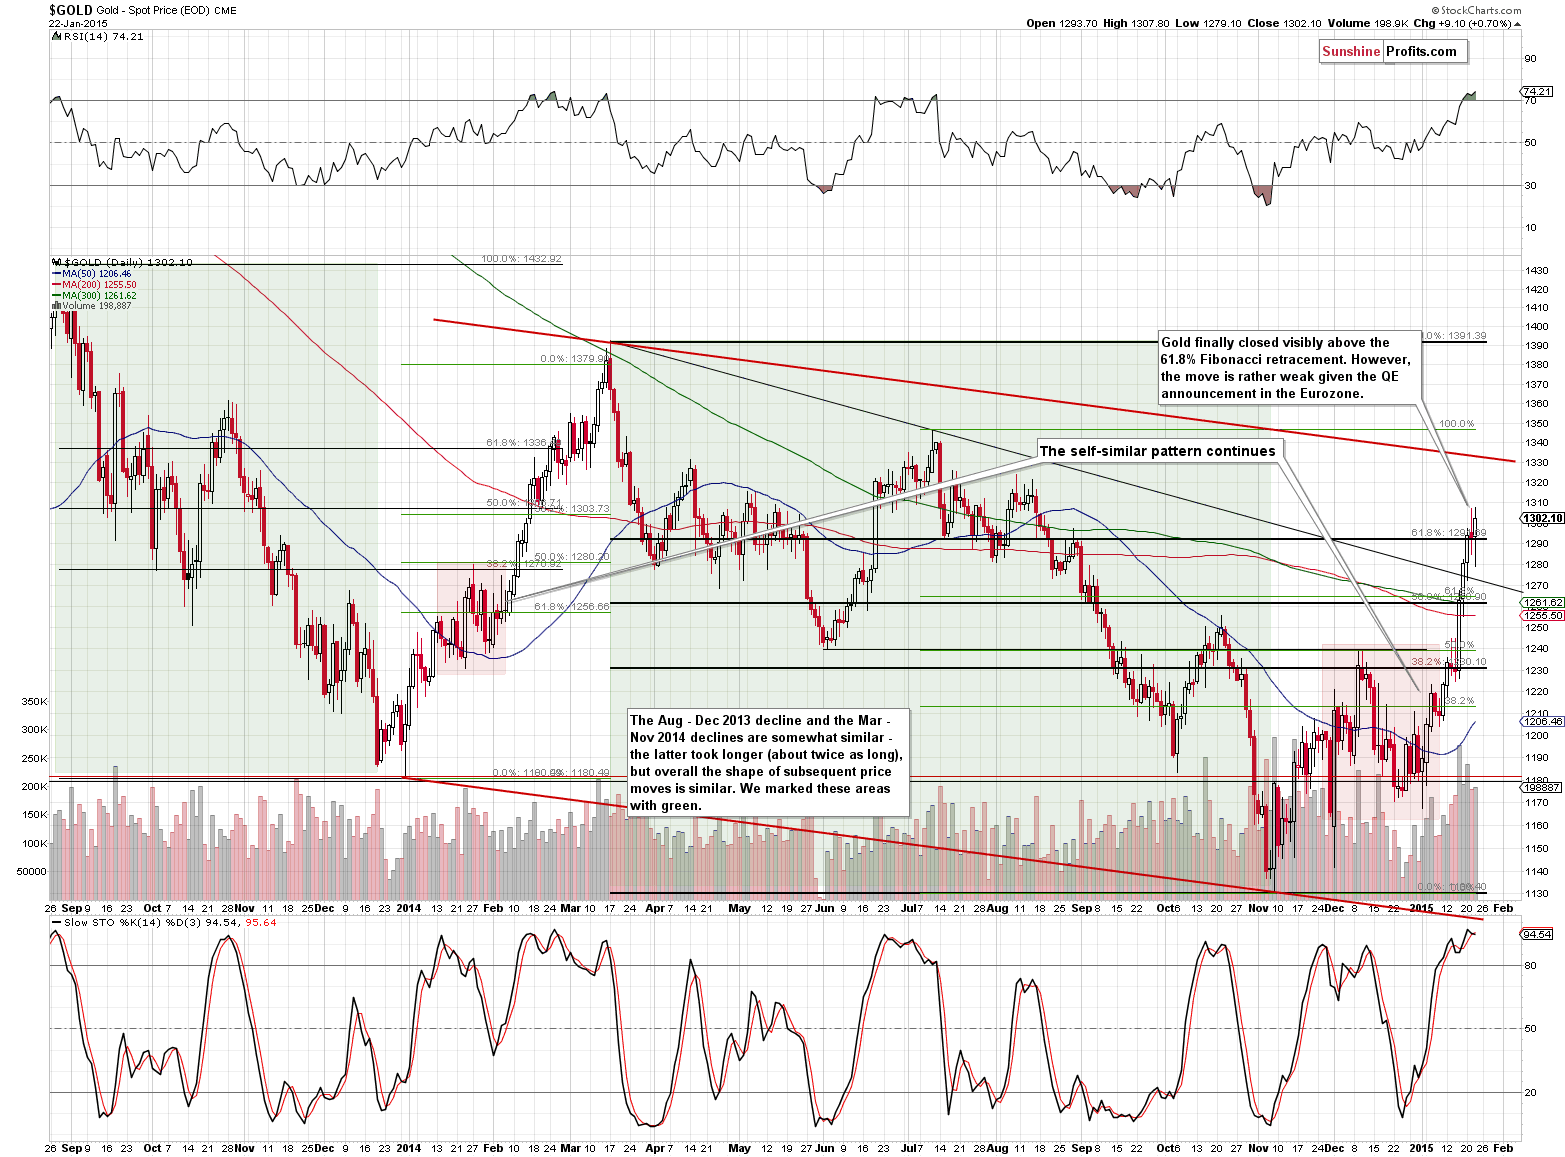
(…) gold moved back and forth around the 61.8% Fibonacci retracement and the psychologically-important level of $1,300. The breakout above this level was not confirmed. It was not invalidated either, so we don’t have a clear sell signal. The RSI Indicator still suggests that lower values for gold are just around the corner, but since this signal was not very precise previously (gold was close to the top but not at the top when we previously had the RSI above 70), we might need to wait for the top a few more days.
We finally saw some strength in gold, which might seem encouraging until you recall what caused the move. The move was “supposed to” be bigger given the announcement. The size of the move is something that looks like it’s about to be erased and the breakout seems likely to be invalidated. At this time we think that 2 additional daily closes would be required above the 61.8% Fibonacci retracement until we can say that the breakout is confirmed and that higher prices are likely.
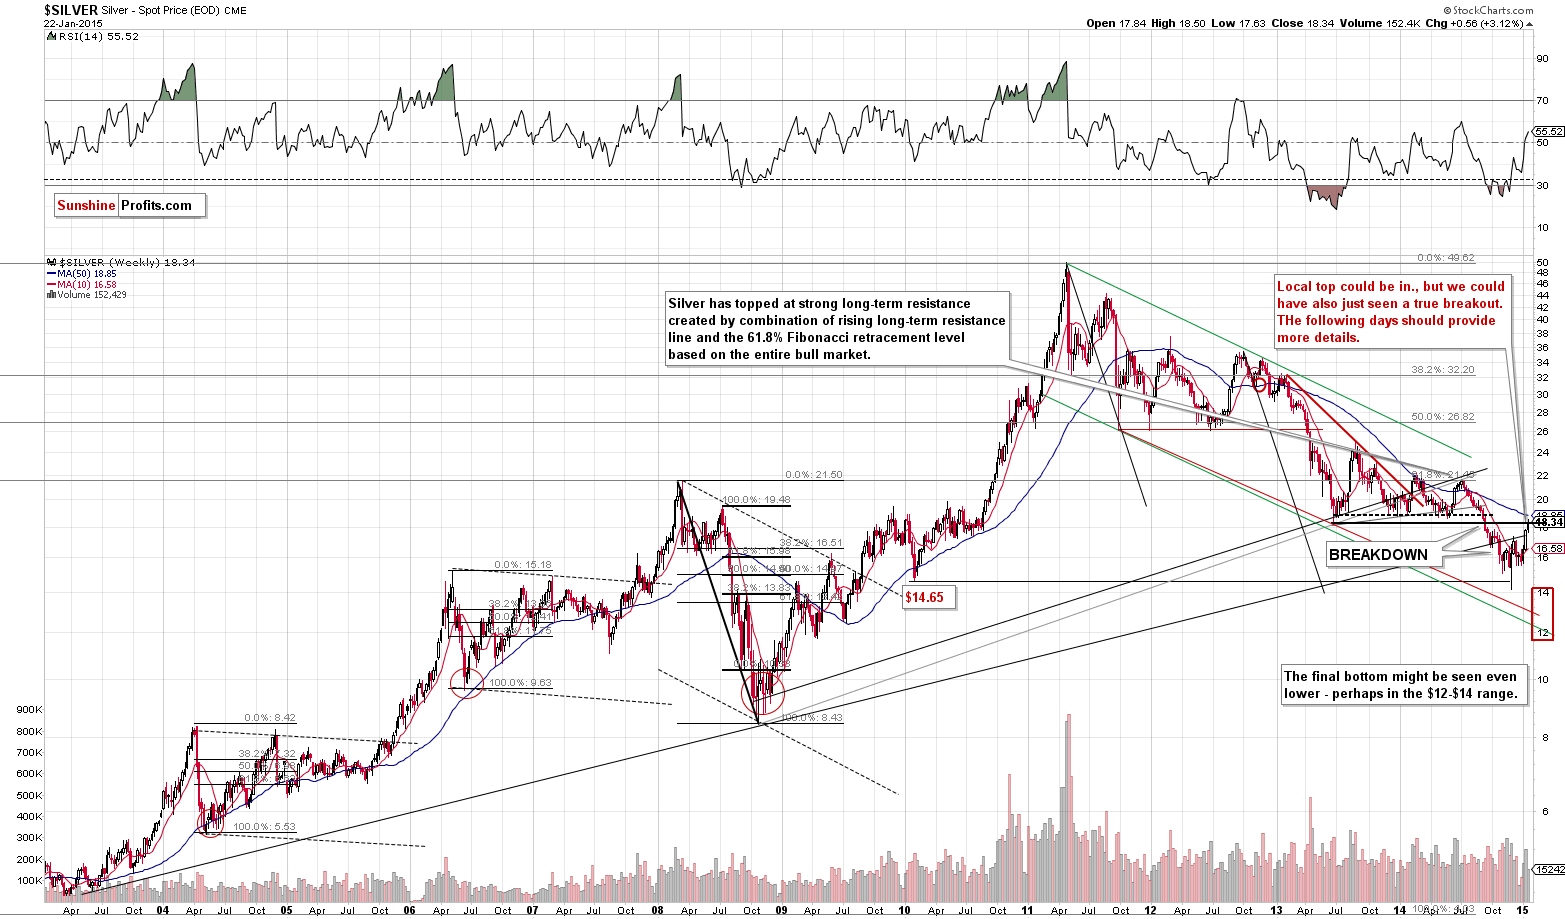
We have a similar situation in silver. The white metal moved higher, but only slightly above the 2013 low. The breakout could be invalidated any day now, especially given the size of the rally and comparing it to what caused it.
In yesterday’s and previous alerts we wrote the following:
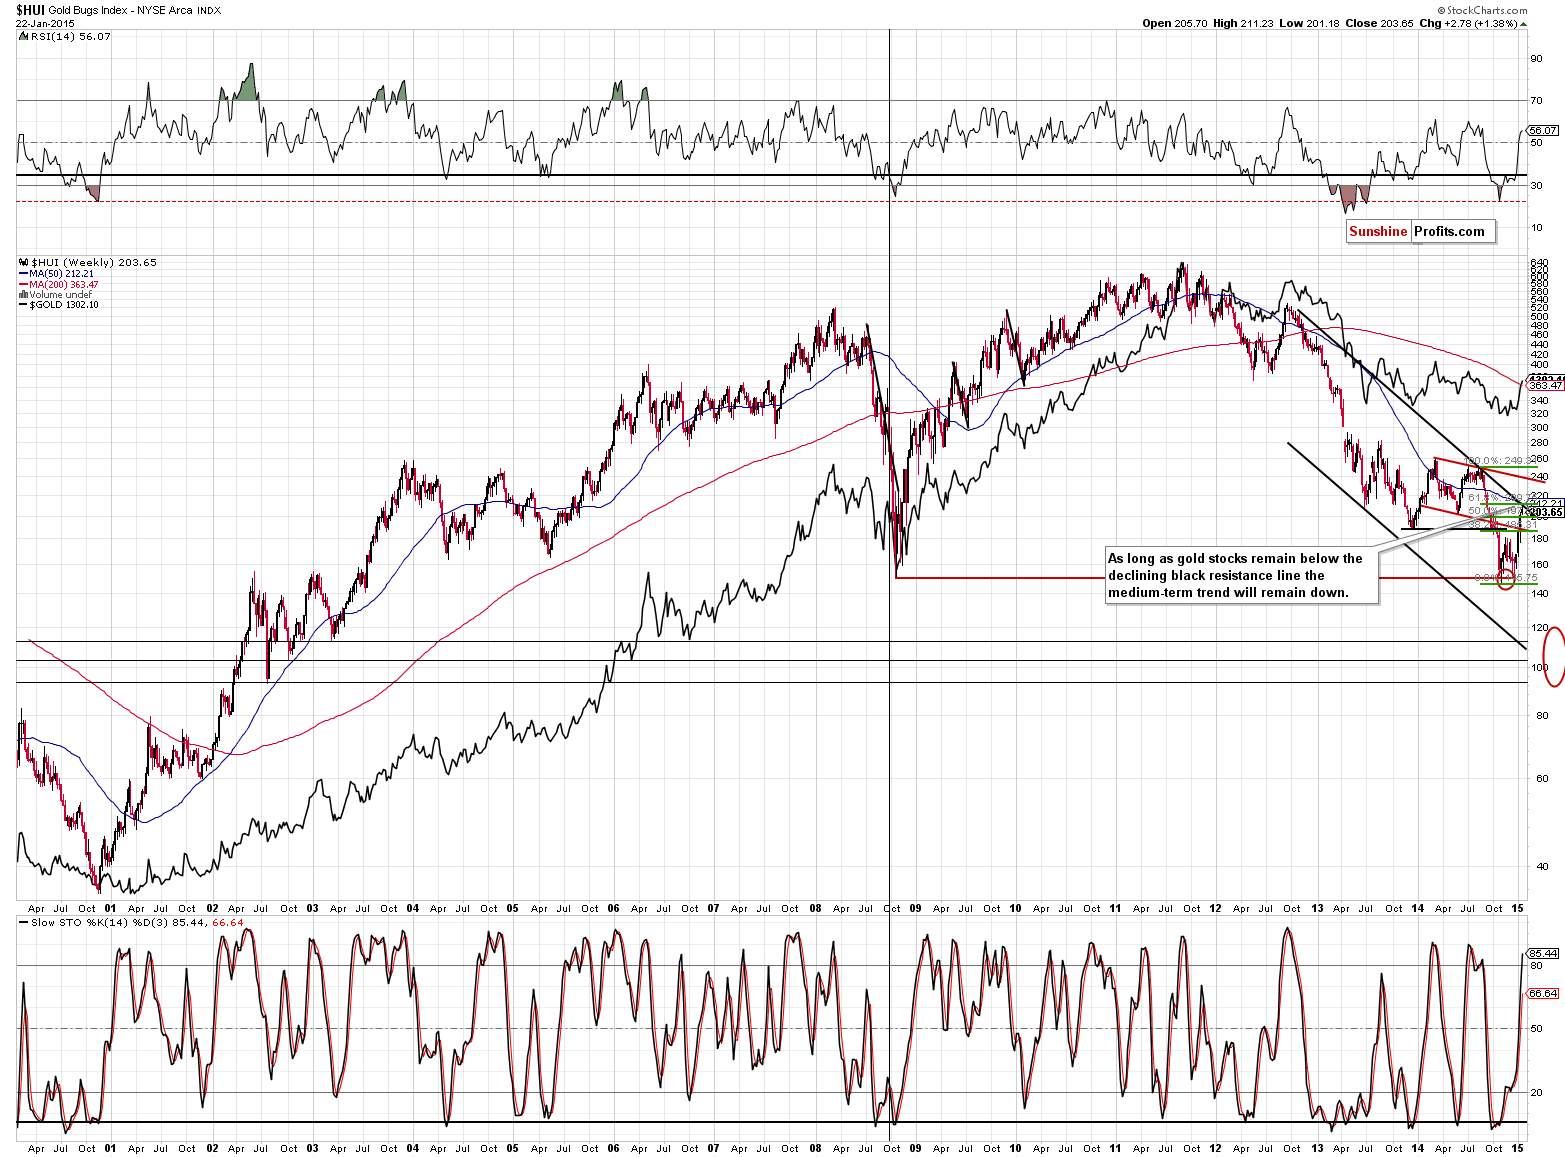
The 3 important resistance levels intersect close to the 210 level: the 61.8% Fibonacci retracement, the 50-week moving average, and – most importantly – the declining long-term resistance line. If gold stocks manage to break and confirm the breakout above this level, it might serve as a confirmation that another major upswing is underway. For now, the current rally looks similar to the corrections that we saw in July 2013, in late-2013 to early-2014, and in June 2014.
This resistance (combination of resistances) was reached (…). The HUI Index is either about to break out or about to decline once again. Since there has been no breakout so far, the odds are that it will decline once again.
We already saw a decline yesterday (which was more visible than the one seen in gold), so we have a small indication that we’ll see another decline shortly. To be honest, that’s not a strong indication. Since gold stocks reached a strong resistance after a visible rally, then a pullback is to be expected and is not necessarily a sign of big weakness. It is more bearish than not, though.
Yesterday, gold stocks had a good reason to rally (Euro-QE announcement) but they didn’t – they declined. Consequently, it seems that the decline was indeed indicating weakness in the precious metals market.
Summing up, based on the announcement of the QE program in the Eurozone, the situation in the precious metals market improved for the medium and long term, but based on the gold’s, silver’s and – most importantly – mining stocks’ reaction, the outlook deteriorated for the short term. It now seems more likely that we will see weakness in the precious metals market in the coming days. Consequently, it seems that using a small (half of the regular size of the trade) amount of capital to profit from the short-term decline in gold, silver and mining stocks is justified from the risk/reward perspective. The trade is risky, so we are using a limited amount of capital. We will likely increase it if we see some kind of bearish confirmations in the coming days.
We will be re-evaluating these positions on a daily basis and if we think that the situation no longer justifies keeping small short positions, we’ll let you know. As always, we’ll keep you – our subscribers – informed.
To summarize:
Trading capital (our opinion): Short positions (half) in gold, silver and mining stocks with the following stop-loss orders and initial (!) target prices:
- Gold: initial target level: $1,245; stop-loss: $1,318, initial target level for the DGLD ETN: $64.60 ; stop loss for the DGLD ETN $55.00
- Silver: initial target level: $16.73 ; stop-loss: $18.63, initial target level for the DSLV ETN: $55.63 ; stop loss for DSLV ETN $41.94
- Mining stocks (price levels for the GDX ETN): initial target level: $20.40 ; stop-loss: $24.23, initial target level for the DUST ETN: $15.55 ; stop loss for the DUST ETN $9.28
In case one wants to bet on lower junior mining stocks' prices, here are the stop-loss details and initial target prices:
- GDXJ: initial target level: $25.43 ; stop-loss: $32.17
- JDST: initial target level: $10.50 ; stop-loss: $5.19
Long-term capital (our opinion): Half positions in gold, half positions in silver, half position in platinum and half position in mining stocks.
Insurance capital (our opinion): Full position
Please note that a full position doesn’t mean using all of the capital for a given trade. You will find details on our thoughts on gold portfolio structuring in the Key Insights section on our website.
As a reminder – “initial target price” means exactly that – an “initial” one, it’s not a price level at which we suggest closing positions. If this becomes the case (like it did in the previous trade) we will refer to these levels as levels of exit orders (exactly as we’ve done previously). Stop-loss levels, however, are naturally not “initial”, but something that, in our opinion, might be entered as an order.
Since it is impossible to synchronize target prices and stop-loss levels for all the ETFs and ETNs with the main markets that we provide these levels for (gold, silver and mining stocks – the GDX ETF), the stop-loss levels and target prices for other ETNs and ETF (among other: UGLD, DGLD, USLV, DSLV, NUGT, DUST, JNUG, JDST) are provided as supplementary, and not as “final”. This means that if a stop-loss or a target level is reached for any of the “additional instruments” (DGLD for instance), but not for the “main instrument” (gold in this case), we will view positions in both gold and DGLD as still open and the stop-loss for DGLD would have to be moved lower. On the other hand, if gold moves to a stop-loss level but DGLD doesn’t, then we will view both positions (in gold and DGLD) as closed. In other words, since it’s not possible to be 100% certain that each related instrument moves to a given level when the underlying instrument does, we can’t provide levels that would be binding. The levels that we do provide are our best estimate of the levels that will correspond to the levels in the underlying assets, but it will be the underlying assets that one will need to focus on regarding the sings pointing to closing a given position or keeping it open. We might adjust the levels in the “additional instruments” without adjusting the levels in the “main instruments”, which will simply mean that we have improved our estimation of these levels, not that we changed our outlook on the markets. We are already working on a tool that would update these levels on a daily basis for the most popular ETFs, ETNs and individual mining stocks.
Our preferred ways to invest in and to trade gold along with the reasoning can be found in the how to buy gold section. Additionally, our preferred ETFs and ETNs can be found in our Gold & Silver ETF Ranking.
As always, we'll keep you - our subscribers - updated should our views on the market change. We will continue to send out Gold & Silver Trading Alerts on each trading day and we will send additional Alerts whenever appropriate.
The trading position presented above is the netted version of positions based on subjective signals (opinion) from your Editor, and the automated tools (SP Indicators and the upcoming self-similarity-based tool).
As a reminder, Gold & Silver Trading Alerts are posted before or on each trading day (we usually post them before the opening bell, but we don't promise doing that each day). If there's anything urgent, we will send you an additional small alert before posting the main one.
=====
Latest Free Trading Alerts:
Yesterday, the European Central Bank launched its large-scale buying of government bonds, a policy known as quantitative easing program. ECB will purchase €60 billion per month, starting in March and continuing until late 2016. Additionally, ECB kept its main lending rate unchanged at 0.05% and a separate rate on overnight bank deposits stored with the central bank at minus 0.2%, which means that banks will have to pay a fee to keep surplus funds at the ECB. In these circumstances, EUR/USD declined sharply, approaching the recent low. What’s next?
Forex Trading Alert: Europe In Focus
=====
Hand-picked precious-metals-related links:
Euro-priced gold hits highest since April 2013
World Bank: Commodities falling like it's 1985
GRAPH: Gold price vs bond buys shows limits of QE
Russia continues to build its gold reserves
=====
In other news:
European QE, Gold and the Swiss Franc
What Mario Draghi Said When Asked If His QE Will Unleash Hyperinflation
Saudi Arabia’s New King Probably Will Not Change Current Oil Policy
=====
Thank you.
Sincerely,
Przemyslaw Radomski, CFA
Founder, Editor-in-chief
Gold & Silver Trading Alerts
Forex Trading Alerts
Oil Investment Updates
Oil Trading Alerts

